China -United States -The Third Opium War

U.S.troops in China during the Boxer Rebellion...
Image via Wikipedia

A brief glance through http://www.treasury.gov/resource-center/data-chart-center/tic/Documents/mfh.txt

shows that while US added 600 billion of debt during the past one year, the Chinese actually reduced their exposure by 50 billion Dollars.

so who has been financing the debt for the US for the past one year- It is Japan- eager to keep its currency down and United Kingdom which has pumped in an extra 300 billion of T Bills.

See the whole table at official link above or at goo.gl/qMugp

—————————————————————————————-

China still remembers the Opium Wars in which the then ruling Anglo Saxon superpower used naval superiority to enforce trade and eventual political dependency. Is China unsure of the United States brotherly nice  intentions? They certainly seem to be putting their money that way.

http://en.wikipedia.org/wiki/Opium_Wars

Britain forced the Chinese government into signing theTreaty of Nanking and the Treaty of Tianjin, also known as the Unequal Treaties, which included provisions for the opening of additional ports to unrestricted foreign trade, for fixed tariffs; for the recognition of both countries as equal in correspondence; and for the cession of Hong Kong to Britain. The British also gained extraterritorial rights. Several countries followed Britain and sought similar agreements with China. Many Chinese found these agreements humiliating and these sentiments contributed to the Taiping Rebellion (1850–1864), the Boxer Rebellion (1899–1901), and the downfall of the Qing Dynasty in 1912, putting an end to dynastic China.

———————————————————————————————-

The Koreans can always be depended on provide the first shot in any conflict- and though Anglo-US-Chinese conflict would be expensive- I guess as long as the cost of outstanding debt with China is less than cost of a brief -techno-war , we would see interesting games in this neighborhood. Note China restricts major trade with United States particularly in software, internet services (like Web Advertising, Facebook, Twitter ) and represents a lucrative market for big pharma (especially in psychiatric drugs) and big tech once it reforms its intellectual property rights. Software would be the opium of the 21st Century- if Chinese resist the Treasury Bills as their poppy flowers. The widespread Western media coverage of school kids murders by pyschopaths is also a trade tactic to encourage flow of more US made medicine in the Chinese market.

It would also help create an economic revival in the United States to exaggerate the Chinese threat (remember Sputnik) and build up its own cyber spending. Any military or cyber humiliation for the ruling party in China can help create a political vacuum for more malleable and agreeable alternatives to emerge.

(to be continued)


An Introduction to Data Mining-online book

I was reading David Smith’s blog http://blog.revolutionanalytics.com/

where he mentioned this interview of Norman Nie, at TDWI

http://tdwi.org/Articles/2010/11/17/R-101.aspx?Page=2–

where I saw this link (its great if you want to study Data Mining btw)

http://www.kdnuggets.com/education/usa-canada.html –

and I c/liked the U Toronto link

http://chem-eng.utoronto.ca/~datamining/

Best of All- I really liked this online book created by Professor S. Sayad

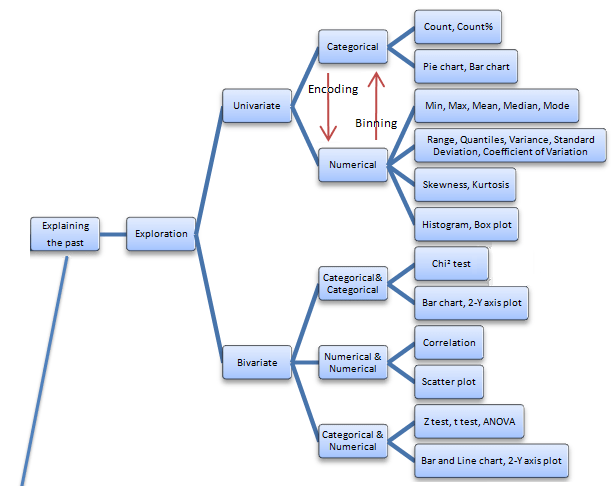
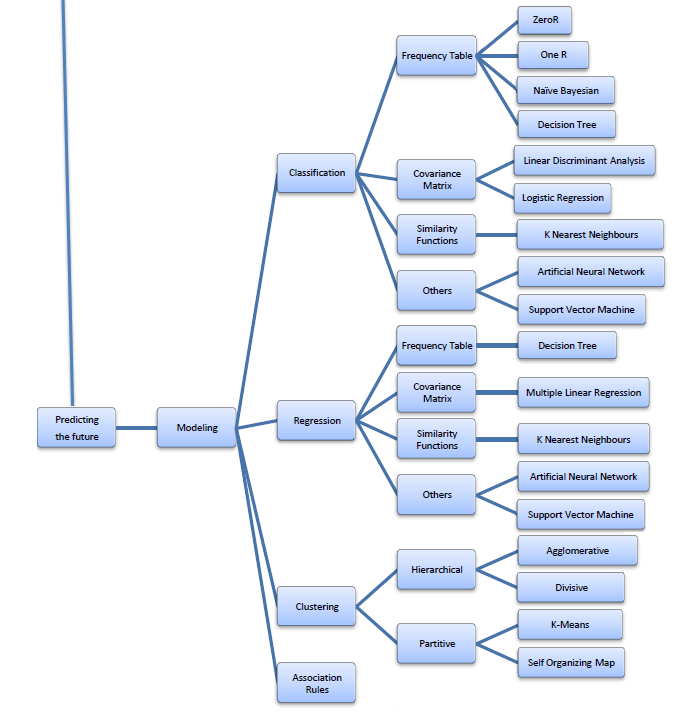
Its succinct and beautiful and describes all of the Data Mining you want to read in one Map (actually 4 images painstakingly assembled with perfection)

The best thing is- in the original map- even the sub items are click-able for specifics like Pie Chart and Stacked Column chart are not in one simple drop down like Charts- but rather by nature of the kind of variables that lead to these charts. For doing that- you would need to go to the site itself- ( see http://chem-eng.utoronto.ca/~datamining/dmc/categorical_variables.htm

vs

http://chem-eng.utoronto.ca/~datamining/dmc/categorical_numerical.htm

Again- there is no mention of the data visualization software used to create the images but I think I can take a hint from the Software Page which says software used are-

Software

See it on your own-online book (c)Professor S. Sayad

Really good DIY tutorial

http://chem-eng.utoronto.ca/~datamining/dmc/data_mining_map.htm

American Decline- Why outsourcing doesnt make sense

Bureau of Labor Statistics logo RGB colors.
Image via Wikipedia

Here is a celebrated graphic from an American journalist using U.S. Department of Labor’s Bureau of Labor Statistics. It is a good example of using time as a dimension for animation- and heat maps for geography enabled visualizations.

————————–According to the U.S. Department of Labor’s Bureau of Labor Statistics, there are nearly 31 million people currently unemployed — that’s including those involuntarily working part time and those who want a job, but have given up on trying to find one. In the face of the worst economic upheaval since the Great Depression, millions of Americans are hurting. “The Decline: The Geography of a Recession,” as created by labor writer LaToya Egwuekwe, serves as a vivid representation of just how much. Watch the deteriorating transformation of the U.S. economy from January 2007 — approximately one year before the start of the recession — to the most recent unemployment data available today. Original link: http://www.latoyaegwuekwe.com/geographyofarecession.html. For more information, email latoya.egwuekwe@yahoo.com

————————————————————————————-


31 million unemployed- Does a US corporation seriously think that it can build everything OUTSIDE America and SELL INSIDE America. or who think it is okay intellectual property continues to be stolen as long as labor is cheap.

Shame on you if you outsourced your neighbour’s jobs- or would rather hire in a geography where they steal your intellectual property.


This Christmastime – May the Ghost of  the Unemployed Family Christmases visit you in your sleep instead.

AsterData partners with Tableau

This chart represents several constituent comp...
Image via Wikipedia

Tableau which has been making waves recntly with its great new data visualization tool announced a partner with my old friends at AsterData. Its really cool piece of data vis and very very fast on the desktop- so I can imagine what speed it can help with AsterData’s MPP Row and Column Zingbang AND Parallel Analytical Functions

Tableau and AsterData also share the common Stanfordian connection (but it seems software is divided quite equally between Stanford, Hardvard Dropouts and North Carolina )

It remains to be seen in this announcement how much each company  can leverage the partnership or whether it turns like the SAS Institute- AsterData partnership last year or whether it is just to announce connectors in their software to talk to each other.

See a Tableau vis at

http://public.tableausoftware.com/views/geographyofdiabetes/Dashboard2?:embed=yes&:toolbar=yes

AsterData remains the guys with the potential but I would be wrong to say MapReduce–SQL is as hot in December 2010 as it was in June 2009- and the elephant in the room would be Hadoop. That and Google’s continued shyness from encashing its principal comptency of handling Big Data (but hush – I signed a NDA with the Google Prediction API– so things maaaay change very rapidly on ahem that cloud)

Disclaimer- AsterData was my internship sponsor during my winter training while at Univ of  Tenn.


PAWCON Bay Area March

The biggest Predictive Analytics Conference comes back to the SF Bay in March next year.

From

http://www.predictiveanalyticsworld.com/sanfrancisco/2011/

Predictive Analytics World March 2011 in San Francisco is packed with the top predictive analytics experts, practitioners, authors and business thought leaders, including keynote speakers:


Sugato Basu, Ph.D.
Senior Research Scientist
Google
Lessons Learned in Predictive Modeling 
for Ad Targeting

Eric Siegel, Ph.D.
Conference Chair
Predictive Analytics World
Five Ways Predictive Analytics
Cuts Enterprise Risk


Plus special plenary sessions from industry heavy-weights:


Andreas S. Weigend, Ph.D.
weigend.com
Former Chief Scientist, Amazon.com
The State of the Social Data Revoltion

John F. Elder, Ph.D.
CEO and Founder
Elder Research
Data Mining Lessons Learned


Predictive Analytics World focuses on concrete examples of deployed predictive analytics. Hear from the horse’s mouth precisely how Fortune 500 analytics competitors and other top practitioners deploy predictive modeling, and what kind of business impact it delivers. Click here to view the agenda at-a-glance.

PAW SF 2011 will feature speakers with case studies from leading enterprises. such as:

PAW’s March agenda covers hot topics and advanced methods such as uplift (net lift) modeling, ensemble models, social data, search marketing, crowdsourcing, blackbox trading, fraud detection, risk management, survey analysis and otherinnovative applications that benefit organizations in new and creative ways.

Join PAW and access the best keynotes, sessions, workshops, exposition, expert panel, live demos, networking coffee breaks, reception, birds-of-a-feather lunches, brand-name enterprise leaders, and industry heavyweights in the business.


Jobs in Analytics

Here are some jobs from Vincent Granville, founder Analyticbridge. Please contact him directly- I just thought the Season of Joy should have better jobs than currently.

————————————————————————————–

Several job ads recently posted on DataShaping / AnalyticBridge, across United Sates and in Europe. Use the DataShaping search box to find more opportunities.

Job ads are posted at:


Selected opportunities:

Quantitative Modeling Consultants – Agilex (Alexandria, VA)
Sr. Software Development Engineers – Agilex (Alexandria, VA)
Actuary – FBL Financial Group (Des Moines, IA)
Relevance scientist – Yandex Labs (Palo Alto, CA)
Research Engineer, Search Ranking – Chomp (San Francisco, CA)
Mathematical Modeling and Optimization – Exxon (Clinton, NJ)
Data Analyst – DISH Network (Englewood, CO)
Sr Aviation Planning Research & Data Analyst – Port of Seattle (Seattle, WA)
Statistician / Quantitative Analyst – Indeed (Austin, TX)
Statistician – Pratt & Whitney (East Hartford, CT)
Biostatistician – The J. David Gladstone Institutes (San Francisco, CA)
Customer Service Representative (oklahoma, OK)
Program Associate – Cambridge Systematics (Washington D.C., DC)
Sr Risk Analyst – Paypal (Omaha, NE)
Sr. Actuarial Analyst – Farmers (Simi Valley, CA)
Senior Statistician, Data Services – Equifax (Alpharetta, GA)
Business Intelligence Analyst – Burbery (NYC, NY)
Fact Extraction – Amazon (Seattle, WA)
Senior Researcher – Bing (Bellevue, WA)
Senior Statistical Research Analyst – Walt Disney (Lake Buena Vista, FL)
Statistician – Capital One (Nottingham, NH)
Lead Data Analyst – Barclays (Northampton, UK)
Analytical Data Scientist – Aviagen (Huntsville, AL or Edinburgh, UK)
VP of Engineering for Analytics (Bay Area, CA)
Senior Software Engineer – Numenta (Redwood City, CA)
Numenta Internship Program – Numenta (Redwood City, CA)
Director of Analytics – Mozilla Corporation (Mountain View, CA)
Senior Sales Engineer – Statsoft (NY, NY)

Short Interview Jill Dyche

Here is brief one question interview with Jill Dyche , founder Baseline Consulting.


In 2010.


  • It was more about consciousness-raising in the executive suite—
  • getting C-level managers to understand the ongoing value proposition of BI,
  • why MDM isn’t their father’s database, and
  • how data governance can pay for itself over time.
  • Some companies succeeded with these consciousness-raising efforts. Some didn’t.


But three big ones in 2011 would be:

  1. Predictive analytics in the cloud. The technology is now ready, and so is the market—and that includes SMB companies.
  2. Enterprise search being baked into (commoditized) BI software tools. (The proliferation of static reports is SO 2006!)
  3. Data governance will begin paying dividends. Until now it was all about common policies for data. In 2011, it will be about ROI.

I do a “Predictions for the coming year” article every January for TDWI,

Note- Jill ‘s January TDWI article seems worth waiting for in this case.

About-

Source-http://www.baseline-consulting.com/pages/page.asp?page_id=49125

Partner and Co-Founder

Jill Dyché is a partner and co-founder of Baseline Consulting.  She is responsible for key client strategies and market analysis in the areas of data governance, business intelligence, master data management, and customer relationship management. 

Jill counsels boards of directors on the strategic importance of their information investments.

Author

Jill is the author of three books on the business value of IT. Jill’s first book, e-Data (Addison Wesley, 2000) has been published in eight languages. She is a contributor to Impossible Data Warehouse Situations: Solutions from the Experts (Addison Wesley, 2002), and her book, The CRM Handbook (Addison Wesley, 2002), is the bestseller on the topic. 

Jill’s work has been featured in major publications such as Computerworld, Information Week, CIO Magazine, the Wall Street Journal, the Chicago Tribune and Newsweek.com. Jill’s latest book, Customer Data Integration (John Wiley and Sons, 2006) was co-authored with Baseline partner Evan Levy, and shows the business breakthroughs achieved with integrated customer data.

Industry Expert

Jill is a featured speaker at industry conferences, university programs, and vendor events. She serves as a judge for several IT best practice awards. She is a member of the Society of Information Managementand Women in Technology, a faculty member of TDWI, and serves as a co-chair for the MDM Insight conference. Jill is a columnist for DM Review, and a blogger for BeyeNETWORK and Baseline Consulting.