Chapman/Hall announces new series on R

Rice University, Houston, Texas, USA - Cohen H...
Image via Wikipedia
R Authors get more choice and variety now-
http://www.mail-archive.com/r-help@r-project.org/msg122965.html
We are pleased to announce the launch of a new series of books on R. 

Chapman & Hall/CRC: The R Series

Aims and Scope
This book series reflects the recent rapid growth in the development and 
application of R, the programming language and software environment for 
statistical computing and graphics. R is now widely used in academic research, 
education, and industry. It is constantly growing, with new versions of the 
core software released regularly and more than 2,600 packages available. It is 
difficult for the documentation to keep pace with the expansion of the 
software, and this vital book series provides a forum for the publication of 
books covering many aspects of the development and application of R.

The scope of the series is wide, covering three main threads:
• Applications of R to specific disciplines such as biology, epidemiology, 
genetics, engineering, finance, and the social sciences.
• Using R for the study of topics of statistical methodology, such as linear 
and mixed modeling, time series, Bayesian methods, and missing data.
• The development of R, including programming, building packages, and graphics.

The books will appeal to programmers and developers of R software, as well as 
applied statisticians and data analysts in many fields. The books will feature 
detailed worked examples and R code fully integrated into the text, ensuring 
their usefulness to researchers, practitioners and students.

Series Editors
John M. Chambers (Department of Statistics, Stanford University, USA; 
j...@stat.stanford.edu)
Torsten Hothorn (Institut für Statistik, Ludwig-Maximilians-Universität, 
München, Germany; torsten.hoth...@stat.uni-muenchen.de)
Duncan Temple Lang (Department of Statistics, University of California, Davis, 
USA; dun...@wald.ucdavis.edu)
Hadley Wickham (Department of Statistics, Rice University, Houston, Texas, USA; 
had...@rice.edu)

Call for Proposals
We are interested in books covering all aspects of the development and 
application of R software. If you have an idea for a book, please contact one 
of the series editors above or one of the Chapman & Hall/CRC statistics 
acquisitions editors below. Please provide brief details of topic, audience, 
aims and scope, and include an outline if possible.

We look forward to hearing from you.

Best regards,Rob Calver (rob.cal...@informa.com)
David Grubbs (david.gru...@taylorandfrancis.com)
John Kimmel (john.kim...@taylorandfrancis.com)


Handling time and date in R

John Harrison's famous chronometer
Image via Wikipedia

One of the most frustrating things I had to do while working as financial business analysts was working with Data Time Formats in Base SAS. The syntax was simple enough and SAS was quite good with handing queries to the Oracle data base that the client was using, but remembering the different types of formats in SAS language was a challenge (there was a date9. and date6 and mmddyy etc )

Data and Time variables are particularly important variables in financial industry as almost everything is derived variable from the time (which varies) while other inputs are mostly constants. This includes interest as well as late fees and finance fees.

In R, date and time are handled quite simply-

Use the strptime( dataset, format) function to convert the character into string

For example if the variable dob is “01/04/1977) then following will convert into a date object

z=strptime(dob,”%d/%m/%Y”)

and if the same date is 01Apr1977

z=strptime(dob,"%d%b%Y")


does the same

For troubleshooting help with date and time, remember to enclose the formats

%d,%b,%m and % Y in the same exact order as the original string- and if there are any delimiters like ” -” or “/” then these delimiters are entered in exactly the same order in the format statement of the strptime

Sys.time() gives you the current date-time while the function difftime(time1,time2) gives you the time intervals( say if you have two columns as date-time variables)


What are the various formats for inputs in date time?

%a
Abbreviated weekday name in the current locale. (Also matches full name on input.)
%A
Full weekday name in the current locale. (Also matches abbreviated name on input.)
%b
Abbreviated month name in the current locale. (Also matches full name on input.)
%B
Full month name in the current locale. (Also matches abbreviated name on input.)
%c
Date and time. Locale-specific on output, "%a %b %e %H:%M:%S %Y" on input.
%d
Day of the month as decimal number (01–31).
%H
Hours as decimal number (00–23).
%I
Hours as decimal number (01–12).
%j
Day of year as decimal number (001–366).
%m
Month as decimal number (01–12).
%M
Minute as decimal number (00–59).
%p
AM/PM indicator in the locale. Used in conjunction with %I and not with %H. An empty string in some locales.
%S
Second as decimal number (00–61), allowing for up to two leap-seconds (but POSIX-compliant implementations will ignore leap seconds).
%U
Week of the year as decimal number (00–53) using Sunday as the first day 1 of the week (and typically with the first Sunday of the year as day 1 of week 1). The US convention.
%w
Weekday as decimal number (0–6, Sunday is 0).
%W
Week of the year as decimal number (00–53) using Monday as the first day of week (and typically with the first Monday of the year as day 1 of week 1). The UK convention.
%x
Date. Locale-specific on output, "%y/%m/%d" on input.
%X
Time. Locale-specific on output, "%H:%M:%S" on input.
%y
Year without century (00–99). Values 00 to 68 are prefixed by 20 and 69 to 99 by 19 – that is the behaviour specified by the 2004 POSIX standard, but it does also say ‘it is expected that in a future version the default century inferred from a 2-digit year will change’.
%Y
Year with century.
%z
Signed offset in hours and minutes from UTC, so -0800 is 8 hours behind UTC.
%Z
(output only.) Time zone as a character string (empty if not available).

Also to read the helpful documentation (especially for time zone level, and leap year seconds and differences)
http://stat.ethz.ch/R-manual/R-patched/library/base/html/difftime.html
http://stat.ethz.ch/R-manual/R-patched/library/base/html/strptime.html
http://stat.ethz.ch/R-manual/R-patched/library/base/html/Ops.Date.html
http://stat.ethz.ch/R-manual/R-patched/library/base/html/Dates.html


R for Predictive Modeling:Workshop

A view of the Oakland-San Francisco Bay Bridge...
Image via Wikipedia

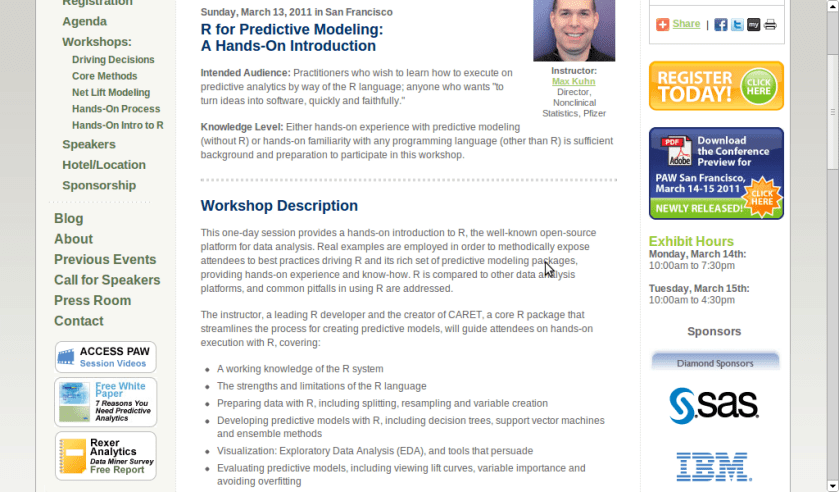
A workshop on using R for Predictive Modeling, by the Director, Non Clinical Stats, Pfizer. Interesting Bay Area Event- part of next edition of Predictive Analytics World

Sunday, March 13, 2011 in San Francisco

R for Predictive Modeling:
A Hands-On Introduction

Intended Audience: Practitioners who wish to learn how to execute on predictive analytics by way of the R language; anyone who wants “to turn ideas into software, quickly and faithfully.”

Knowledge Level: Either hands-on experience with predictive modeling (without R) or hands-on familiarity with any programming language (other than R) is sufficient background and preparation to participate in this workshop.


Workshop Description

This one-day session provides a hands-on introduction to R, the well-known open-source platform for data analysis. Real examples are employed in order to methodically expose attendees to best practices driving R and its rich set of predictive modeling packages, providing hands-on experience and know-how. R is compared to other data analysis platforms, and common pitfalls in using R are addressed.

The instructor, a leading R developer and the creator of CARET, a core R package that streamlines the process for creating predictive models, will guide attendees on hands-on execution with R, covering:

  • A working knowledge of the R system
  • The strengths and limitations of the R language
  • Preparing data with R, including splitting, resampling and variable creation
  • Developing predictive models with R, including decision trees, support vector machines and ensemble methods
  • Visualization: Exploratory Data Analysis (EDA), and tools that persuade
  • Evaluating predictive models, including viewing lift curves, variable importance and avoiding overfitting

Hardware: Bring Your Own Laptop
Each workshop participant is required to bring their own laptop running Windows or OS X. The software used during this training program, R, is free and readily available for download.

Attendees receive an electronic copy of the course materials and related R code at the conclusion of the workshop.


Schedule

  • Workshop starts at 9:00am
  • Morning Coffee Break at 10:30am – 11:00am
  • Lunch provided at 12:30 – 1:15pm
  • Afternoon Coffee Break at 2:30pm – 3:00pm
  • End of the Workshop: 4:30pm

Instructor

Max Kuhn, Director, Nonclinical Statistics, Pfizer

Max Kuhn is a Director of Nonclinical Statistics at Pfizer Global R&D in Connecticut. He has been apply models in the pharmaceutical industries for over 15 years.

He is a leading R developer and the author of several R packages including the CARET package that provides a simple and consistent interface to over 100 predictive models available in R.

Mr. Kuhn has taught courses on modeling within Pfizer and externally, including a class for the India Ministry of Information Technology.


http://www.predictiveanalyticsworld.com/sanfrancisco/2011/r_for_predictive_modeling.php


Interview Luis Torgo Author Data Mining with R

Example of k-nearest neighbour classification
Image via Wikipedia

Here is an interview with Prof Luis Torgo, author of the recent best seller “Data Mining with R-learning with case studies”.

Ajay- Describe your career in science. How do you think can more young people be made interested in science.

Luis- My interest in science only started after I’ve finished my degree. I’ve entered a research lab at the University of Porto and started working on Machine Learning, around 1990. Since then I’ve been involved generally in data analysis topics both from a research perspective as well as from a more applied point of view through interactions with industry partners on several projects. I’ve spent most of my career at the Faculty of Economics of the University of Porto, but since 2008 I’m at the department of Computer Science of the Faculty of Sciences of the same university. At the same time I’ve been a researcher at LIAAD / Inesc Porto LA (www.liaad.up.pt).

I like a lot what I do and like science and the “scientific way of thinking”, but I cannot say that I’ve always thought of this area as my “place”. Most of all I like solving challenging problems through data analysis. If that translates into some scientific outcome than I’m more satisfied but that is not my main goal, though I’m kind of “forced” to think about that because of the constraints of an academic career.

That does not mean I’m not passionate about science, I just think there are many more ways of “doing science” than what is reflected in the usual “scientific indicators” that most institutions seem to be more and more obsessed about.

Regards interesting young people in science that is a hard question that I’m not sure I’m qualified to answer. I do tend to think that young people are more sensible to concrete examples of problems they think are interesting and that science helps in solving, as a way of finding a motivation for facing the hard work they will encounter in a scientific career. I do believe in case studies as a nice way to learn and motivate, and thus my book 😉

Ajay- Describe your new book “Data Mining with R, learning with case studies” Why did you choose a case study based approach? who is the target audience? What is your favorite case study from the book

Luis- This book is about learning how to use R for data mining. The book follows a “learn by doing it” approach to data mining instead of the more common theoretical description of the available techniques in this discipline. This is accomplished by presenting a series of illustrative case studies for which all necessary steps, code and data are provided to the reader. Moreover, the book has an associated web page (www.liaad.up.pt/~ltorgo/DataMiningWithR) where all code inside the book is given so that easy copy-paste is possible for the more lazy readers.

The language used in the book is very informal without many theoretical details on the used data mining techniques. For obtaining these theoretical insights there are already many good data mining books some of which are referred in “further readings” sections given throughout the book. The decision of following this writing style had to do with the intended target audience of the book.

In effect, the objective was to write a monograph that could be used as a supplemental book for practical classes on data mining that exist in several courses, but at the same time that could be attractive to professionals working on data mining in non-academic environments, and thus the choice of this more practically oriented approach.

Regards my favorite case study that is a hard question for an author… still I would probably choose the “Predicting Stock Market Returns” case study (Chapter 3). Not only because I like this challenging problem, but mainly because the case study addresses all aspects of knowledge discovery in a real world scenario and not only the construction of predictive models. It tackles data collection, data pre-processing, model construction, transforming predictions into actions using different trading policies, using business-related performance metrics, implementing a trading simulator for “real-world” evaluation, and laying out grounds for constructing an online trading system.

Obviously, for all these steps there are far too many options to be possible to describe/evaluate all of them in a chapter, still I do believe that for the reader it is important to see the overall picture, and read about the relevant questions on this problem and some possible paths that can be followed at these different steps.

In other words: do not expect to become rich with the solution I describe in the chapter !

Ajay- Apart from R, what other data mining software do you use or have used in the past. How would you compare their advantages and disadvantages with R

Luis- I’ve played around with Clementine, Weka, RapidMiner and Knime, but really only playing with teaching goals, and no serious use/evaluation in the context of data mining projects. For the latter I mainly use R or software developed by myself (either in R or other languages). In this context, I do not think it is fair to compare R with these or other tools as I lack serious experience with them. I can however, tell you about what I see as the main pros and cons of R. The main reason for using R is really not only the power of the tool that does not stop surprising me in terms of what already exists and keeps appearing as contributions of an ever growing community, but mainly the ability of rapidly transforming ideas into prototypes. Regards some of its drawbacks I would probably mention the lack of efficiency when compared to other alternatives and the problem of data set sizes being limited by main memory.

I know that there are several efforts around for solving this latter issue not only from the community (e.g. http://cran.at.r-project.org/web/views/HighPerformanceComputing.html), but also from the industry (e.g. Revolution Analytics), but I would prefer that at this stage this would be a standard feature of the language so the the “normal” user need not worry about it. But then this is a community effort and if I’m not happy with the current status instead of complaining I should do something about it!

Ajay- Describe your writing habit- How do you set about writing the book- did you write a fixed amount daily or do you write in bursts etc

Luis- Unfortunately, I write in bursts whenever I find some time for it. This is much more tiring and time consuming as I need to read back material far too often, but I cannot afford dedicating too much consecutive time to a single task. Actually, I frequently tease my PhD students when they “complain” about the lack of time for doing what they have to, that they should learn to appreciate the luxury of having a single task to complete because it will probably be the last time in their professional life!

Ajay- What do you do to relax or unwind when not working?

Luis- For me, the best way to relax from work is by playing sports. When I’m involved in some game I reset my mind and forget about all other things and this is very relaxing for me. A part from sports I enjoy a lot spending time with my family and friends. A good and long dinner with friends over a good bottle of wine can do miracles when I’m too stressed with work! Finally,I do love traveling around with my family.

Luis Torgo

Short Bio: Luis Torgo has a degree in Systems and Informatics Engineering and a PhD in Computer Science. He is an Associate Professor of the Department of Computer Science of the Faculty of Sciences of the University of Porto. He is also a researcher of the Laboratory of Artificial Intelligence and Data Analysis (LIAAD) belonging to INESC Porto LA. Luis Torgo has been an active researcher in Machine Learning and Data Mining for more than 20 years. He has lead several academic and industrial Data Mining research projects. Luis Torgo accompanies the R project almost since its beginning, using it on his research activities. He teaches R at different levels and has given several courses in different countries.

For reading “Data Mining with R” – you can visit this site, also to avail of a 20% discount the publishers have generously given (message below)-

For more information and to place an order, visit us at http://www.crcpress.com.  Order online and apply 20% Off discount code 907HM at checkout.  CRC is pleased to offer free standard shipping on all online orders!

link to the book page  http://www.crcpress.com/product/isbn/9781439810187

Price: $79.95
Cat. #: K10510
ISBN: 9781439810187
ISBN 10: 1439810184
Publication Date: November 09, 2010
Number of Pages: 305
Availability: In Stock
Binding(s): Hardback 

Interview Ajay Ohri Decisionstats.com with DMR

From-

http://www.dataminingblog.com/data-mining-research-interview-ajay-ohri/

Here is the winner of the Data Mining Research People Award 2010: Ajay Ohri! Thanks to Ajay for giving some time to answer Data Mining Research questions. And all the best to his blog, Decision Stat!

Data Mining Research (DMR): Could you please introduce yourself to the readers of Data Mining Research?

Ajay Ohri (AO): I am a business consultant and writer based out of Delhi- India. I have been working in and around the field of business analytics since 2004, and have worked with some very good and big companies primarily in financial analytics and outsourced analytics. Since 2007, I have been writing my blog at http://decisionstats.com which now has almost 10,000 views monthly.

All in all, I wrote about data, and my hobby is also writing (poetry). Both my hobby and my profession stem from my education ( a masters in business, and a bachelors in mechanical engineering).

My research interests in data mining are interfaces (simpler interfaces to enable better data mining), education (making data mining less complex and accessible to more people and students), and time series and regression (specifically ARIMAX)
In business my research interests software marketing strategies (open source, Software as a service, advertising supported versus traditional licensing) and creation of technology and entrepreneurial hubs (like Palo Alto and Research Triangle, or Bangalore India).

DMR: I know you have worked with both SAS and R. Could you give your opinion about these two data mining tools?

AO: As per my understanding, SAS stands for SAS language, SAS Institute and SAS software platform. The terms are interchangeably used by people in industry and academia- but there have been some branding issues on this.
I have not worked much with SAS Enterprise Miner , probably because I could not afford it as business consultant, and organizations I worked with did not have a budget for Enterprise Miner.
I have worked alone and in teams with Base SAS, SAS Stat, SAS Access, and SAS ETS- and JMP. Also I worked with SAS BI but as a user to extract information.
You could say my use of SAS platform was mostly in predictive analytics and reporting, but I have a couple of projects under my belt for knowledge discovery and data mining, and pattern analysis. Again some of my SAS experience is a bit dated for almost 1 year ago.

I really like specific parts of SAS platform – as in the interface design of JMP (which is better than Enterprise Guide or Base SAS ) -and Proc Sort in Base SAS- I guess sequential processing of data makes SAS way faster- though with computing evolving from Desktops/Servers to even cheaper time shared cloud computers- I am not sure how long Base SAS and SAS Stat can hold this unique selling proposition.

I dislike the clutter in SAS Stat output, it confuses me with too much information, and I dislike shoddy graphics in the rendering output of graphical engine of SAS. Its shoddy coding work in SAS/Graph and if JMP can give better graphics why is legacy source code preventing SAS platform from doing a better job of it.

I sometimes think the best part of SAS is actually code written by Goodnight and Sall in 1970’s , the latest procs don’t impress me much.

SAS as a company is something I admire especially for its way of treating employees globally- but it is strange to see the rest of tech industry not following it. Also I don’t like over aggression and the SAS versus Rest of the Analytics /Data Mining World mentality that I sometimes pick up when I deal with industry thought leaders.

I think making SAS Enterprise Miner, JMP, and Base SAS in a completely new web interface priced at per hour rates is my wishlist but I guess I am a bit sentimental here- most data miners I know from early 2000’s did start with SAS as their first bread earning software. Also I think SAS needs to be better priced in Business Intelligence- it seems quite cheap in BI compared to Cognos/IBM but expensive in analytical licensing.

If you are a new stats or business student, chances are – you may know much more R than SAS today. The shift in education at least has been very rapid, and I guess R is also more of a platform than a analytics or data mining software.

I like a lot of things in R- from graphics, to better data mining packages, modular design of software, but above all I like the can do kick ass spirit of R community. Lots of young people collaborating with lots of young to old professors, and the energy is infectious. Everybody is a CEO in R ’s world. Latest data mining algols will probably start in R, published in journals.

Which is better for data mining SAS or R? It depends on your data and your deadline. The golden rule of management and business is -it depends.

Also I have worked with a lot of KXEN, SQL, SPSS.

DMR: Can you tell us more about Decision Stats? You have a traffic of 120′000 for 2010. How did you reach such a success?

AO: I don’t think 120,000 is a success. Its not a failure. It just happened- the more I wrote, the more people read.In 2007-2008 I used to obsess over traffic. I tried SEO, comments, back linking, and I did some black hat experimental stuff. Some of it worked- some didn’t.

In the end, I started asking questions and interviewing people. To my surprise, senior management is almost always more candid , frank and honest about their views while middle managers, public relations, marketing folks can be defensive.

Social Media helped a bit- Twitter, Linkedin, Facebook really helped my network of friends who I suppose acted as informal ambassadors to spread the word.
Again I was constrained by necessity than choices- my middle class finances ( I also had a baby son in 2007-my current laptop still has some broken keys :) – by my inability to afford traveling to conferences, and my location Delhi isn’t really a tech hub.

The more questions I asked around the internet, the more people responded, and I wrote it all down.

I guess I just was lucky to meet a lot of nice people on the internet who took time to mentor and educate me.

I tried building other websites but didn’t succeed so i guess I really don’t know. I am not a smart coder, not very clever at writing but I do try to be honest.

Basic economics says pricing is proportional to demand and inversely proportional to supply. Honest and candid opinions have infinite demand and an uncertain supply.

DMR: There is a rumor about a R book you plan to publish in 2011 :-) Can you confirm the rumor and tell us more?

AO: I just signed a contract with Springer for ” R for Business Analytics”. R is a great software, and lots of books for statistically trained people, but I felt like writing a book for the MBAs and existing analytics users- on how to easily transition to R for Analytics.

Like any language there are tricks and tweaks in R, and with a focus on code editors, IDE, GUI, web interfaces, R’s famous learning curve can be bent a bit.

Making analytics beautiful, and simpler to use is always a passion for me. With 3000 packages, R can be used for a lot more things and a lot more simply than is commonly understood.
The target audience however is business analysts- or people working in corporate environments.

Brief Bio-
Ajay Ohri has been working in the field of analytics since 2004 , when it was a still nascent emerging Industries in India. He has worked with the top two Indian outsourcers listed on NYSE,and with Citigroup on cross sell analytics where he helped sell an extra 50000 credit cards by cross sell analytics .He was one of the very first independent data mining consultants in India working on analytics products and domestic Indian market analytics .He regularly writes on analytics topics on his web site www.decisionstats.com and is currently working on open source analytical tools like R besides analytical software like SPSS and SAS.