R Authors get more choice and variety now-
http://www.mail-archive.com/r-help@r-project.org/msg122965.html
We are pleased to announce the launch of a new series of books on R.

Chapman & Hall/CRC: The R Series

Aims and Scope
This book series reflects the recent rapid growth in the development and
application of R, the programming language and software environment for
statistical computing and graphics. R is now widely used in academic research,
education, and industry. It is constantly growing, with new versions of the
core software released regularly and more than 2,600 packages available. It is
difficult for the documentation to keep pace with the expansion of the
software, and this vital book series provides a forum for the publication of
books covering many aspects of the development and application of R.

The scope of the series is wide, covering three main threads:
• Applications of R to specific disciplines such as biology, epidemiology,
genetics, engineering, finance, and the social sciences.
• Using R for the study of topics of statistical methodology, such as linear
and mixed modeling, time series, Bayesian methods, and missing data.
• The development of R, including programming, building packages, and graphics.

The books will appeal to programmers and developers of R software, as well as
applied statisticians and data analysts in many fields. The books will feature
detailed worked examples and R code fully integrated into the text, ensuring
their usefulness to researchers, practitioners and students.

Series Editors
John M. Chambers (Department of Statistics, Stanford University, USA;
j...@stat.stanford.edu)
Torsten Hothorn (Institut für Statistik, Ludwig-Maximilians-Universität,
München, Germany; torsten.hoth...@stat.uni-muenchen.de)
Duncan Temple Lang (Department of Statistics, University of California, Davis,
USA; dun...@wald.ucdavis.edu)
Hadley Wickham (Department of Statistics, Rice University, Houston, Texas, USA;
had...@rice.edu)

Call for Proposals
We are interested in books covering all aspects of the development and
application of R software. If you have an idea for a book, please contact one
of the series editors above or one of the Chapman & Hall/CRC statistics
acquisitions editors below. Please provide brief details of topic, audience,
aims and scope, and include an outline if possible.

We look forward to hearing from you.

Best regards,Rob Calver (rob.cal...@informa.com)
David Grubbs (david.gru...@taylorandfrancis.com)
John Kimmel (john.kim...@taylorandfrancis.com)
This promotional offer enables you to try a limited amount of the Windows Azure platform at no charge. The subscription includes a base level of monthly compute hours, storage, data transfers, a SQL Azure database, Access Control transactions and Service Bus connections at no charge. Please note that any usage over this introductory base level will be charged at standard rates.
Included each month at no charge:
Windows Azure
25 hours of a small compute instance
500 MB of storage
10,000 storage transactions
SQL Azure
1GB Web Edition database (available for first 3 months only)
Windows Azure platform AppFabric
100,000 Access Control transactions
2 Service Bus connections
Data Transfers (per region)
500 MB in
500 MB out
Any monthly usage in excess of the above amounts will be charged at the standard rates. This introductory special will end on March 31, 2011 and all usage will then be charged at the standard rates.
As part of AWS’s Free Usage Tier, new AWS customers can get started with Amazon EC2 for free. Upon sign-up, new AWScustomers receive the following EC2 services each month for one year:
750 hours of EC2 running Linux/Unix Micro instance usage
750 hours of Elastic Load Balancing plus 15 GB data processing
10 GB of Amazon Elastic Block Storage (EBS) plus 1 million IOs, 1 GB snapshot storage, 10,000 snapshot Get Requests and 1,000 snapshot Put Requests
15 GB of bandwidth in and 15 GB of bandwidth out aggregated across all AWS services
Paid Instances-
Standard On-Demand Instances
Linux/UNIX Usage
Windows Usage
Small (Default)
$0.085 per hour
$0.12 per hour
Large
$0.34 per hour
$0.48 per hour
Extra Large
$0.68 per hour
$0.96 per hour
Micro On-Demand Instances
Micro
$0.02 per hour
$0.03 per hour
High-Memory On-Demand Instances
Extra Large
$0.50 per hour
$0.62 per hour
Double Extra Large
$1.00 per hour
$1.24 per hour
Quadruple Extra Large
$2.00 per hour
$2.48 per hour
High-CPU On-Demand Instances
Medium
$0.17 per hour
$0.29 per hour
Extra Large
$0.68 per hour
$1.16 per hour
Cluster Compute Instances
Quadruple Extra Large
$1.60 per hour
N/A*
Cluster GPU Instances
Quadruple Extra Large
$2.10 per hour
N/A*
* Windows is not currently available for Cluster Compute or Cluster GPU Instances.
NOTE- Amazon Instance definitions differ slightly from Azure definitions
Instances of this family are well suited for most applications.
Small Instance – default*
1.7 GB memory
1 EC2 Compute Unit (1 virtual core with 1 EC2 Compute Unit)
160 GB instance storage
32-bit platform
I/O Performance: Moderate
API name: m1.small
Large Instance
7.5 GB memory
4 EC2 Compute Units (2 virtual cores with 2 EC2 Compute Units each)
850 GB instance storage
64-bit platform
I/O Performance: High
API name: m1.large
Extra Large Instance
15 GB memory
8 EC2 Compute Units (4 virtual cores with 2 EC2 Compute Units each)
1,690 GB instance storage
64-bit platform
I/O Performance: High
API name: m1.xlarge
Micro Instances
Instances of this family provide a small amount of consistent CPU resources and allow you to burst CPU capacity when additional cycles are available. They are well suited for lower throughput applications and web sites that consume significant compute cycles periodically.
Micro Instance
613 MB memory
Up to 2 EC2 Compute Units (for short periodic bursts)
EBS storage only
32-bit or 64-bit platform
I/O Performance: Low
API name: t1.micro
High-Memory Instances
Instances of this family offer large memory sizes for high throughput applications, including database and memory caching applications.
High-Memory Extra Large Instance
17.1 GB of memory
6.5 EC2 Compute Units (2 virtual cores with 3.25 EC2 Compute Units each)
420 GB of instance storage
64-bit platform
I/O Performance: Moderate
API name: m2.xlarge
High-Memory Double Extra Large Instance
34.2 GB of memory
13 EC2 Compute Units (4 virtual cores with 3.25 EC2 Compute Units each)
850 GB of instance storage
64-bit platform
I/O Performance: High
API name: m2.2xlarge
High-Memory Quadruple Extra Large Instance
68.4 GB of memory
26 EC2 Compute Units (8 virtual cores with 3.25 EC2 Compute Units each)
1690 GB of instance storage
64-bit platform
I/O Performance: High
API name: m2.4xlarge
High-CPU Instances
Instances of this family have proportionally more CPU resources than memory (RAM) and are well suited for compute-intensive applications.
High-CPU Medium Instance
1.7 GB of memory
5 EC2 Compute Units (2 virtual cores with 2.5 EC2 Compute Units each)
350 GB of instance storage
32-bit platform
I/O Performance: Moderate
API name: c1.medium
High-CPU Extra Large Instance
7 GB of memory
20 EC2 Compute Units (8 virtual cores with 2.5 EC2 Compute Units each)
1690 GB of instance storage
64-bit platform
I/O Performance: High
API name: c1.xlarge
Cluster Compute Instances
Instances of this family provide proportionally high CPU resources with increased network performance and are well suited for High Performance Compute (HPC) applications and other demanding network-bound applications. Learn more about use of this instance type for HPC applications.
Cluster Compute Quadruple Extra Large Instance
23 GB of memory
33.5 EC2 Compute Units (2 x Intel Xeon X5570, quad-core “Nehalem” architecture)
1690 GB of instance storage
64-bit platform
I/O Performance: Very High (10 Gigabit Ethernet)
API name: cc1.4xlarge
Cluster GPU Instances
Instances of this family provide general-purpose graphics processing units (GPUs) with proportionally high CPU and increased network performance for applications benefitting from highly parallelized processing, including HPC, rendering and media processing applications. While Cluster Compute Instances provide the ability to create clusters of instances connected by a low latency, high throughput network, Cluster GPU Instances provide an additional option for applications that can benefit from the efficiency gains of the parallel computing power of GPUs over what can be achieved with traditional processors. Learn moreabout use of this instance type for HPC applications.
Cluster GPU Quadruple Extra Large Instance
22 GB of memory
33.5 EC2 Compute Units (2 x Intel Xeon X5570, quad-core “Nehalem” architecture)
2 x NVIDIA Tesla “Fermi” M2050 GPUs
1690 GB of instance storage
64-bit platform
I/O Performance: Very High (10 Gigabit Ethernet)
API name: cg1.4xlarge
versus-
Windows Azure compute instances come in five unique sizes to enable complex applications and workloads.
Compute Instance Size
CPU
Memory
Instance Storage
I/O Performance
Extra Small
1 GHz
768 MB
20 GB*
Low
Small
1.6 GHz
1.75 GB
225 GB
Moderate
Medium
2 x 1.6 GHz
3.5 GB
490 GB
High
Large
4 x 1.6 GHz
7 GB
1,000 GB
High
Extra large
8 x 1.6 GHz
14 GB
2,040 GB
High
*There is a limitation on the Virtual Hard Drive (VHD) size if you are deploying a Virtual Machine role on an extra small instance. The VHD can only be up to 15 GB.
One of the most frustrating things I had to do while working as financial business analysts was working with Data Time Formats in Base SAS. The syntax was simple enough and SAS was quite good with handing queries to the Oracle data base that the client was using, but remembering the different types of formats in SAS language was a challenge (there was a date9. and date6 and mmddyy etc )
Data and Time variables are particularly important variables in financial industry as almost everything is derived variable from the time (which varies) while other inputs are mostly constants. This includes interest as well as late fees and finance fees.
In R, date and time are handled quite simply-
Use the strptime( dataset, format) function to convert the character into string
For example if the variable dob is “01/04/1977) then following will convert into a date object
z=strptime(dob,”%d/%m/%Y”)
and if the same date is 01Apr1977
z=strptime(dob,"%d%b%Y")
does the same
For troubleshooting help with date and time, remember to enclose the formats
%d,%b,%m and % Y in the same exact order as the original string- and if there are any delimiters like ” -” or “/” then these delimiters are entered in exactly the same order in the format statement of the strptime
Sys.time() gives you the current date-time while the function difftime(time1,time2) gives you the time intervals( say if you have two columns as date-time variables)
What are the various formats for inputs in date time?
%a
Abbreviated weekday name in the current locale. (Also matches full name on input.)
%A
Full weekday name in the current locale. (Also matches abbreviated name on input.)
%b
Abbreviated month name in the current locale. (Also matches full name on input.)
%B
Full month name in the current locale. (Also matches abbreviated name on input.)
%c
Date and time. Locale-specific on output, "%a %b %e %H:%M:%S %Y" on input.
%d
Day of the month as decimal number (01–31).
%H
Hours as decimal number (00–23).
%I
Hours as decimal number (01–12).
%j
Day of year as decimal number (001–366).
%m
Month as decimal number (01–12).
%M
Minute as decimal number (00–59).
%p
AM/PM indicator in the locale. Used in conjunction with %I and not with %H. An empty string in some locales.
%S
Second as decimal number (00–61), allowing for up to two leap-seconds (but POSIX-compliant implementations will ignore leap seconds).
%U
Week of the year as decimal number (00–53) using Sunday as the first day 1 of the week (and typically with the first Sunday of the year as day 1 of week 1). The US convention.
%w
Weekday as decimal number (0–6, Sunday is 0).
%W
Week of the year as decimal number (00–53) using Monday as the first day of week (and typically with the first Monday of the year as day 1 of week 1). The UK convention.
%x
Date. Locale-specific on output, "%y/%m/%d" on input.
%X
Time. Locale-specific on output, "%H:%M:%S" on input.
%y
Year without century (00–99). Values 00 to 68 are prefixed by 20 and 69 to 99 by 19 – that is the behaviour specified by the 2004 POSIX standard, but it does also say ‘it is expected that in a future version the default century inferred from a 2-digit year will change’.
%Y
Year with century.
%z
Signed offset in hours and minutes from UTC, so -0800 is 8 hours behind UTC.
%Z
(output only.) Time zone as a character string (empty if not available).
Also to read the helpful documentation (especially for time zone level, and leap year seconds and differences)
Please use the following code to get a 15% discount on the 2 Day Conference Pass: AJAY11.
Predictive Analytics World announces new full-day workshops coming to San Francisco March 13-19, amounting to seven consecutive days of content.
These workshops deliver top-notch analytical and business expertise across the hottest topics.
Register now for one or more workshops, offered just before and after the full two-day Predictive Analytics World conference program (March 14-15). Early Bird registration ends on January 31st – take advantage of reduced pricing before then.
Make savings now with the early bird rate. Receive $200 off your registration rate for Predictive Analytics World – San Francisco (March 14-15), plus $100 off each workshop for which you register.
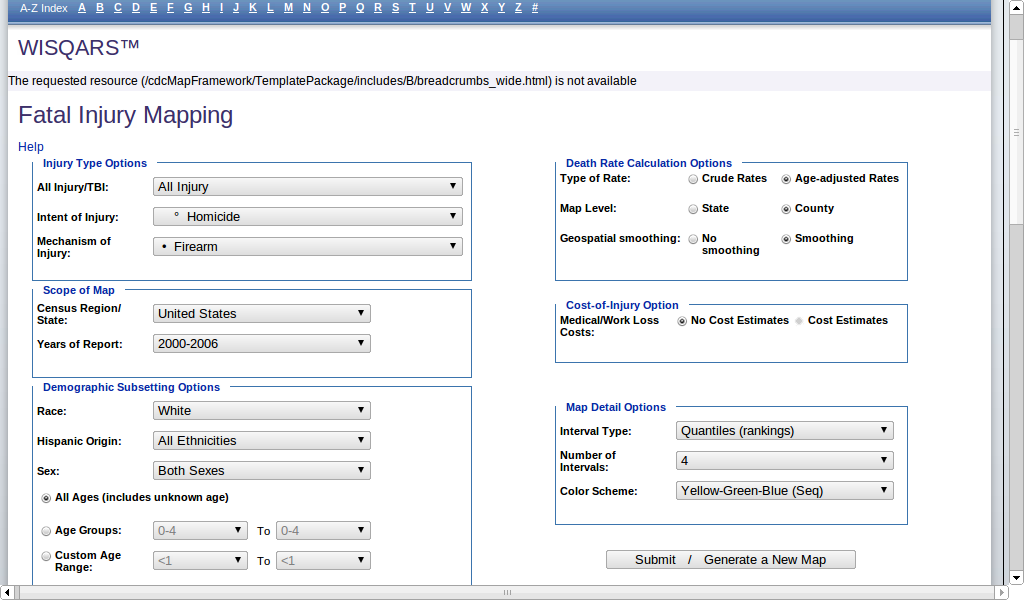
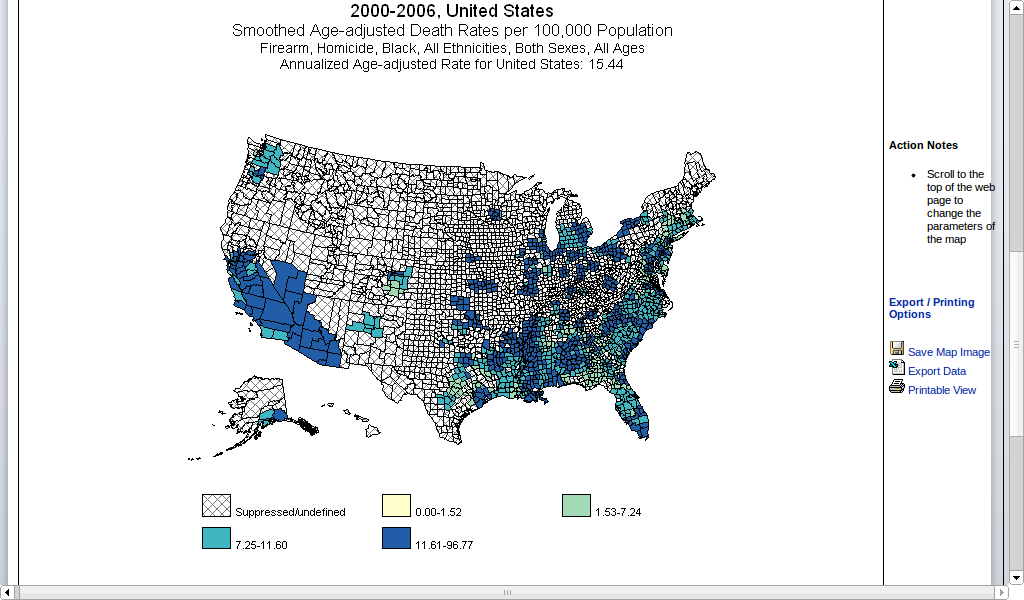
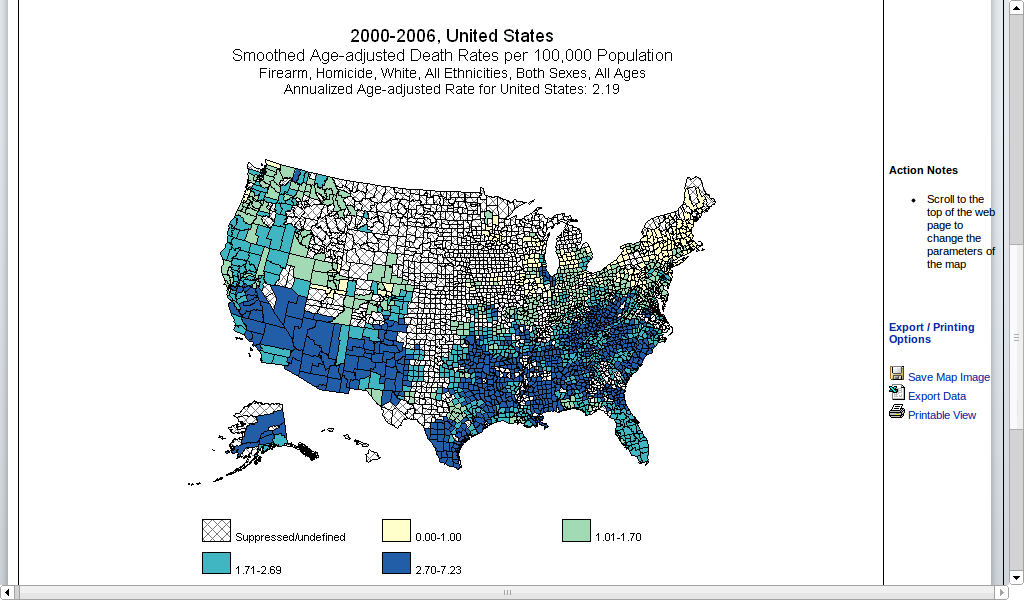
As a test I decided to map out injuries due to fire arms , and compare firearm deaths of white people versus the whole population.(see firearm deaths file)
See white people are more likely than black people to own guns (also read http://www.ncbi.nlm.nih.gov/pubmed/9572612 ), but it seems statistically they are less likely to be injured by firearms- so it could affect support for gun control laws on a racial ground- that was my null hypothesis. No politics, just plain statistics. I dont know- why dont you look at the data and decide-
Carole-Ann’s 2011 Predictions for Decision Management
For Ajay Ohri on DecisionStats.com
What were the top 5 events in 2010 in your field?
Maturity: the Decision Management space was made up of technology vendors, big and small, that typically focused on one or two aspects of this discipline. Over the past few years, we have seen a lot of consolidation in the industry – first with Business Intelligence (BI) then Business Process Management (BPM) and lately in Business Rules Management (BRM) and Advanced Analytics. As a result the giant Platform vendors have helped create visibility for this discipline. Lots of tiny clues finally bubbled up in 2010 to attest of the increasing activity around Decision Management. For example, more products than ever were named Decision Manager; companies advertised for Decision Managers as a job title in their job section; most people understand what I do when I am introduced in a social setting!
Boredom: unfortunately, as the industry matures, inevitably innovation slows down… At the main BRMS shows we heard here and there complaints that the technology was stalling. We heard it from vendors like Red Hat (Drools) and we heard it from bored end-users hoping for some excitement at Business Rules Forum’s vendor panel. They sadly did not get it
Scrum: I am not thinking about the methodology there! If you have ever seen a rugby game, you can probably understand why this is the term that comes to mind when I look at the messy & confusing technology landscape. Feet blindly try to kick the ball out while superhuman forces are moving randomly the whole pack – or so it felt when I played! Business Users in search of Business Solutions are facing more and more technology choices that feel like comparing apples to oranges. There is value in all of them and each one addresses a specific aspect of Decision Management but I regret that the industry did not simplify the picture in 2010. On the contrary! Many buzzwords were created or at least made popular last year, creating even more confusion on a muddy field. A few examples: Social CRM, Collaborative Decision Making, Adaptive Case Management, etc. Don’t take me wrong, I *do* like the technologies. I sympathize with the decision maker that is trying to pick the right solution though.
Information: Analytics have been used for years of course but the volume of data surrounding us has been growing to unparalleled levels. We can blame or thank (depending on our perspective) Social Media for that. Sites like Facebook and LinkedIn have made it possible and easy to publish relevant (as well as fluffy) information in real-time. As we all started to get the hang of it and potentially over-publish, technology evolved to enable the storage, correlation and analysis of humongous volumes of data that we could not dream of before. 25 billion tweets were posted in 2010. Every month, over 30 billion pieces of data are shared on Facebook alone. This is not just about vanity and marketing though. This data can be leveraged for the greater good. Carlos pointed to some fascinating facts about catastrophic event response team getting organized thanks to crowd-sourced information. We are also seeing, in the Decision management world, more and more applicability for those very technology that have been developed for the needs of Big Data – I’ll name for example Hadoop that Carlos (yet again) discussed in his talks at Rules Fest end of 2009 and 2010.
Self-Organization: it may be a side effect of the Social Media movement but I must admit that I was impressed by the success of self-organizing initiatives. Granted, this last trend has nothing to do with Decision Management per se but I think it is a great evolution worth noting. Let me point to a couple of examples. I usually attend traditional conferences and tradeshows in which the content can be good but is sometimes terrible. I was pleasantly surprised by the professionalism and attendance at *un-conferences* such as P-Camp (P stands for Product – an event for Product Managers). When you think about it, it is already difficult to get a show together when people are dedicated to the tasks. How crazy is it to have volunteers set one up with no budget and no agenda? Well, people simply show up to do their part and everyone has fun voting on-site for what seems the most appealing content at the time. Crowdsourcing applied to shows: it works! Similar experience with meetups or tweetups. I also enjoyed attending some impromptu Twitter jam sessions on a given topic. Social Media is certainly helping people reach out and get together in person or virtually and that is wonderful!
Image via Wikipedia
What are the top three trends you see in 2011?
Performance: I might be cheating here. I was very bullish about predicting much progress for 2010 in the area of Performance Management in your Decision Management initiatives. I believe that progress was made but Carlos did not give me full credit for the right prediction… Okay, I am a little optimistic on timeline… I admit it… If it did not fully happen in 2010, can I predict it again in 2011? I think that companies want to better track their business performance in order to correct the trajectory of course but also to improve their projections. I see that it is turning into reality already here and there. I expect it to become a trend in 2011!
Insight: Big Data being available all around us with new technologies and algorithms will continue to propagate in 2011 leading to more widely spread Analytics capabilities. The buzz at Analytics shows on Social Network Analysis (SNA) is a sign that there is interest in those kinds of things. There is tremendous information that can be leveraged for smart decision-making. I think there will be more of that in 2011 as initiatives launches in 2010 will mature into material results.
Image by Intersection Consulting via Flickr
Collaboration: Social Media for the Enterprise is a discipline in the making. Social Media was initially seen for the most part as a Marketing channel. Over the years, companies have started experimenting with external communities and ideation capabilities with moderate success. The few strategic initiatives started in 2010 by “old fashion” companies seem to be an indication that we are past the early adopters. This discipline may very well materialize in 2011 as a core capability, well, or at least a new trend. I believe that capabilities such Chatter, offered by Salesforce, will transform (slowly) how people interact in the workplace and leverage the volumes of social data captured in LinkedIn and other Social Media sites. Collaboration is of course a topic of interest for me personally. I even signed up for Kare Anderson’s collaboration collaboration site – yes, twice the word “collaboration”: it is really about collaborating on collaboration techniques. Even though collaboration does not require Social Media, this medium offers perspectives not available until now.
Brief Bio-
Carole-Ann is a renowned guru in the Decision Management space. She created the vision for Decision Management that is widely adopted now in the industry. Her claim to fame is the strategy and direction of Blaze Advisor, the then-leading BRMS product, while she also managed all the Decision Management tools at FICO (business rules, predictive analytics and optimization). She has a vision for Decision Management both as a technology and a discipline that can revolutionize the way corporations do business, and will never get tired of painting that vision for her audience. She speaks often at Industry conferences and has conducted university classes in France and Washington DC.
Leveraging her Masters degree in Applied Mathematics / Computer Science from a “Grande Ecole” in France, she started her career building advanced systems using all kinds of technologies — expert systems, rules, optimization, dashboarding and cubes, web search, and beta version of database replication – as well as conducting strategic consulting gigs around change management.
She started her career building advanced systems using all kinds of technologies — expert systems, rules, optimization, dashboarding and cubes, web search, and beta version of database replication. At Cleversys (acquired by Kurt Salmon & Associates), she also conducted strategic consulting gigs mostly around change management.
While playing with advanced software components, she found a passion for technology and joined ILOG (acquired by IBM). She developed a growing interest in Optimization as well as Business Rules. At ILOG, she coined the term BRMS while brainstorming with her Sales counterpart. She led the Presales organization for Telecom in the Americas up until 2000 when she joined Blaze Software (acquired by Brokat Technologies, HNC Software and finally FICO).
Her 360-degree experience allowed her to gain appreciation for all aspects of a software company, giving her a unique perspective on the business. Her technical background kept her very much in touch with technology as she advanced.
She also became addicted to Twitter in the process. She is active on all kinds of social media, always looking for new digital experience!
Outside of work, Carole-Ann loves spending time with her two boys. They grow fruits in their Northern California home and cook all together in the French tradition.
Some common analytical tasks from the diary of the glamorous life of a business analyst-
1) removing duplicates from a dataset based on certain key values/variables
2) merging two datasets based on a common key/variable/s
3) creating a subset based on a conditional value of a variable
4) creating a subset based on a conditional value of a time-date variable
5) changing format from one date time variable to another
6) doing a means grouped or classified at a level of aggregation
7) creating a new variable based on if then condition
8) creating a macro to run same program with different parameters
9) creating a logistic regression model, scoring dataset,
10) transforming variables
11) checking roc curves of model
12) splitting a dataset for a random sample (repeatable with random seed)
13) creating a cross tab of all variables in a dataset with one response variable
14) creating bins or ranks from a certain variable value
15) graphically examine cross tabs
16) histograms
17) plot(density())
18)creating a pie chart
19) creating a line graph, creating a bar graph
20) creating a bubbles chart
21) running a goal seek kind of simulation/optimization
22) creating a tabular report for multiple metrics grouped for one time/variable
23) creating a basic time series forecast
and some case studies I could think of-
As the Director, Analytics you have to examine current marketing efficiency as well as help optimize sales force efficiency across various channels. In addition you have to examine multiple sales channels including inbound telephone, outgoing direct mail, internet email campaigns. The datawarehouse is an RDBMS but it has multiple data quality issues to be checked for. In addition you need to submit your budget estimates for next year’s annual marketing budget to maximize sales return on investment.
As the Director, Risk you have to examine the overdue mortgages book that your predecessor left you. You need to optimize collections and minimize fraud and write-offs, and your efforts would be measured in maximizing profits from your department.
As a social media consultant you have been asked to maximize social media analytics and social media exposure to your client. You need to create a mechanism to report particular brand keywords, as well as automated triggers between unusual web activity, and statistical analysis of the website analytics metrics. Above all it needs to be set up in an automated reporting dashboard .
As a consultant to a telecommunication company you are asked to monitor churn and review the existing churn models. Also you need to maximize advertising spend on various channels. The problem is there are a large number of promotions always going on, some of the data is either incorrectly coded or there are interaction effects between the various promotions.
As a modeller you need to do the following-
1) Check ROC and H-L curves for existing model
2) Divide dataset in random splits of 40:60
3) Create multiple aggregated variables from the basic variables
4) run regression again and again
5) evaluate statistical robustness and fit of model
6) display results graphically
All these steps can be broken down in little little pieces of code- something which i am putting down a list of.
Are there any common data analysis tasks that you think I am missing out- any common case studies ? let me know.












 Follow me on Twitter


