Input Data in R using the top 3 R GUI

PC-DOS was an early OS for personal computers ...
Image via Wikipedia

One area where clearly GUI methods are preferable to command line methods in R, is data input. There is no need of learning read.csv or read.table when these options are only two clicks away in any R GUI. For academics/students there is a definite need to easily access

datasets from attached packages just as it is a need for business analysts to access databases with a few clicks than learn or read pages of pdf on RODBC. However some GUI (like Rattle) need data only in data frames, rather than list or arrays-this limits R’s flexibility. These are my views but you can see and compare views of data input in R Commander, Rattle and Deducer.


Pentaho and R: working together

open_source_communism
Image by jagelado via Flickr

I interview Pentaho Co-founder here at https://decisionstats.com/2010/11/14/pentaho/

and recently became aware of the R Pentaho integration.

“R” is a popular open source statistical and analytical language that academics and commercial organizations alike have used for years to get maximum insight out of information using advanced analytic techniques. In this twelve-minute video, David Reinke from Pentaho Certified Partner OpenBI provides an overview of R, as well as a demonstration of integration between R and Pentaho.

http://www.pentaho.com/products/demos/r_project_with_pentaho/

or http://www.pentaho.com/products/demos/showNtell.php

Related-

M.S. in Applied Statistics

http://www.information-management.com/blogs/analytics_business_intelligence_BI_statistics-10019474-1.html

R and BI – Integrating R with Open Source BusinessIntelligence Platforms Pentaho and Jaspersoft

http://www.r-project.org/conferences/useR-2010/abstracts/Reinke+Miller.pdf

Web development with R

http://www.r-project.org/conferences/useR-2010/slides/Ooms.pdf

In-database analytics with R

http://www.r-project.org/conferences/useR-2010/slides/Hess+Chambers_1.pdf

R role in Business Intelligence Software Architecture

http://www.r-project.org/conferences/useR-2010/slides/Colombo+Ronzoni+Fontana.pdf

Interview David Katz ,Dataspora /David Katz Consulting

Here is an interview with David Katz ,founder of David Katz Consulting (http://www.davidkatzconsulting.com/) and an analyst at the noted firm http://dataspora.com/. He is a featured speaker at Predictive Analytics World  http://www.predictiveanalyticsworld.com/sanfrancisco/2011/speakers.php#katz)

Ajay-  Describe your background working with analytics . How can we make analytics and science more attractive career options for young students

David- I had an interest in math from an early age, spurred by reading lots of science fiction with mathematicians and scientists in leading roles. I was fortunate to be at Harry and David (Fruit of the Month Club) when they were in the forefront of applying multivariate statistics to the challenge of targeting catalogs and other snail-mail offerings. Later I had the opportunity to expand these techniques to the retail sphere with Williams-Sonoma, who grew their retail business with the support of their catalog mailings. Since they had several catalog titles and product lines, cross-selling presented additional analytic challenges, and with the growth of the internet there was still another channel to consider, with its own dynamics.

After helping to found Abacus Direct Marketing, I became an independent consultant, which provided a lot of variety in applying statistics and data mining in a variety of settings from health care to telecom to credit marketing and education.

Students should be exposed to the many roles that analytics plays in modern life, and to the excitement of finding meaningful and useful patterns in the vast profusion of data that is now available.

Ajay-  Describe your most challenging project in 3 decades of experience in this field.

David- Hard to choose just one, but the educational field has been particularly interesting. Partnering with Olympic Behavior Labs, we’ve developed systems to help identify students who are most at-risk for dropping out of school to help target interventions that could prevent dropout and promote success.

Ajay- What do you think are the top 5 trends in analytics for 2011.

David- Big Data, Privacy concerns, quick response to consumer needs, integration of testing and analysis into business processes, social networking data.

Ajay- Do you think techniques like RFM and LTV are adequately utilized by organization. How can they be propagated further.

David- Organizations vary amazingly in how sophisticated or unsophisticated the are in analytics. A key factor in success as a consultant is to understand where each client is on this continuum and how well that serves their needs.

Ajay- What are the various software you have worked for in this field- and name your favorite per category.

David- I started out using COBOL (that dates me!) then concentrated on SAS for many years. More recently R is my favorite because of its coverage, currency and programming model, and it’s debugging capabilities.

Ajay- Independent consulting can be a strenuous job. What do you do to unwind?

David- Cycling, yoga, meditation, hiking and guitar.

Biography-

David Katz, Senior Analyst, Dataspora, and President, David Katz Consulting.

David Katz has been in the forefront of applying statistical models and database technology to marketing problems since 1980. He holds a Master’s Degree in Mathematics from the University of California, Berkeley. He is one of the founders of Abacus Direct Marketing and was previously the Director of Database Development for Williams-Sonoma.

He is the founder and President of David Katz Consulting, specializing in sophisticated statistical services for a variety of applications, with a special focus on the Direct Marketing Industry. David Katz has an extensive background that includes experience in all aspects of direct marketing from data mining, to strategy, to test design and implementation. In addition, he consults on a variety of data mining and statistical applications from public health to collections analysis. He has partnered with consulting firms such as Ernst and Young, Prediction Impact, and most recently on this project with Dataspora.

For more on David’s Session in Predictive Analytics World, San Fransisco on (http://www.predictiveanalyticsworld.com/sanfrancisco/2011/agenda.php#day2-16a)

Room: Salon 5 & 6
4:45pm – 5:05pm

Track 2: Social Data and Telecom 
Case Study: Major North American Telecom
Social Networking Data for Churn Analysis

A North American Telecom found that it had a window into social contacts – who has been calling whom on its network. This data proved to be predictive of churn. Using SQL, and GAM in R, we explored how to use this data to improve the identification of likely churners. We will present many dimensions of the lessons learned on this engagement.

Speaker: David Katz, Senior Analyst, Dataspora, and President, David Katz Consulting

Exhibit Hours
Monday, March 14th:10:00am to 7:30pm

Tuesday, March 15th:9:45am to 4:30pm

Linux Counter- Use Linux so be counted

Here’s a nice website at

http://counter.li.org/

You can basically spend 2 minutes and register yourself publicly/anonymously/or your machine

and some fun at http://counter.li.org/estimates.php

SAS Knowledge Exchange

Visual analytics : research and practice
Image via Wikipedia

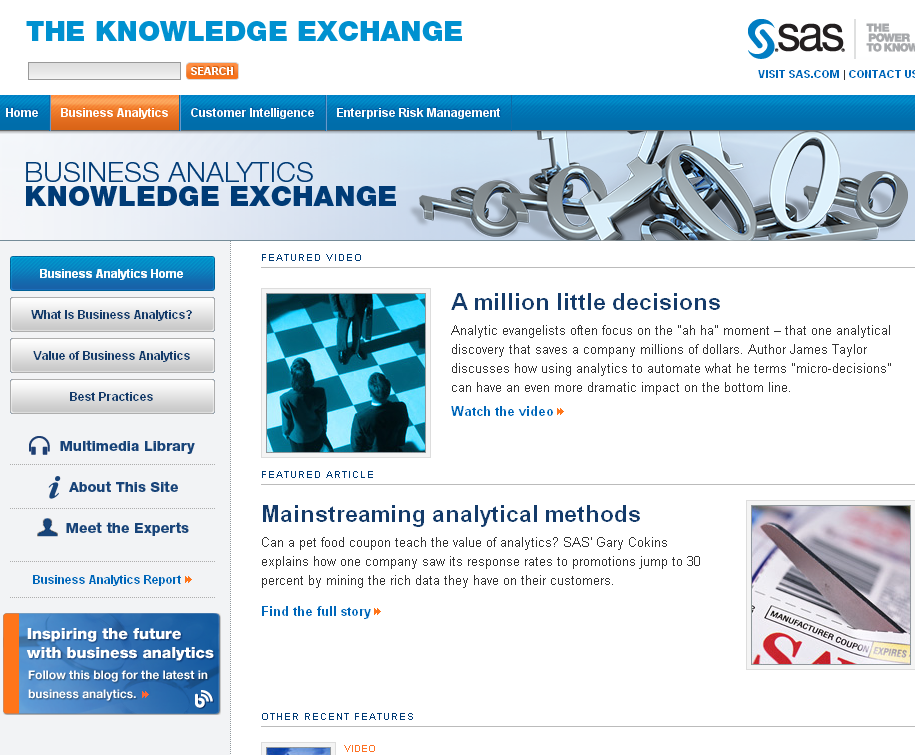
Here is an interesting website by SAS.com – it showcases lots of business analytics content more from a conceptual rather than a tool based perspective- have a glance yourself.

http://www.sas.com/knowledge-exchange/business-analytics/

Copyright © SAS Institute Inc. All rights reserved

GrapheR

GNU General Public License
Image via Wikipedia

GrapherR

GrapheR is a Graphical User Interface created for simple graphs.

Depends: R (>= 2.10.0), tcltk, mgcv
Description: GrapheR is a multiplatform user interface for drawing highly customizable graphs in R. It aims to be a valuable help to quickly draw publishable graphs without any knowledge of R commands. Six kinds of graphs are available: histogram, box-and-whisker plot, bar plot, pie chart, curve and scatter plot.
License: GPL-2
LazyLoad: yes
Packaged: 2011-01-24 17:47:17 UTC; Maxime
Repository: CRAN
Date/Publication: 2011-01-24 18:41:47

More information about GrapheR at CRAN
Path: /cran/newpermanent link

Advantages of using GrapheR

  • It is bi-lingual (English and French) and can import in text and csv files
  • The intention is for even non users of R, to make the simple types of Graphs.
  • The user interface is quite cleanly designed. It is thus aimed as a data visualization GUI, but for a more basic level than Deducer.
  • Easy to rename axis ,graph titles as well use sliders for changing line thickness and color

Disadvantages of using GrapheR

  • Lack of documentation or help. Especially tips on mouseover of some options should be done.
  • Some of the terms like absicca or ordinate axis may not be easily understood by a business user.
  • Default values of color are quite plain (black font on white background).
  • Can flood terminal with lots of repetitive warnings (although use of warnings() function limits it to top 50)
  • Some of axis names can be auto suggested based on which variable s being chosen for that axis.
  • Package name GrapheR refers to a graphical calculator in Mac OS – this can hinder search engine results

Using GrapheR

  • Data Input -Data Input can be customized for CSV and Text files.
  • GrapheR gives information on loaded variables (numeric versus Factors)
  • It asks you to choose the type of Graph 
  • It then asks for usual Graph Inputs (see below). Note colors can be customized (partial window). Also number of graphs per Window can be easily customized 
  • Graph is ready for publication


Data Visualization: Central Banks

Iron Ore Company of Canada
Image via Wikipedia

Trying to compare the transparency of central banks via the data visualization of two very different central banks.

One is Reserve Bank of India and the other is Federal Reserve Bank of New York

Here are some points-

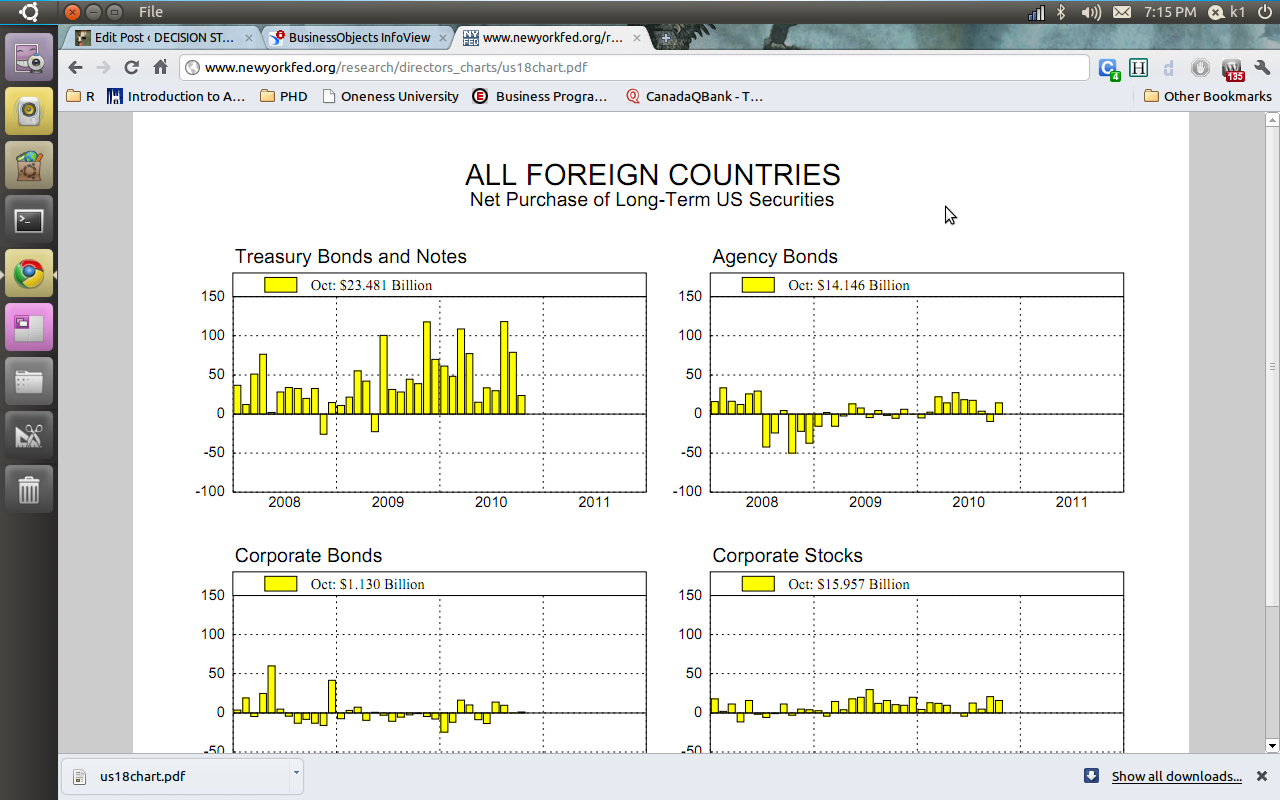
1) The federal bank gives you a huge clutter of charts to choose from and sometimes gives you very difficult to understand charts.

see http://www.newyorkfed.org/research/global_economy/usecon_charts.html

and http://www.newyorkfed.org/research/directors_charts/us18chart.pdf

us18chart

2) The Reserve bank of India choose Business Objects and gives you a proper drilldown kind  of  graph and tables. ( thats a lot of heavy metal and iron ore China needs from India 😉 😉

Foreign Trade – Export      Time-line: ALL

TIME LINE COUNTRY COMMODITY AMOUNT (US $ MILLION) EXPORT QUANTITY
2010:07 (JUL) – P China IRON ORE (Units: TON) 205.06 1878456
2010:06 (JUN) – P China IRON ORE (Units: TON) 427.68 6808528
2010:05 (MAY) – P China IRON ORE (Units: TON) 550.67 5290450
2010:04 (APR) – P China IRON ORE (Units: TON) 922.46 9931500
2010:03 (MAR) – P China IRON ORE (Units: TON) 829.75 13177672
2010:02 (FEB) – P China IRON ORE (Units: TON) 706.04 10141259
2010:01 (JAN) – P China IRON ORE (Units: TON) 577.13 8498784
2009:12 (DEC) – P China IRON ORE (Units: TON) 545.68 9264544
2009:11 (NOV) – P China IRON ORE (Units: TON) 508.17 9509213
2009:10 (OCT) – P China IRON ORE (Units: TON) 422.6 7691652
2009:09 (SEP) – P China IRON ORE (Units: TON) 278.04 4577943
2009:08 (AUG) – P China IRON ORE (Units: TON) 276.96 4371847
2009:07 (JUL) China IRON ORE (Units: TON) 266.11 4642237
2009:06 (JUN) China IRON ORE (Units: TON) 241.08 4584354

Source : DGCI & S, Ministry of Commerce & Industry, GoI


You can see the screenshots of the various visualization tools of the New York Fed Reserve Bank and Indian Reserve Bank- if the US Fed is serious about cutting the debt maybe it should start publishing better visuals