Quantum GIS (QGIS) is a user friendly Open Source Geographic Information System (GIS) licensed under the GNU General Public License. QGIS is an official project of the Open Source Geospatial Foundation (OSGeo). It runs on Linux, Unix, MacOSX, and Windows and supportsnumerous vector, raster, and database formats and functionalities.
Learn more about QGIS
Quantum GIS provides a continously growing number of capabilities provided by core functions and plugins. You can visualize, manage, edit, analyse data, and compose printable maps
Also you can use both Qgis and R through Python (!!!)
The web browser UI works in all modern browsers, including IE 7 and 8 (excluding SVG based graphs).
Username/password login (both from the browser to the R-Node server, and from the R-Node server to Rserve and R).
Per-user R sessions. Each user can have their own R workspace, or they can share.
Support for most R commands that perform statistical analysis and provide textual feedback.
Support for most standard R commands that provide graphical feedback via server side generation of the graphs. Some graphs (e.g. plot() can be plotted via SVG client-side as well).
Downloading of generated graphs.
Accessing R help files using help() and ? commands (Note R v2.10 altered how help is provided, so this currently is not working in R v2.10)
Uploading files to work with their data in R.
Many commands will work. Try a command, if it does not work, use the feedback button in the application to let us know.
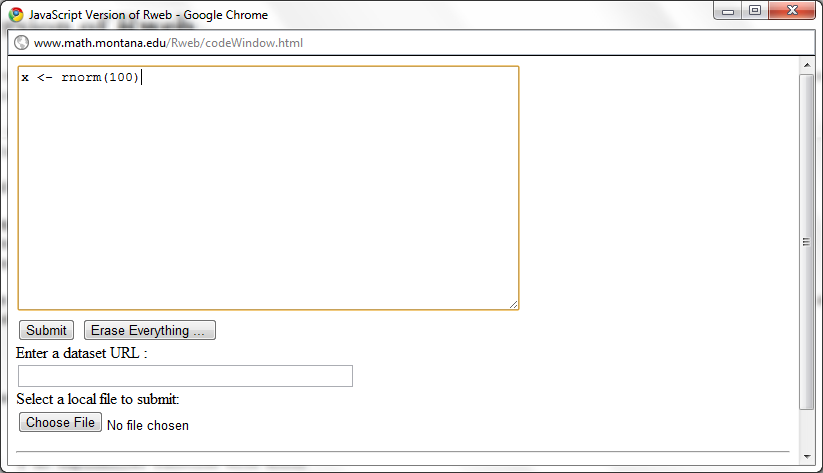
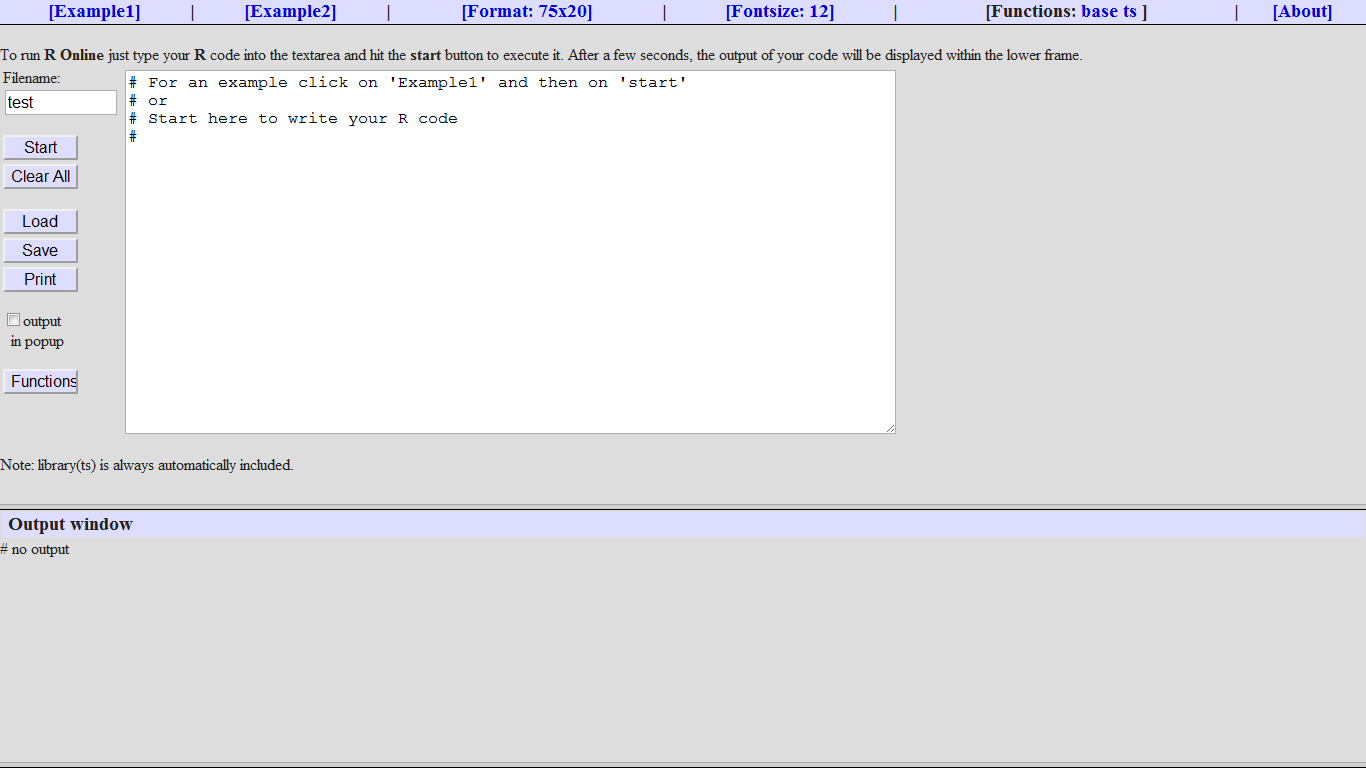
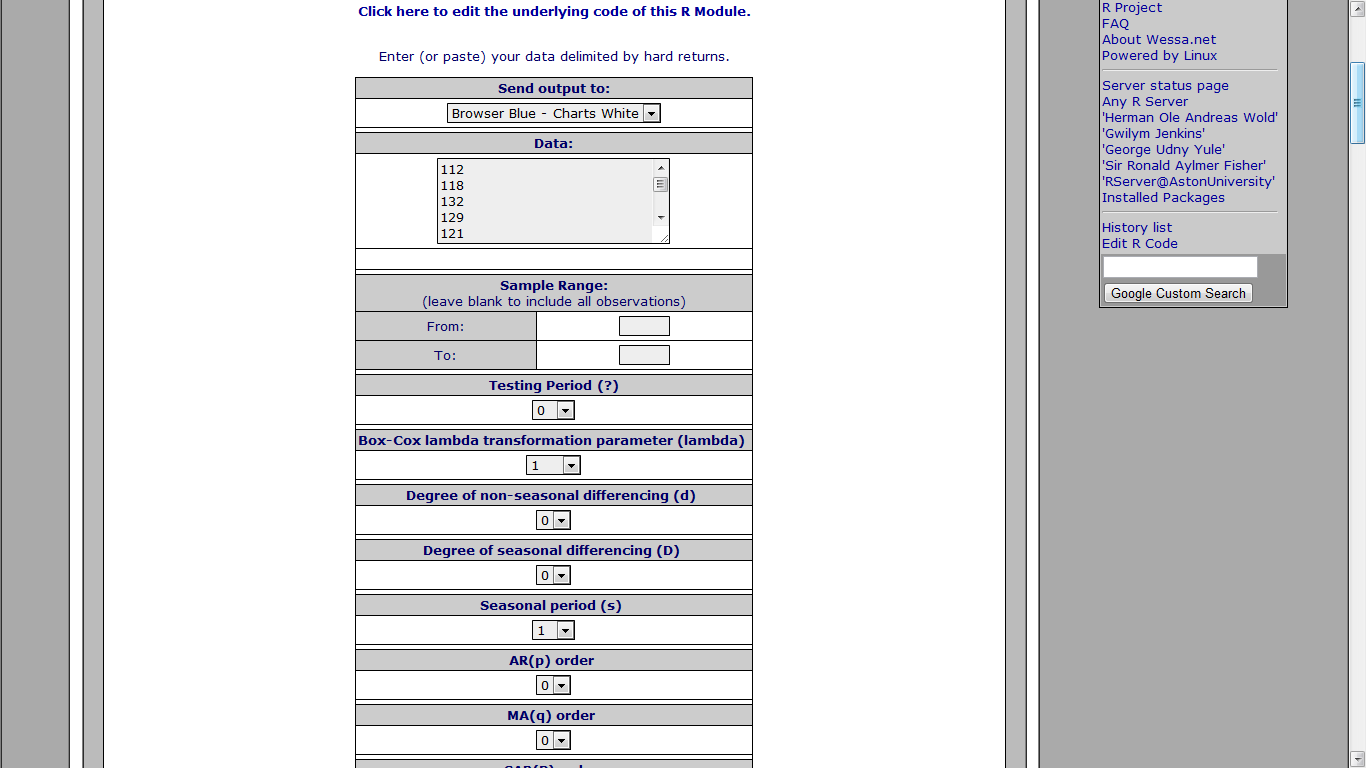
An impressive implementation of time series analysis based on R and Javascript. This web server creates separate browser windows for data entry, graphics, and procedure selection. These windows are dynamic. For example, after entering data there is no submit button to submit the data. The procedure selection window is used to start the analysis, which uses the current values in the data window.
Protovis composes custom views of data with simple marks such as bars and dots. Unlike low-level graphics libraries that quickly become tedious for visualization, Protovis defines marks through dynamic properties that encode data, allowing inheritance, scales and layouts to simplify construction.
Protovis is free and open-source and is a Stanford project. It has been used in web interface R Node (which I will talk later )
While Protovis is designed for custom visualization, it is still easy to create many standard chart types. These simpler examples serve as an introduction to the language, demonstrating key abstractions such as quantitative and ordinal scales, while hinting at more advanced features, including stack layout.
Many charting libraries provide stock chart designs, but offer only limited customization; Protovis excels at custom visualization design through a concise representation and precise control over graphical marks. These examples, including a few recreations of unusual historical designs, demonstrate the language’s expressiveness.
It uses JavaScript and SVG for web-native visualizations; no plugin required (though you will need a modern web browser)! Although programming experience is helpful, Protovis is mostly declarative and designed to be learned by example.
The Document Foundation is happy to announce the release candidate of
LibreOffice 3.3.1. This release candidate is the first in a series of
frequent bugfix releases on top of our LibreOffice 3.3 product. Please
be aware that LibreOffice 3.3.1 RC1 is not yet ready for production
use, you should continue to use LibreOffice for that.
Writer is the word processor inside LibreOffice. Use it for everything, from dashing off a quick letter to producing an entire book with tables of contents, embedded illustrations, bibliographies and diagrams. The while-you-type auto-completion, auto-formatting and automatic spelling checking make difficult tasks easy (but are easy to disable if you prefer). Writer is powerful enough to tackle desktop publishing tasks such as creating multi-column newsletters and brochures. The only limit is your imagination.
Calc tames your numbers and helps with difficult decisions when you’re weighing the alternatives. Analyze your data with Calc and then use it to present your final output. Charts and analysis tools help bring transparency to your conclusions. A fully-integrated help system makes easier work of entering complex formulas. Add data from external databases such as SQL or Oracle, then sort and filter them to produce statistical analyses. Use the graphing functions to display large number of 2D and 3D graphics from 13 categories, including line, area, bar, pie, X-Y, and net – with the dozens of variations available, you’re sure to find one that suits your project.
Impress is the fastest and easiest way to create effective multimedia presentations. Stunning animation and sensational special effects help you convince your audience. Create presentations that look even more professional than the standard presentations you commonly see at work. Get your collegues’ and bosses’ attention by creating something a little bit different.
Draw lets you build diagrams and sketches from scratch. A picture is worth a thousand words, so why not try something simple with box and line diagrams? Or else go further and easily build dynamic 3D illustrations and special effects. It’s as simple or as powerful as you want it to be.
Base is the database front-end of the LibreOffice suite. With Base, you can seamlessly integrate your existing database structures into the other components of LibreOffice, or create an interface to use and administer your data as a stand-alone application. You can use imported and linked tables and queries from MySQL, PostgreSQL or Microsoft Access and many other data sources, or design your own with Base, to build powerful front-ends with sophisticated forms, reports and views. Support is built-in or easily addable for a very wide range of database products, notably the standardly-provided HSQL, MySQL, Adabas D, Microsoft Access and PostgreSQL.
Math is a simple equation editor that lets you lay-out and display your mathematical, chemical, electrical or scientific equations quickly in standard written notation. Even the most-complex calculations can be understandable when displayed correctly. E=mc2.
LibreOffice also comes configured with a PDF file creator, meaning you can distribute documents that you’re sure can be opened and read by users of almost any computing device or operating system.
(to be continued- as I find more stuff I will keep it there, some ideas- database access from R, prominent R consultants, prominent R packages, famous R interviewees 😉 )
ps- The quote from Jerry Rubin seems funny for a while. I turn 34 this year.



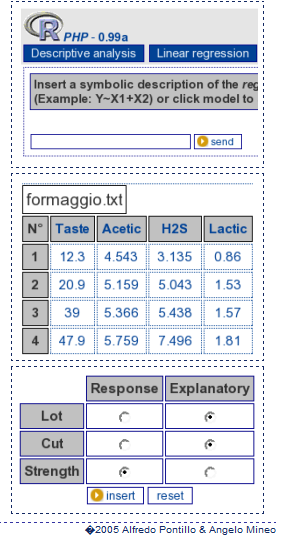



 Area Charts
 Bar & Column Charts
 Scatterplots
 Pie & Donut Charts
 Line & Step Charts
 Stacked Charts
 Grouped Charts
 Anderson’s Flowers
 Becker’s Barley
 Bertin’s Hotel
 Streamgraphs
 Sparklines
 Bullet Charts
 Bubble Charts
 Sizing the Horizon
 Candlestick Charts
 Burtin’s Antibiotics
 Nightingale’s Rose
 Playfair’s Wheat
 Gas & Driving
 Seattle Weather
 Marey’s Trains
 Stemplots
 Merge Sort


 What does LibreOffice give you?