Linux= Who did what and how much?

A report distributed under Creative Commons 3 and available at

That shows Canonical — the commercial arm of Ubuntu — has contributed only about one percent of the code to the GNOME desktop for Linux. while Red Hat accounts for 17 percent of the code and Novell developers are responsible for about 11 percent. That prompted some heartburn from Mark, creator- founder Cannonical/ Ubuntu at http://www.markshuttleworth.com/archives/517

And it would be a very different story if it weren’t for the Mozilla folks and Netscape before them, and GNOME and KDE, and Google and everyone else who have exercised that stack in so many different ways, making it better along the way. There are tens of thousands of people who are not in any way shape or form associated with Ubuntu, who make this story real. Many of them have been working at it for more than a decade – it takes a long time to make an overnight success :) while Ubuntu has only been on the scene six years. So Ubuntu cannot be credited solely for the delight of its users.

Nevertheless, the Ubuntu Project does bring something unique, special and important to free software: a total commitment to everyday users and use cases, the idea that free software should be “for everyone” both economically and in ease of use, and a willingness to chase down the problems that stand between here and there. I feel that commitment is a gift back to the people who built every one of those packages. If we can bring free software to ten times the audience, we have amplified the value of your generosity by a factor of ten, we have made every hour spent fixing an issue or making something amazing, ten times as valuable. I’m very proud to be spending the time and energy on Ubuntu that I do. Yes, I could do many other things, but I can’t think of another course which would have the same impact on the world.

I recognize that not everybody will feel the same way. Bringing their work to ten times the audience without contributing features might just feel like leeching, or increasing the flow of bug reports 10x. I suppose you could say that no matter how generous we are to downstream users, if upstream is only measuring code, then any generosity other than code won’t be registered. I don’t really know what to do about that – I didn’t found Ubuntu as a vehicle for getting lots of code written, that didn’t seem to me to be what the world needed.

Open source communities work like democracies with all noise whereas R and D within corporates have a stricter hierarchy. Still for all that – Ubuntu and Android have made Linux mainstream just as R has made statistical software available to all.

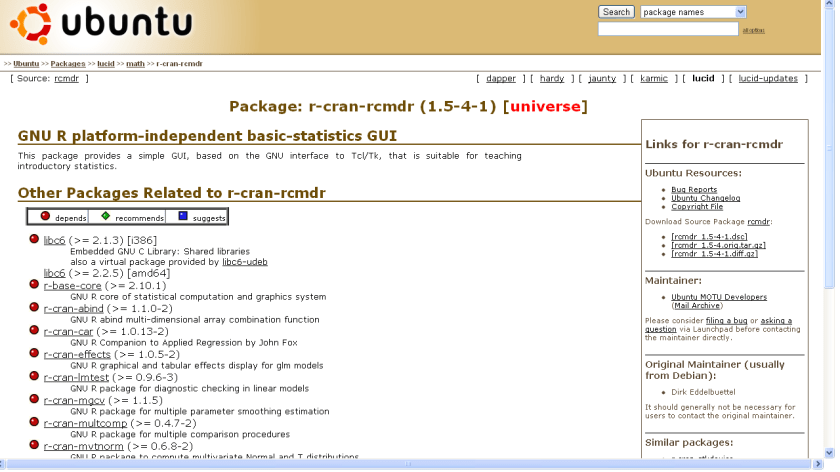
And Ubuntu also has great support for R (particularly the single click R Commander Install and Icon) available at http://packages.ubuntu.com/lucid/math/r-cran-rcmdr

John M. Chambers Statistical Software Award – 2011

Write code, win cash, and the glory. Deep bow to Father John M Chambers, inventor of S ,for endowing this award for statistical software creation by grads and undergrads.

An effort to be matched by companies like SAS, SPSS which after all came from grad school work. Now back to the competition, I gotta get my homies from U Tenn in a team ( I was a grad student last year though taking this year off due to medico- financial reasons)

John M. Chambers Statistical Software Award – 2011
Statistical Computing Section
American Statistical Association

The Statistical Computing Section of the American Statistical
Association announces the competition for the John M.  Chambers
Statistical Software Award. In 1998 the Association for Computing
Machinery presented its Software System Award to John Chambers for the
design and development of S. Dr. Chambers generously donated his award
to the Statistical Computing Section to endow an annual prize for
statistical software written by an undergraduate or graduate student.
The prize carries with it a cash award of $1000, plus a substantial
allowance for travel to the annual Joint Statistical Meetings where
the award will be presented.

Teams of up to 3 people can participate in the competition, with the
cash award being split among team members. The travel allowance will
be given to just one individual in the team, who will be presented the
award at JSM.  To be eligible, the team must have designed and
implemented a piece of statistical software.
The individual within
the team indicated to receive the travel allowance must have begun the
development while a student, and must either currently be a student,
or have completed all requirements for her/his last degree after
January 1, 2009.  To apply for the award, teams must provide the
following materials:

Current CV’s of all team members.

A letter from a faculty mentor at the academic institution of the
individual indicated to receive the travel award.  The letter
should confirm that the individual had substantial participation in
the development of the software, certify her/his student status
when the software began to be developed (and either the current
student status or the date of degree completion), and briefly
discuss the importance of the software to statistical practice.

A brief, one to two page description of the software, summarizing
what it does, how it does it, and why it is an important
contribution.  If the team member competing for the travel
allowance has continued developing the software after finishing
her/his studies, the description should indicate what was developed
when the individual was a student and what has been added since.

An installable software package with its source code for use by the
award committee. It should be accompanied by enough information to allow
the judges to effectively use and evaluate the software (including
its design considerations.)  This information can be provided in a
variety of ways, including but not limited to a user manual (paper
or electronic), a paper, a URL, and online help to the system.

All materials must be in English.  We prefer that electronic text be
submitted in Postscript or PDF.  The entries will be judged on a
variety of dimensions, including the importance and relevance for
statistical practice of the tasks performed by the software, ease of
use, clarity of description, elegance and availability for use by the
statistical community. Preference will be given to those entries that
are grounded in software design rather than calculation.  The decision
of the award committee is final.

All application materials must be received by 5:00pm EST, Monday,
February 21, 2011 at the address below.  The winner will be announced
in May and the award will be given at the 2011 Joint Statistical
Meetings.

Information on the competition can also be accessed on the website of
the Statistical Computing Section (www.statcomputing.org or see the
ASA website, www.amstat.org for a pointer), including the names and
contributions of previous winners.  Inquiries and application
materials should be emailed or mailed to:

Chambers Software Award
c/o Fei Chen
Avaya Labs
233 Mt Airy Rd.
Basking Ridge, NJ 07920
feic@avaya.com

Trrrouble in land of R…and Open Source Suggestions

Recently some comments by Ross Ihake , founder of R Statistical Software on Revolution Analytics, leading commercial vendor of R….. came to my attention-

http://www.stat.auckland.ac.nz/mail/archive/r-downunder/2010-May/000529.html

[R-downunder] Article on Revolution Analytics

Ross Ihaka ihaka at stat.auckland.ac.nz
Mon May 10 14:27:42 NZST 2010


On 09/05/10 09:52, Murray Jorgensen wrote:
> Perhaps of interest:
>
> http://www.theregister.co.uk/2010/05/06/revolution_commercial_r/

Please note that R is "free software" not "open source".  These guys
are selling a GPLed work without disclosing the source to their part
of the work. I have complained to them and so far they have given me
the brush off. I am now considering my options.

Don't support these guys by buying their product. The are not feeding
back to the rights holders (the University of Auckland and I are rights
holders and they didn't even have the courtesy to contact us).

--
Ross Ihaka                         Email:  ihaka at stat.auckland.ac.nz
Department of Statistics           Phone:  (64-9) 373-7599 x 85054
University of Auckland             Fax:    (64-9) 373-7018
Private Bag 92019, Auckland
New Zealand
and from http://www.theregister.co.uk/2010/05/06/revolution_commercial_r/
Open source purists probably won't be all too happy to learn that Revolution is going to be employing an "open core" strategy, which means the core R programs will remain open source and be given tech support under a license model, but the key add-ons that make R more scalable will be closed source and sold under a separate license fee. Because most of those 2,500 add-ons for R were built by academics and Revolution wants to supplant SPSS and SAS as the tools used by students, Revolution will be giving the full single-user version of the R Enterprise stack away for free to academics. 
Conclusion-
So one co-founder of R is advocating not to buy from Revolution Analytics , which has the other co-founder of R, Gentleman on its board. 
Source- http://www.revolutionanalytics.com/aboutus/leadership.php

2) If Revolution Analytics is using 2500 packages for free but insisting on getting paid AND closing source of it’s packages (which is a technical point- how exactly can you prevent source code of a R package from being seen)

Maybe there can be a PACKAGE marketplace just like Android Apps, Facebook Apps, and Salesforce.com Apps – so atleast some of the thousands of R package developers can earn – sorry but email lists do not pay mortgages and no one is disputing the NEED for commercializing R or rewarding developers.

Though Barr created SAS, he gave up control to Goodnight and Sall https://decisionstats.wordpress.com/2010/06/02/sas-early-days/

and Goodnight and Sall do pay their developers well- to the envy of not so well paid counterparts.

3) I really liked the innovation of Revolution Analytics RevoScalar, and I wish that the default R dataset be converted to XDF dataset so that it basically kills

off the R criticism of being slow on bigger datasets. But I also realize the need for creating an analytics marketplace for R developers and R students- so academic version of R being free and Revolution R being paid seems like a trade off.

Note- You can still get a job faster as a stats student if you mention SAS and not R as a statistical skill- not all stats students go into academics.

4) There can be more elegant ways of handling this than calling for ignoring each other as REVOLUTION and Ihake seem to be doing to each other.

I can almost hear people in Cary, NC chuckling at Norman Nie, long time SPSS opponent and now REVOLUTION CEO, and his antagonizing R’s academicians within 1 year of taking over- so I hope this ends well for all. The road to hell is paved with good intentions- so if REVOLUTION can share some source code with say R Core members (even Microsoft shares source code with partners)- and R Core and Revolution agree on a licensing royalty from each other, they can actually speed up R package creation rather than allow this 2 decade effort to end up like S and S plus and TIBCO did.

Maybe Richard Stallman can help-or maybe Ihaka has a better sense of where things will go down in a couple of years-he must know something-he invented it, didnt he

On 09/05/10 09:52, Murray Jorgensen wrote:
> Perhaps of interest:
>
> http://www.theregister.co.uk/2010/05/06/revolution_commercial_r/

Please note that R is "free software" not "open source".  These guys
are selling a GPLed work without disclosing the source to their part
of the work. I have complained to them and so far they have given me
the brush off. I am now considering my options.

Don't support these guys by buying their product. The are not feeding
back to the rights holders (the University of Auckland and I are rights
holders and they didn't even have the courtesy to contact us).

--
Ross Ihaka                         Email:  ihaka at stat.auckland.ac.nz
Department of Statistics           Phone:  (64-9) 373-7599 x 85054
University of Auckland             Fax:    (64-9) 373-7018
Private Bag 92019, Auckland
New Zealand

Data Mining 2010:SAS Conference in Vegas

An interesting conference which I attended last year, this year one of the main guests is an ex professor of mine at UTenn. I am India bound this year though for family reasons.

http://www.sas.com/events/dmconf/over.html

Latest News

Early Bird Special
Register for M2010 before Sept. 17 and save $200 on conference fees!

Additional Data Mining Resources
Find additional data mining resouces including links to whitepapers, webinars, audio seminars, videos, blogs and online communities.

Location
Caesars Palace
Las Vegas, NV

Conference: October 25-26
Pre-conference workshops: October 24
Post-conference training: October 27-29

The M2010 Data Mining Conference is an international educational conference and exhibition for data mining practitioners including analysts, statisticians, programmers, consultants and anyone involved with data management within their organization, Hosted by SAS, M2010 is now in its 13th year and has become the world’s largest data mining conference, attracting over 600 people from various industries including Financial Services, Retail, Insurance, Technology, Education, Healthcare, Pharmaceutical, Government and more.

This conference is the top-choice for serious education and career networking. Conference highlights include

  • 6 keynotes
  • 36 sessions
  • 6 session tracks
  • exhibit hall
  • poster session
  • SAS software training
  • educational workshops
  • special events
  • networking opportunities
  • predictive modeling certification testing event.

Session Topics

  • Business applications
  • Data augmentation
  • Perspectives from the financial services industry
  • Fraud detection
  • Perspectives from the healthcare industry
  • New and emerging technologies
  • Perspectives from the retail industry
  • Data mining in marketing
  • Retention and Life Cycle Analysis
  • Text mining
  • And more! (View session abstracts.)

Interview Stephanie McReynolds Director Product Marketing, AsterData

Here is an interview with Stephanie McReynolds who works as as Director of Product Marketing with AsterData. I asked her a couple of questions about the new product releases from AsterData in analytics and MapReduce.

Ajay – How does the new Eclipse Plugin help people who are already working with huge datasets but are new to AsterData’s platform?

Stephanie- Aster Data Developer Express, our new SQL-MapReduce development plug-in for Eclipse, makes MapReduce applications easy to develop. With Aster Data Developer Express, developers can develop, test and deploy a complete SQL-MapReduce application in under an hour. This is a significant increase in productivity over the traditional analytic application development process for Big Data applications, which requires significant time coding applications in low-level code and testing applications on sample data.

Ajay – What are the various analytical functions that are introduced by you recently- list say the top 10.

Stephanie- At Aster Data, we have an intense focus on making the development process easier for SQL-MapReduce applications. Aster Developer Express is a part of this initiative, as is the release of pre-defined analytic functions. We recently launched both a suite of analytic modules and a partnership program dedicated to delivering pre-defined analytic functions for the Aster Data nCluster platform. Pre-defined analytic functions delivered by Aster Data’s engineering team are delivered as modules within the Aster Data Analytic Foundation offering and include analytics in the areas of pattern matching, clustering, statistics, and text analysis– just to name a few areas. Partners like Fuzzy Logix and Cobi Systems are extending this library by delivering industry-focused analytics like Monte Carlo Simulations for Financial Services and geospatial analytics for Public Sector– to give you a few examples.

Ajay – So okay I want to do a K Means Cluster on say a million rows (and say 200 columns) using the Aster method. How do I go about it using the new plug-in as well as your product.

Stephanie- The power of the Aster Data environment for analytic application development is in SQL-MapReduce. SQL is a powerful analytic query standard because it is a declarative language. MapReduce is a powerful programming framework because it can support high performance parallel processing of Big Data and extreme expressiveness, by supporting a wide variety of programming languages, including Java, C/C#/C++, .Net, Python, etc. Aster Data has taken the performance and expressiveness of MapReduce and combined it with the familiar declarativeness of SQL. This unique combination ensures that anyone who knows standard SQL can access advanced analytic functions programmed for Big Data analysis using MapReduce techniques.

kMeans is a good example of an analytic function that we pre-package for developers as part of the Aster Data Analytic Foundation. What does that mean? It means that the MapReduce portion of the development cycle has been completed for you. Each pre-packaged Aster Data function can be called using standard SQL, and executes the defined analytic in a fully parallelized manner in the Aster Data database using MapReduce techniques. The result? High performance analytics with the expressiveness of low-level languages accessed through declarative SQL.

Ajay – I see an an increasing focus on Analytics. Is this part of your product strategy and how do you see yourself competing with pure analytics vendors.

Stephanie – Aster Data is an infrastructure provider. Our core product is a massively parallel processing database called nCluster that performs at or beyond the capabilities of any other analytic database in the market today. We developed our analytics strategy as a response to demand from our customers who were looking beyond the price/performance wars being fought today and wanted support for richer analytics from their database provider. Aster Data analytics are delivered in nCluster to enable analytic applications that are not possible in more traditional database architectures.

Ajay – Name some recent case studies in Analytics of implementation of MR-SQL with Analytical functions

Stephanie – There are three new classes of applications that Aster Data Express and Aster Analytic Foundation support: iterative analytics, prediction and optimization, and ad hoc analysis.

Aster Data customers are uncovering critical business patterns in Big Data by performing hypothesis-driven, iterative analytics. They are exploring interactively massive volumes of data—terabytes to petabytes—in a top-down deductive manner. ComScore, an Aster Data customer that performs website experience analysis is a good example of an Aster Data customer performing this type of analysis.

Other Aster Data customers are building applications for prediction and optimization that discover trends, patterns, and outliers in data sets. Examples of these types of applications are propensity to churn in telecommunications, proactive product and service recommendations in retail, and pricing and retention strategies in financial services. Full Tilt Poker, who is using Aster Data for fraud prevention is a good example of a customer in this space.

The final class of application that I would like to highlight is ad hoc analysis. Examples of ad hoc analysis that can be performed includes social network analysis, advanced click stream analysis, graph analysis, cluster analysis and a wide variety of mathematical, trigonometry, and statistical functions. LinkedIn, whose analysts and data scientists have access to all of their customer data in Aster Data are a good example of a customer using the system in this manner.

While Aster Data customers are using nCluster in a number of other ways, these three new classes of applications are areas in which we are seeing particularly innovative application development.

Biography-

Stephanie McReynolds is Director of Product Marketing at Aster Data, where she is an evangelist for Aster Data’s massively parallel data-analytics server product. Stephanie has over a decade of experience in product management and marketing for business intelligence, data warehouse, and complex event processing products at companies such as Oracle, Peoplesoft, and Business Objects. She holds both a master’s and undergraduate degree from Stanford University.

Business Analytics Analyst Relations /Ethics/White Papers

Curt Monash, whom I respect and have tried to interview (unsuccessfully) points out suitable ethical dilemmas and gray areas in Analyst Relations in Business Intelligence here at http://www.dbms2.com/2010/07/30/advice-for-some-non-clients/

If you dont know what Analyst Relations are, well it’s like credit rating agencies for BI software. Read Curt and his landscaping of the field here ( I am quoting a summary) at http://www.strategicmessaging.com/the-ethics-of-white-papers/2010/08/01/

Vendors typically pay for

  1. They want to connect with sales prospects.
  2. They want general endorsement from the analyst.
  3. They specifically want endorsement from the analyst for their marketing claims.
  4. They want the analyst to do a better job of explaining something than they think they could do themselves.
  5. They want to give the analyst some money to enhance the relationship,

Merv Adrian (I interviewed Merv here at http://www.dudeofdata.com/?p=2505) has responded well here at http://www.enterpriseirregulars.com/23040/white-paper-sponsorship-and-labeling/

None of the sites I checked clearly identify the work as having been sponsored in any way I found obvious in my (admittefly) quick scan. So this is an issue, but it’s not confined to Oracle.

My 2 cents (not being so well paid 😉 are-

I think Curt was calling out Oracle (which didnt respond) and not Merv ( whose subsequent blog post does much to clarify).

As a comparative new /younger blogger in this field,
I applaud both Curt to try and bell the cat ( or point out what everyone in AR winks at) and for Merv for standing by him.

In the long run, it would strengthen analyst relations as a channel if they separate financial payment of content from bias. An example is credit rating agencies who forgot to do so in BFSI and see what happened.

Customers invest millions of dollars in BI systems trusting marketing collateral/white papers/webinars/tests etc. Perhaps it’s time for an industry association for analysts so that individual analysts don’t knuckle down under vendor pressure.

It is easier for someone of Curt, Merv’s stature to declare editing policy and disclosures before they write a white paper.It is much harder for everyone else who is not so well established.

White papers can take as much as 25,000$ to produce- and I know people who in Business Analytics (as opposed to Business Intelligence) slog on cents per hour cranking books on R, SAS , webinars, trainings but there are almost no white papers in BA. Are there any analytics independent analysts who are not biased by R or SAS or SPSS or etc etc. I am not sure but this looks like a good line to  pursue 😉 – provided ethical checks and balances are established.

Personally I know of many so called analytics communities go all out to please their sponsors so bias in writing does exist (you cant praise SAS on a R Blogging Forum or R USers Meet and you cant write on WPS at SAS Community.org )

– at the same time someone once told me- It is tough to make a living as a writer, and that choice between easy money and credible writing needs to be respected.

Most sponsored white papers I read are pure advertisements, directed at CEOs rather than the techie community at large.

Almost every BI vendor claims to have the fastest database with 5X speed- and benchmarking in technical terms could be something they could do too.

Just like Gadget sites benchmark products, you can not benchmark BI or even BA products as it is written not to do so  in many licensing terms.

Probably that is the reason Billions are spent in BI and the positive claims are doubtful ( except by the sellers). Similarly in Analytics, many vendors would have difficulty justifying their claims or prices if they are subjected to a side by side comparison. Unfortunately the resulting confusion results in shoddy technology coming stronger due to more aggressive marketing.

Protected: Analyzing SAS Institute-WPS Lawsuit

This content is password-protected. To view it, please enter the password below.