Here are some cool games I like to play on my Ubuntu 10.10 – I think they run on most other versions of Linux as well. 1) Open Arena– First person Shooter– This is like Quake Arena- very very nice graphics and good for playing for a couple of hours while taking a break. It is available here- http://openarena.ws/smfnews.php ideally if you have a bunch of gaming friends, playing on a local network or internet is quite mind blowing entertaining. And it’s free! 2) Armagetron– This is based on the TRON game of light cycles-It is available here at http://www.armagetronad.net/ or you can use Synaptic packages manager for all the games mentioned here
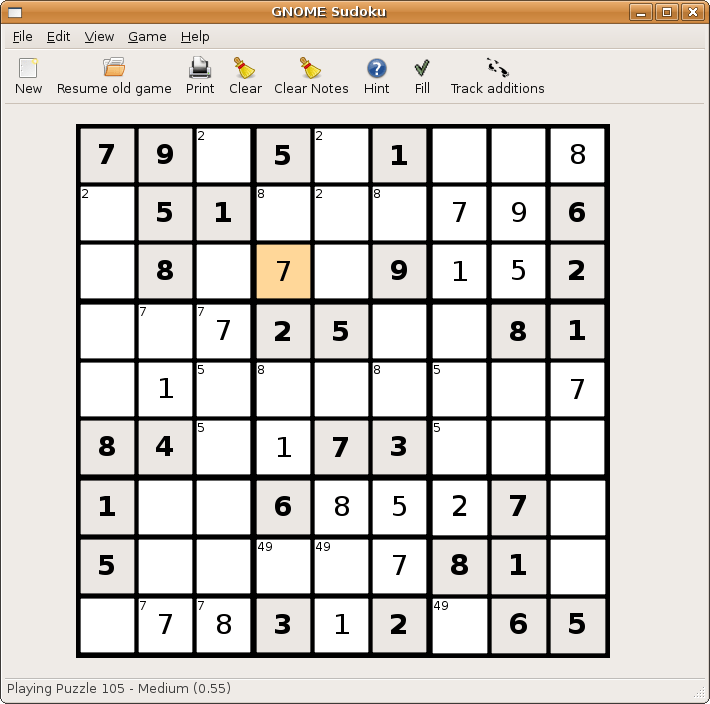
If violence or cars is not your stuff and you like puzzles like Sudoko, well just install the application Sudoko from http://gnome-sudoku.sourceforge.net/ Also recommended for people of various ages as it has multiple levels.
Gweled is a GNOME version of a popular PalmOS/Windows/Java game called “Bejeweled” or “Diamond Mine”. The aim of the game is to make alignment of 3 or more gems, both vertically or horizontally by swapping adjacent gems. The game ends when there are no possible moves left. Here are some key features of “Gweled”: · exact same gameplay as the commercial versions · SVG original graphics
7) Hearts – For this card game classis you can use Ubuntu software to install the package or go to http://linuxappfinder.com/package/gnome-hearts 8) Card Games- KPatience has almost 14 card games including solitaire, and free cell. 9) Sauerbraten -First person shooter with good network play, edit maps capabilities. You can read more here- http://sauerbraten.org/ 10) Tetris-KBlocks Tetris is the classic game. If you like classic slow games- Tetris is the best. and I like the toughest Tetris game -Bastet http://fph.altervista.org/prog/bastet.html Even an xkcd toon for it
That’s all for holiday season folks, the top 10 lists is based on almost 3 decades of gaming experience, but beauty is the eye of the beholder- so happy gaming for free.
Windows Desktop Price: $884 on 32-bit Windows and $1,149 on 64-bit Windows.
The Bridge to R is available on the Windows platforms and is available for free to customers who
license WPS through MineQuest,LLC. Companies and organizations outside of North America
may purchase a license for the Bridge to R which starts at $199 per desktop or $599 per server
Windows Server Price: $1,903 per logical CPU for 32-bit and $2,474 for 64-bit.
Note that Linux server versions are available but do not yet support the Eclipse IDE and are
command line only
WPS sure seems going well-but their pricing is no longer fixed and on the home website, you gotta fill a form. Ditt0 for the 30 day free evaluation
New language support, new data engines, larger datasets, improved scalability
LONDON, UK – 14 February 2011 – World Programming today released version 2.5.1 of their WPS software for workstations, servers and mainframes.
WPS is a competitively priced, high performance, highly scalable data processing and analytics software product that allows users to execute programs written in the language of SAS. WPS is supported on a wide variety of hardware and operating system platforms and can connect to and work with many types of data with ease. The WPS user interface (Workbench) is frequently praised for its ease of use and flexibility, with the option to include numerous third-party extensions.
This latest version of the software has the ability to manipulate even greater volumes of data, removing the previous 2^31 (2 billion) limit on number of observations.
Complimenting extended data processing capabilities, World Programming has worked hard to boost the performance, scalability and reliability of the WPS software to give users the confidence they need to run heavy workloads whilst delivering maximum value from available computer power.
WPS version 2.5.1 offers additional flexibility with the release of two new data engines for accessing Greenplum and SAND databases. WPS now comes with eleven data engines and can access a huge range of commonly used and industry-standard file-formats and databases.
Support in WPS for the language of SAS continues to expand with more statistical procedures, data step functions, graphing controls and many other language items and options.
WPS version 2.5.1 is available as a free upgrade to all licensed users of WPS.
Summary of Main New Features:
Supporting Even Larger Datasets
WPS is now able to process very large data sets by lifting completely the previous size limit of 2^31 observations.
Performance and Scalability Boosted
Performance and scalability improvements across the board combine to ensure even the most demanding large and concurrent workloads are processed efficiently and reliably.
More Language Support
WPS 2.5.1 continues the expansion of it’s language support with over 70 new language items, including new Procedures, Data Step functions and many other language items and options.
Statistical Analysis
The procedure support in WPS Statistics has been expanded to include PROC CLUSTER and PROC TREE.
Graphical Output
The graphical output from WPS Graphing has been expanded to accommodate more configurable graphics.
Hash Tables
Support is now provided for hash tables.
Greenplum®
A new WPS Engine for Greenplum provides dedicated support for accessing the Greenplum database.
SAND®
A new WPS Engine for SAND provides dedicated support for accessing the SAND database.
SQL Server®
To enhance existing SQL Server database access, a new SQLSERVR (please note spelling) facility in the ODBC engine.
More Information:
Existing Users should visit www.teamwpc.co.uk/support/wps/release where you can download a readme file containing more information about all the new features and fixes in WPS 2.5.1.
The only issue is Rattle can be quite difficult to install due to dependencies on GTK+
After fiddling for a couple of years- this is what I did
1) Created dual boot OS- Basically downloaded the netbook remix from http://ubuntu.com I created a dual boot OS so you can choose at the beginning whether to use Windows or Ubuntu Linux in that session. Alternatively you can download VM Player www.vmware.com/products/player/ if you want to do both
2) Download R packages using Ubuntu packages and Install GTK+ dependencies before that.
GTK + Requires
Libglade
Glib
Cairo
Pango
ATK
If you are a Linux newbie like me who doesnt get the sudo apt get, tar, cd, make , install rigmarole – scoot over to synaptic software packages or just the main ubuntu software centre and download these packages one by one.
For R Dependencies, you need
PMML
XML
RGTK2
Again use r-cran as the prefix to these package names and simply install (almost the same way Windows does it easily -double click)
Save theses to your hard disk (e.g., to your Desktop) but don’t extract them. Then, on GNU/Linux run the install command shown below. This command is entered into a terminal window:
R CMD INSTALL rattle_2.6.0.tar.gz
After installation-
5) Type library(rattle) and rattle.info to get messages on what R packages to update for a proper functioning
</code>

> library(rattle)
Rattle: Graphical interface for data mining using R.
Version 2.6.0 Copyright (c) 2006-2010 Togaware Pty Ltd.
Type 'rattle()' to shake, rattle, and roll your data.
> rattle.info()
Rattle: version 2.6.0
R: version 2.11.1 (2010-05-31) (Revision 52157)

Sysname: Linux
Release: 2.6.35-23-generic
Version: #41-Ubuntu SMP Wed Nov 24 10:18:49 UTC 2010
Nodename: k1-M725R
Machine: i686
Login: k1ng
User: k1ng

Installed Dependencies
RGtk2: version 2.20.3
pmml: version 1.2.26
colorspace: version 1.0-1
cairoDevice: version 2.14
doBy: version 4.1.2
e1071: version 1.5-24
ellipse: version 0.3-5
foreign: version 0.8-41
gdata: version 2.8.1
gtools: version 2.6.2
gplots: version 2.8.0
gWidgetsRGtk2: version 0.0-69
Hmisc: version 3.8-3
kernlab: version 0.9-12
latticist: version 0.9-43
Matrix: version 0.999375-46
mice: version 2.4
network: version 1.5-1
nnet: version 7.3-1
party: version 0.9-99991
playwith: version 0.9-53
randomForest: version 4.5-36 upgrade available 4.6-2
rggobi: version 2.1.16
survival: version 2.36-2
XML: version 3.2-0
bitops: version 1.0-4.1

Upgrade the packages with:

 > install.packages(c("randomForest"))

<code>
Now upgrade whatever package rattle.info tells to upgrade.
This is much simpler and less frustrating than some of the other ways to install Rattle.
If all goes well, you will see this familiar screen popup when you type
Additional features in R over other analytical packages-
1) Source Code is given to ensure complete custom solution and embedding for a particular application. Open source code has an advantage that is extensively peer- reviewed in Journals and Scientific Literature. This means bugs will found, shared and corrected transparently.
2) Wide literature of training material in the form of books is available for the R analytical platform.
3) Extensively the best data visualization tools in analytical software (apart from Tableau Software ‘s latest version). The extensive data visualization available in R is of the form a variety of customizable graphs, as well as animation. The principal reason third-party software initially started creating interfaces to R is because the graphical library of packages in R is more advanced as well as rapidly getting more features by the day.
4) Free in upfront license cost for academics and thus budget friendly for small and large analytical teams.
5) Flexible programming for your data environment. This includes having packages that ensure compatibility with Java, Python and C++.
6) Easy migration from other analytical platforms to R Platform. It is relatively easy for a non R platform user to migrate to R platform and there is no danger of vendor lock-in due to the GPL nature of source code and open community.
Statistics are numbers that tell (descriptive), advise ( prescriptive) or forecast (predictive). Analytics is a decision-making help tool. Analytics on which no decision is to be made or is being considered can be classified as purely statistical and non analytical. Thus ease of making a correct decision separates a good analytical platform from a not so good analytical platform. The distinction is likely to be disputed by people of either background- and business analysis requires more emphasis on how practical or actionable the results are and less emphasis on the statistical metrics in a particular data analysis task. I believe one clear reason between business analytics is different from statistical analysis is the cost of perfect information (data costs in real world) and the opportunity cost of delayed and distorted decision-making.
Specific to the following domains R has the following costs and benefits
Business Analytics
R is free per license and for download
It is one of the few analytical platforms that work on Mac OS
It’s results are credibly established in both journals like Journal of Statistical Software and in the work at LinkedIn, Google and Facebook’s analytical teams.
It has open source code for customization as per GPL
It also has a flexible option for commercial vendors like Revolution Analytics (who support 64 bit windows) as well as bigger datasets
It has interfaces from almost all other analytical software including SAS,SPSS, JMP, Oracle Data Mining, Rapid Miner. Existing license holders can thus invoke and use R from within these software
Huge library of packages for regression, time series, finance and modeling
High quality data visualization packages
Data Mining
R as a computing platform is better suited to the needs of data mining as it has a vast array of packages covering standard regression, decision trees, association rules, cluster analysis, machine learning, neural networks as well as exotic specialized algorithms like those based on chaos models.
Flexibility in tweaking a standard algorithm by seeing the source code
The RATTLE GUI remains the standard GUI for Data Miners using R. It was created and developed in Australia.
Business Dashboards and Reporting
Business Dashboards and Reporting are an essential piece of Business Intelligence and Decision making systems in organizations. R offers data visualization through GGPLOT, and GUI like Deducer and Red-R can help even non R users create a metrics dashboard
For online Dashboards- R has packages like RWeb, RServe and R Apache- which in combination with data visualization packages offer powerful dashboard capabilities.
R can be combined with MS Excel using the R Excel package – to enable R capabilities to be imported within Excel. Thus a MS Excel user with no knowledge of R can use the GUI within the R Excel plug-in to use powerful graphical and statistical capabilities.
Additional factors to consider in your R installation-
There are some more choices awaiting you now-
1) Licensing Choices-Academic Version or Free Version or Enterprise Version of R
2) Operating System Choices-Which Operating System to choose from? Unix, Windows or Mac OS.
3) Operating system sub choice- 32- bit or 64 bit.
4) Hardware choices-Cost -benefit trade-offs for additional hardware for R. Choices between local ,cluster and cloud computing.
5) Interface choices-Command Line versus GUI? Which GUI to choose as the default start-up option?
6) Software component choice- Which packages to install? There are almost 3000 packages, some of them are complimentary, some are dependent on each other, and almost all are free.
7) Additional Software choices- Which additional software do you need to achieve maximum accuracy, robustness and speed of computing- and how to use existing legacy software and hardware for best complementary results with R.
1) Licensing Choices-
You can choose between two kinds of R installations – one is free and open source from http://r-project.org The other R installation is commercial and is offered by many vendors including Revolution Analytics. However there are other commercial vendors too.
Windows remains the most widely used operating system on this planet. If you are experienced in Windows based computing and are active on analytical projects- it would not make sense for you to move to other operating systems. This is also based on the fact that compatibility problems are minimum for Microsoft Windows and the help is extensively documented. However there may be some R packages that would not function well under Windows- if that happens a multiple operating system is your next option.
Enterprise R from Revolution Analytics- Enterprise R from Revolution Analytics has a complete R Development environment for Windows including the use of code snippets to make programming faster. Revolution is also expected to make a GUI available by 2011. Revolution Analytics claims several enhancements for it’s version of R including the use of optimized libraries for faster performance.
MacOS
Reasons for choosing MacOS remains its considerable appeal in aesthetically designed software- but MacOS is not a standard Operating system for enterprise systems as well as statistical computing. However open source R claims to be quite optimized and it can be used for existing Mac users. However there seem to be no commercially available versions of R available as of now for this operating system.
Linux
Ubuntu
Red Hat Enterprise Linux
Other versions of Linux
Linux is considered a preferred operating system by R users due to it having the same open source credentials-much better fit for all R packages and it’s customizability for big data analytics.
Ubuntu Linux is recommended for people making the transition to Linux for the first time. Ubuntu Linux had an marketing agreement with revolution Analytics for an earlier version of Ubuntu- and many R packages can installed in a straightforward way as Ubuntu/Debian packages are available. Red Hat Enterprise Linux is officially supported by Revolution Analytics for it’s enterprise module. Other versions of Linux popular are Open SUSE.
Multiple operating systems-
Virtualization vs Dual Boot-
You can also choose between having a VMware VM Player for a virtual partition on your computers that is dedicated to R based computing or having operating system choice at the startup or booting of your computer. A software program called wubi helps with the dual installation of Linux and Windows.
64 bit vs 32 bit – Given a choice between 32 bit versus 64 bit versions of the same operating system like Linux Ubuntu, the 64 bit version would speed up processing by an approximate factor of 2. However you need to check whether your current hardware can support 64 bit operating systems and if so- you may want to ask your Information Technology manager to upgrade atleast some operating systems in your analytics work environment to 64 bit operating systems.
Hardware choices- At the time of writing this book, the dominant computing paradigm is workstation computing followed by server-client computing. However with the introduction of cloud computing, netbooks, tablet PCs, hardware choices are much more flexible in 2011 than just a couple of years back.
Hardware costs are a significant cost to an analytics environment and are also remarkably depreciated over a short period of time. You may thus examine your legacy hardware, and your future analytical computing needs- and accordingly decide between the various hardware options available for R.
Unlike other analytical software which can charge by number of processors, or server pricing being higher than workstation pricing and grid computing pricing extremely high if available- R is well suited for all kinds of hardware environment with flexible costs. Given the fact that R is memory intensive (it limits the size of data analyzed to the RAM size of the machine unless special formats and /or chunking is used)- it depends on size of datasets used and number of concurrent users analyzing the dataset. Thus the defining issue is not R but size of the data being analyzed.
Local Computing- This is meant to denote when the software is installed locally. For big data the data to be analyzed would be stored in the form of databases.
Server version- Revolution Analytics has differential pricing for server -client versions but for the open source version it is free and the same for Server or Workstation versions.
Workstation
Cloud Computing- Cloud computing is defined as the delivery of data, processing, systems via remote computers. It is similar to server-client computing but the remote server (also called cloud) has flexible computing in terms of number of processors, memory, and data storage. Cloud computing in the form of public cloud enables people to do analytical tasks on massive datasets without investing in permanent hardware or software as most public clouds are priced on pay per usage. The biggest cloud computing provider is Amazon and many other vendors provide services on top of it. Google is also coming for data storage in the form of clouds (Google Storage), as well as using machine learning in the form of API (Google Prediction API)
Amazon
Google
Cluster-Grid Computing/Parallel processing- In order to build a cluster, you would need the RMpi and the SNOW packages, among other packages that help with parallel processing.
How much resources
RAM-Hard Disk-Processors- for workstation computing
Instances or API calls for cloud computing
Interface Choices
Command Line
GUI
Web Interfaces
Software Component Choices
R dependencies
Packages to install
Recommended Packages
Additional software choices
Additional legacy software
Optimizing your R based computing
Code Editors
Code Analyzers
Libraries to speed up R
citation- R Development Core Team (2010). R: A language and environment for statistical computing. R Foundation for Statistical Computing,Vienna, Austria. ISBN 3-900051-07-0, URL http://www.R-project.org.
I had tried recreating this .gif using #catools in a windows environment, but the resolution was not quite good. it seems package catools is dependent on Operating System,
Anyway, there are two approaches to creating this code- one is given at
library(caTools)  # external package providing write.gif function
jet.colors = colorRampPalette(c("#00007F", "blue", "#007FFF", "cyan", "#7FFF7F",
        "yellow", "#FF7F00", "red", "#7F0000"))
m = 600     # define size
C = complex( real=rep(seq(-1.8,0.6, length.out=m), each=m ),
    imag=rep(seq(-1.2,1.2, length.out=m), m ) )
C = matrix(C,m,m)  # reshape as square matrix of complex numbers
Z = 0     # initialize Z to zero
X = array(0, c(m,m,20)) # initialize output 3D array
for (k in 1:20) {  # loop with 20 iterations
 Z = Z^2+C    # the central difference equation
 X[,,k] = exp(-abs(Z)) # capture results
}
write.gif(X, "Mandelbrot.gif", col=jet.colors, delay=100)

The other approach is from http://rtricks.blogspot.com/
and also suggests who the original author of this fascinating
 Mandelbrot gif was
- apparently it was created in 2005 and is
5 years old

### Reproduced from http://tolstoy.newcastle.edu.au/R/help/05/10/13198.html### Written by Jarek Tuszynski, PhD.
library(fields)# for tim.colorslibrary(caTools)# for write.gif
m = 400# grid sizeC = complex(real=rep(seq(-1.8,0.6, length.out=m), each=m ),
imag=rep(seq(-1.2,1.2, length.out=m), m ))C = matrix(C,m,m)
Z = 0
X = array(0,c(m,m,20))for(k in1:20){
Z = Z^2+C
X[,,k] = exp(-abs(Z))}image(X[,,k],col=tim.colors(256))# show final image in
write.gif(X,"Mandelbrot.gif",col=tim.colors(256), delay=100)
and finally- this time I used Linux /Ubuntu 10
and got the colors correct- just happy to find who created the original image


 2) Armagetron– This is based on the TRON game of light cycles-It is available here at http://www.armagetronad.net/ or you can use Synaptic packages manager for all the games mentioned here
 5) Pacman/Njam- Clone of the original classic game. Downloadable from http://www.linuxcompatible.org/news/story/pacman_for_linux.html
  6) Gweled– This is free clone version of Bejeweled. It now has a new website at http://gweled.org/
  http://linux.softpedia.com/progDownload/Gweled-Download-3449.html
 8) Card Games- KPatience has almost 14 card games including solitaire, and free cell.
  9) Sauerbraten -First person shooter with good network play, edit maps capabilities. You can read more here- http://sauerbraten.org/
  10) Tetris-KBlocks Tetris is the classic game. If you like classic slow games- Tetris is the best. and I like the toughest Tetris game -Bastet http://fph.altervista.org/prog/bastet.html
  Even an xkcd toon for it


