Top Cartoonists:Updated

Here is a list of cartoonists I follow- I sometimes think they make more sense than all the news media combined.

1) Mike Luckovich He is a Pulitzer Prize winning cartoonist for AJC at http://blogs.ajc.com/mike-luckovich/

I love his political satire-sometimes not his politics- though he is a liberal (surprisingly most people from creative arts tend to be liberal- guess because they support and need welfare more, 🙂 ) Since I am in India- I call myself a conservative (when filing taxes) or liberal (when drinking er tea)

2) Hugh Mcleod- of Gaping Void is very different from Mike above, in the way an abstract painter would be from a classical

artist. I like his satire on internet, technology and personal favorite – social media consultants. Hugh casts a critical eye on the world of tech and is an immensely successful artist- probably the Andy Warhol of this genre in a generation.

3) Doug Savage of Savage Chickens http://www.savagechickens.com/ has a great series of funny cartoons based on chickens drawn on Post it notes. While his drawing is less abstract than Hugh’s above, he sometimes touches an irreverent note more like Hugh than anyone else.

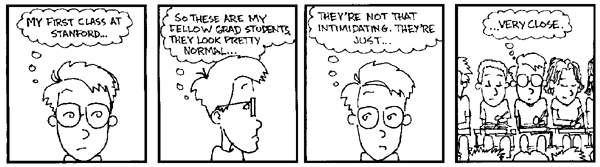
4) Professor Jorge Cham of Phd Comics http://www.phdcomics.com/comics.php is probably the most read comic in grad school  – and probably the only cartoonist with a Phd I know of.

5) Scott Adams of Dilbert http://www.dilbert.com/ is probably the first “non kid stuff” cartoonist I started reading-in fact I once wrote to him asking for advice on my poetry to his credit- he replied with a single ” Best of Luck email”

They named our email server in Lucknow, UP, India for him (in my business school at http://iiml.ac.in ) Probably the best of corporate toon humor. Maybe they should make the Dilbert movie yet.

6) Randall Munroe of xkcd.com

XKCD is geek cartooning at its best.

For catching up with the best toons in a week, the best is Time.com ‘s weekly list at http://www.time.com/time/cartoonsoftheweek

It is the best collection of political cartoons.

China -United States -The Third Opium War

U.S.troops in China during the Boxer Rebellion...
Image via Wikipedia

A brief glance through http://www.treasury.gov/resource-center/data-chart-center/tic/Documents/mfh.txt

shows that while US added 600 billion of debt during the past one year, the Chinese actually reduced their exposure by 50 billion Dollars.

so who has been financing the debt for the US for the past one year- It is Japan- eager to keep its currency down and United Kingdom which has pumped in an extra 300 billion of T Bills.

See the whole table at official link above or at goo.gl/qMugp

—————————————————————————————-

China still remembers the Opium Wars in which the then ruling Anglo Saxon superpower used naval superiority to enforce trade and eventual political dependency. Is China unsure of the United States brotherly nice  intentions? They certainly seem to be putting their money that way.

http://en.wikipedia.org/wiki/Opium_Wars

Britain forced the Chinese government into signing theTreaty of Nanking and the Treaty of Tianjin, also known as the Unequal Treaties, which included provisions for the opening of additional ports to unrestricted foreign trade, for fixed tariffs; for the recognition of both countries as equal in correspondence; and for the cession of Hong Kong to Britain. The British also gained extraterritorial rights. Several countries followed Britain and sought similar agreements with China. Many Chinese found these agreements humiliating and these sentiments contributed to the Taiping Rebellion (1850–1864), the Boxer Rebellion (1899–1901), and the downfall of the Qing Dynasty in 1912, putting an end to dynastic China.

———————————————————————————————-

The Koreans can always be depended on provide the first shot in any conflict- and though Anglo-US-Chinese conflict would be expensive- I guess as long as the cost of outstanding debt with China is less than cost of a brief -techno-war , we would see interesting games in this neighborhood. Note China restricts major trade with United States particularly in software, internet services (like Web Advertising, Facebook, Twitter ) and represents a lucrative market for big pharma (especially in psychiatric drugs) and big tech once it reforms its intellectual property rights. Software would be the opium of the 21st Century- if Chinese resist the Treasury Bills as their poppy flowers. The widespread Western media coverage of school kids murders by pyschopaths is also a trade tactic to encourage flow of more US made medicine in the Chinese market.

It would also help create an economic revival in the United States to exaggerate the Chinese threat (remember Sputnik) and build up its own cyber spending. Any military or cyber humiliation for the ruling party in China can help create a political vacuum for more malleable and agreeable alternatives to emerge.

(to be continued)


An Introduction to Data Mining-online book

I was reading David Smith’s blog http://blog.revolutionanalytics.com/

where he mentioned this interview of Norman Nie, at TDWI

http://tdwi.org/Articles/2010/11/17/R-101.aspx?Page=2

where I saw this link (its great if you want to study Data Mining btw)

http://www.kdnuggets.com/education/usa-canada.html

and I c/liked the U Toronto link

http://chem-eng.utoronto.ca/~datamining/

Best of All- I really liked this online book created by Professor S. Sayad

Its succinct and beautiful and describes all of the Data Mining you want to read in one Map (actually 4 images painstakingly assembled with perfection)

The best thing is- in the original map- even the sub items are click-able for specifics like Pie Chart and Stacked Column chart are not in one simple drop down like Charts- but rather by nature of the kind of variables that lead to these charts. For doing that- you would need to go to the site itself- ( see http://chem-eng.utoronto.ca/~datamining/dmc/categorical_variables.htm

vs

http://chem-eng.utoronto.ca/~datamining/dmc/categorical_numerical.htm

Again- there is no mention of the data visualization software used to create the images but I think I can take a hint from the Software Page which says software used are-

Software

See it on your own-online book (c)Professor S. Sayad

Really good DIY tutorial

http://chem-eng.utoronto.ca/~datamining/dmc/data_mining_map.htm

Machine Addictions

in the middle of essential and inevitable tasks
restless inner conscience wakens and asks
stuck again today to the computer are we now
please remind me this state we reached how

oh we had bills to pay student loans to repay
once we got hooked t’was easy to be carried away
just a matter of time before inevitable voices query
this is my machine that I want to marry

I spend more time with him/her as it is
the Machinery is devoted with focused loyalties
meanwhile the non machine world goes round
strives forth on things less profound

as we stroke the keys and click the mouse
machine addictions will only add to human grouse

Jobs in Analytics

Here are some jobs from Vincent Granville, founder Analyticbridge. Please contact him directly- I just thought the Season of Joy should have better jobs than currently.

————————————————————————————–

Several job ads recently posted on DataShaping / AnalyticBridge, across United Sates and in Europe. Use the DataShaping search box to find more opportunities.

Job ads are posted at:


Selected opportunities:

Quantitative Modeling Consultants – Agilex (Alexandria, VA)
Sr. Software Development Engineers – Agilex (Alexandria, VA)
Actuary – FBL Financial Group (Des Moines, IA)
Relevance scientist – Yandex Labs (Palo Alto, CA)
Research Engineer, Search Ranking – Chomp (San Francisco, CA)
Mathematical Modeling and Optimization – Exxon (Clinton, NJ)
Data Analyst – DISH Network (Englewood, CO)
Sr Aviation Planning Research & Data Analyst – Port of Seattle (Seattle, WA)
Statistician / Quantitative Analyst – Indeed (Austin, TX)
Statistician – Pratt & Whitney (East Hartford, CT)
Biostatistician – The J. David Gladstone Institutes (San Francisco, CA)
Customer Service Representative (oklahoma, OK)
Program Associate – Cambridge Systematics (Washington D.C., DC)
Sr Risk Analyst – Paypal (Omaha, NE)
Sr. Actuarial Analyst – Farmers (Simi Valley, CA)
Senior Statistician, Data Services – Equifax (Alpharetta, GA)
Business Intelligence Analyst – Burbery (NYC, NY)
Fact Extraction – Amazon (Seattle, WA)
Senior Researcher – Bing (Bellevue, WA)
Senior Statistical Research Analyst – Walt Disney (Lake Buena Vista, FL)
Statistician – Capital One (Nottingham, NH)
Lead Data Analyst – Barclays (Northampton, UK)
Analytical Data Scientist – Aviagen (Huntsville, AL or Edinburgh, UK)
VP of Engineering for Analytics (Bay Area, CA)
Senior Software Engineer – Numenta (Redwood City, CA)
Numenta Internship Program – Numenta (Redwood City, CA)
Director of Analytics – Mozilla Corporation (Mountain View, CA)
Senior Sales Engineer – Statsoft (NY, NY)

Complex Event Processing- SASE Language

Logo of the anti-RFID campaign by German priva...
Image via Wikipedia

Complex Event Processing (CEP- not to be confused by Circular Probability Error) is defined processing many events happening across all the layers of an organization, identifying the most meaningful events within the event cloud, analyzing their impact, and taking subsequent action in real time.

Software supporting CEP are-

Oracle http://www.oracle.com/us/technologies/soa/service-oriented-architecture-066455.html

Oracle CEP is a Java application server for the development and deployment of high-performance event driven applications. It can detect patterns in the flow of events and message payloads, often based on filtering, correlation, and aggregation across event sources, and includes industry leading temporal and ordering capabilities. It supports ultra-high throughput (1 million/sec++) and microsecond latency.

Tibco is also trying to get into this market (it claims to have a 40 % market share in the public CEP market 😉 though probably they have not measured the DoE and DoD as worthy of market share yet

– see webcast by TIBCO ‘s head here http://www.tibco.com/products/business-optimization/complex-event-processing/default.jsp

and product info here-http://www.tibco.com/products/business-optimization/complex-event-processing/businessevents/default.jsp

TIBCO is the undisputed leader in complex event processing (CEP) software with over 40 percent market share, according to a recent IDC Study.

A good explanation of how social media itself can be used as an analogy for CEP is given in this SAS Global Paper

http://support.sas.com/resources/papers/proceedings10/040-2010.pdf

You can see a report on Predictive Analytics and Data Mining  in q1 2010 also from SAS’s website  at –http://www.sas.com/news/analysts/forresterwave-predictive-analytics-dm-104388-0210.pdf

A very good explanation on architecture involved is given by SAS CTO Keith Collins here on SAS’s Knowledge Exchange site,

http://www.sas.com/knowledge-exchange/risk/four-ways-divide-conquer.html

What it is: Methods 1 through 3 look at historical data and traditional architectures with information stored in the warehouse. In this environment, it often takes months of data cleansing and preparation to get the data ready to analyze. Now, what if you want to make a decision or determine the effect of an action in real time, as a sale is made, for instance, or at a specific step in the manufacturing process. With streaming data architectures, you can look at data in the present and make immediate decisions. The larger flood of data coming from smart phones, online transactions and smart-grid houses will continue to increase the amount of data that you might want to analyze but not keep. Real-time streaming, complex event processing (CEP) and analytics will all come together here to let you decide on the fly which data is worth keeping and which data to analyze in real time and then discard.

When you use it: Radio-frequency identification (RFID) offers a good user case for this type of architecture. RFID tags provide a lot of information, but unless the state of the item changes, you don’t need to keep warehousing the data about that object every day. You only keep data when it moves through the door and out of the warehouse.

The same concept applies to a customer who does the same thing over and over. You don’t need to keep storing data for analysis on a regular pattern, but if they change that pattern, you might want to start paying attention.

Figure  4: Traditional architecture vs. streaming architecture

Figure 4: Traditional architecture vs. streaming architecture


In academia  here is something called SASE Language

  • A rich declarative event language
  • Formal semantics of the event language
  • Theorectical underpinnings of CEP
  • An efficient automata-based implementation

http://sase.cs.umass.edu/

and

http://avid.cs.umass.edu/sase/index.php?page=navleft_1col

Financial Services

The query below retrieves the total trading volume of Google stocks in the 4 hour period after some bad news occurred.

PATTERN SEQ(News a, Stock+ b[ ])WHERE   [symbol]    AND	a.type = 'bad'    AND	b[i].symbol = 'GOOG' WITHIN  4 hoursHAVING  b[b.LEN].volume < 80%*b[1].volumeRETURN  sum(b[ ].volume)

The next query reports a one-hour period in which the price of a stock increased from 10 to 20 and its trading volume stayed relatively stable.

PATTERN	SEQ(Stock+ a[])WHERE 	 [symbol]   AND	  a[1].price = 10   AND	  a[i].price > a[i-1].price   AND	  a[a.LEN].price = 20            WITHIN  1 hourHAVING	avg(a[].volume) ≥ a[1].volumeRETURN	a[1].symbol, a[].price

The third query detects a more complex trend: in an hour, the volume of a stock started high, but after a period of price increasing or staying relatively stable, the volume plummeted.

PATTERN SEQ(Stock+ a[], Stock b)WHERE 	 [symbol]   AND	  a[1].volume > 1000   AND	  a[i].price > avg(a[…i-1].price))   AND	  b.volume < 80% * a[a.LEN].volume           WITHIN  1 hourRETURN	a[1].symbol, a[].(price,volume), b.(price,volume)

(note from Ajay-


I was not really happy about the depth of resources on CEP available online- there seem to be missing bits and pieces in both open source, academic and corporate information- one reason for this is the obvious military dual use of this technology- like feeds from Satellite, Audio Scans, etc)

Why social media is an one way street- cant close accounts

Update to https://decisionstats.com/2010/11/24/deleting-twitter-facebooklinkedin-accepting-life/

You cant DELETE a Facebook Account- it gets deactivated NOT DELETED.

You have to delete photo albums one by one, but if you have a folder like profile photos or wall photos or mobile uploads  (you cant delete these folders you have to delete those photos one by one)

So I had to delete 1100 friends, delete all Facebook Pages I created, and then download the account- (photos) which were now a more easy to download zip file of 92 mb. And I deleted all the 250+ Likes I had given to things I had flippantly liked- it was horrifying because if you accumulate all that info- it basically gives you a big lead in estimating my psychological profile- and thats not stuff I want to be used for selling.

Then I deactivated it- no like Lord Voldermort’s horcruxes you cant delete it all.

and Facebook shows you ads even if you clean your profile and your friends and can longer see any preference for any product.

Facebook treats data like prisoners – even if you are released they WILL maintain your record.

20 years later they would be able to blackmail all the people  of all countries in the WORLD- by that much info.

And Linkedin is still getting deleted- I got this email from them-

basically if you have an active group for whom you are the only owner you cant delete yourself- you have to delete the group or find another owner.

Sigh!

If it took me 2 days to download all my info, and wipe my social media for just 3 yrs of using it (albiet at an expert enough level to act as a social media consultant to some companies)- I am not sure what today’s generation of young people who jump to twitter and Facebook at early ages would face after say 5-10 years of data is collected on them. Lots of Ads I guess!