Webinar: Using R within Oracle #rstats

Webinar: Using R within Oracle — Nov 30, noon EST

==========================================
Oracle now supports the R open source statistical programming language. Come to this webinar to learn more about using R within an Oracle environment.

— URL for TechCast: https://stbeehive.oracle.com/bconf/confDetails?confID=334B:3BF0:owch:38893C00F42F38A1E0404498C8A6612B0004075AECF7&guest=true&confKey=608880
— Web Conference ID: 303397
— Web Conference Key: 608880
— Dialup:             1-866-682-4770      , ID 5548204, passcode 1234

After a steady rise in the past few years, in 2010 the open source data mining software R overtook other tools to become the tool used by more data miners (43%) than any other (http://www.rexeranalytics.com/Data-Miner-Survey-Results-2010.html).

Several analytic tool vendors have added R-integration to their software. However, Oracle is the largest company to throw their weight behind R. On October 3, Oracle unveiled their integration of R: Oracle R Enterprise (http://www.oracle.com/us/corporate/features/features-oracle-r-enterprise-498732.html) as part of their Oracle Big Data Appliance announcement (http://www.oracle.com/us/corporate/press/512001).

Oracle R Enterprise allows users to perform statistical analysis with advanced visualization on data stored in Oracle Database. Oracle R Enterprise enables scalable R solutions, while facilitating production deployment of R scripts and Hadoop based solutions, as well as integration of R results with Oracle BI Publisher and OBIEE dashboards.

This TechCast introduces the various Oracle R Enterprise components and features, along with R script demonstrations that interface with Oracle Database.

TechCast presenter: Mark Hornick, Senior Manager, Oracle Advanced Analytics Development.
This TechCast is part of the ongoing TechCasts series coordinated by Oracle BIWA: The BI, Warehousing and Analytics SIG (http://www.oracleBIWA.org).

Product Review – Revolution R 5.0

So I got the email from Revolution R. Version 5.0 is ready for download, and unlike half hearted attempts by many software companies they make it easy for the academics and researchers to get their free copy. Free as in speech and free as in beer.

Some thoughts-

1) R ‘s memory problem is now an issue of marketing and branding. Revolution Analytics has definitely bridged this gap technically  beautifully and I quote from their documentation-

The primary advantage 64-bit architectures bring to R is an increase in the amount of memory available to a given R process.
The first benefit of that increase is an increase in the size of data objects you can create. For example, on most 32-bit versions of R, the largest data object you can create is roughly 3GB; attempts to create 4GB objects result in errors with the message “cannot allocate vector of length xxxx.”
On 64-bit versions of R, you can generally create larger data objects, up to R’s current hard limit of 231 􀀀 1 elements in a vector (about 2 billion elements). The functions memory.size and memory.limit help you manage the memory used byWindows versions of R.
In 64-bit Revolution R Enterprise, R sets the memory limit by default to the amount of physical RAM minus half a gigabyte, so that, for example, on a machine with 8GB of RAM, the default memory limit is 7.5GB:

2) The User Interface is best shown as below or at  https://docs.google.com/presentation/pub?id=1V_G7r0aBR3I5SktSOenhnhuqkHThne6fMxly_-4i8Ag&start=false&loop=false&delayms=3000

-(but I am still hoping for the GUI ,Revolution Analytics promised us for Christmas)

3) The partnership with Microsoft HPC is quite awesome given Microsoft’s track record in enterprise software penetration

but I am also interested in knowing more about the Oracle version of R and what it will do there.

Moving data between Windows and Ubuntu VMWare partition

I use Windows 7 on my laptop (it came pre-installed) and Ubuntu using the VMWare Player. What are the advantages of using VM Player instead of creating a dual-boot system? Well I can quickly shift from Ubuntu to Windows and bakc again without restarting my computer everytime. Using this approach allows me to utilize software that run only on Windows and run software like Rattle, the R data mining GUI, that are much easier installed on Linux.

However if your statistical software is on your Virtual Disk , and your data is on your Windows disk, you need a way to move data from Windows to Ubuntu.

The solution to this as per Ubuntu forums is –http://communities.vmware.com/thread/55242

Open My Computer, browse to the folder you want to share.  Right-click on the folder, select Properties.  Sharing tab.  Select the radio button to “Share this Folder”.  Change the default generated name if you wish; add a description if you wish.  Click the Permissions button to modify the security settings of what users can read/write to the share.

On the Linux side, it depends on the distro, the shell, and the window manager.

Well Ubuntu makes it really easy to configure the Linux steps to move data within Windows and Linux partitions.


NEW UPDATE-

VMmare makes it easy to share between your Windows (host) and Linux (guest) OS


Step 1

and step 2

Do this


and

Start the Wizard

when you finish the wizard and share a drive or folder- hey where do I see my shared ones-


see this folder in Linux- /mnt/hgfs (bingo!)

Hacker HW – Make this folder //mnt/hgfs a shortcut in Places your Ubuntu startup

Hacker Hw 2-

Upload using an anon email your VM dark data to Ubuntu one

Delete VM

Purge using software XX

Reinstall VM and bring back backup


Note time to do this


-General Sharing in Windows


Just open the Network tab in Ubuntu- see screenshots below-

Windows will now ask your Ubuntu user for login-

Once Logged in Windows from within Ubuntu Vmware, this is what happens

You see a tab called “users on “windows username”- pc appear on your Ubuntu Desktop  (see top right of the screenshot)

If you double click it- you see your windows path

You can now just click and drag data between your windows and linux partitions , just the way you do it in Windows .

So based on this- if you want to build  decision trees, artifical neural networks, regression models, and even time series models for zero capital expenditure- you can use both Ubuntu/R without compromising on your IT policy of Windows only in your organization (there is a shortage of Ubuntu trained IT administrators in the enterprise world)

Revised Installation Procedure for utilizing both Ubuntu /R/Rattle data mining on your Windows PC.

Using VMWare to build a free data mining system in R, as well as isolate your analytics system (thus using both Linux and Windows without overburdening your machine)

First Time

  1. http://downloads.vmware.com/d/info/desktop_end_user_computing/vmware_player/4_0Download and Install
  2. http://www.ubuntu.com/download/ubuntu/downloadDownload Only
  3. Create New Virtual Image in VM Ware Player
  4. Applications—–Terminal——sudo apt get-install R (to download and install)
  5.                                          sudo R (to open R)
  6. Once R is opened type this  —-install.packages(rattle)—– This will install rattle
  7. library(rattle) will load Rattle—–
  8. rattle() will open the GUI—-
Getting Data from Host to Guest VM
Next Time
  1. Go to VM Player
  2. Open the VM
  3. sudo R in terminal to bring up R
  4. library(rattle) within R
  5. rattle()
At this point even if you dont know any Linux and dont know any R, you can create data mining models using the Rattle GUI (and time series model using E pack in the R Commander GUI) – What can Rattle do in data mining? See this slideshow-http://www.decisionstats.com/data-mining-with-r-gui-rattle-rstats/
If Google Docs is banned as per your enterprise organizational IT policy of having Windows Explorer only- well you can see these screenshots http://rattle.togaware.com/rattle-screenshots.html

Data Mining with R GUI -Rattle #Rstats

Why is RATTLE my favorite R package?
because it allows data mining in a very nice interface.
Complicated software need not have complicated interfaces.
Have a look-

(Note- download rattle from http://rattle.togaware.com)

For better visibility please click the full screen button or click the second pps below- automatically advances every 5 secs

Knowledge Discovery in Databases -KDD using PostgreSQL and #Rstats

Here is a small brief primer for beginners on configuring an open source database and using an open source analytics package.

All you need to know – is to read!


1. download PostgreSQL from
http://www.postgresql.org/download/windowsInstall PostgreSQL

Remember to store /memorize the password for the user postgres!

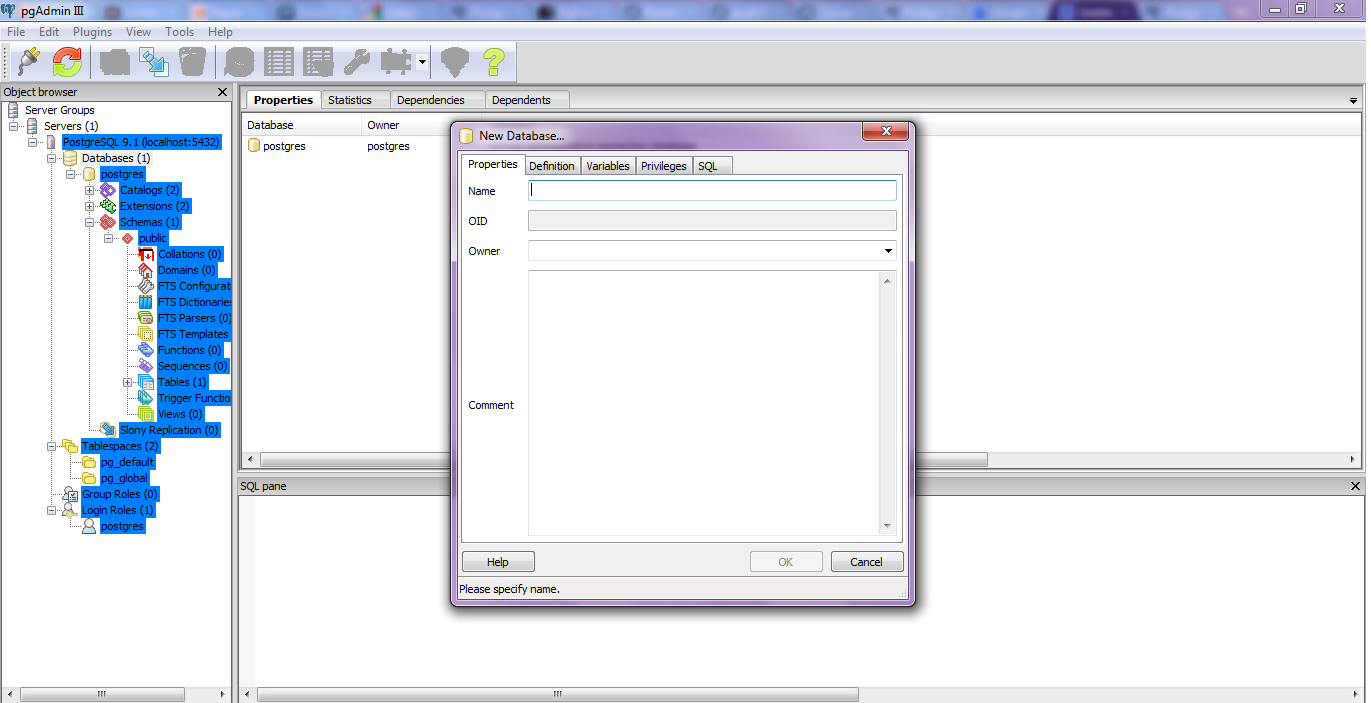
Create a connection using pgAdmin feature in Start Menu

2. download ODBC driver from
http://www.postgresql.org/ftp/odbc/versions/msi/
and the Win 64 edition from
http://wwwmaster.postgresql.org/download/mirrors-ftp/odbc/versions/msi/psqlodbc_09_00_0310-x64.zip

install ODBC driver

3. Go to

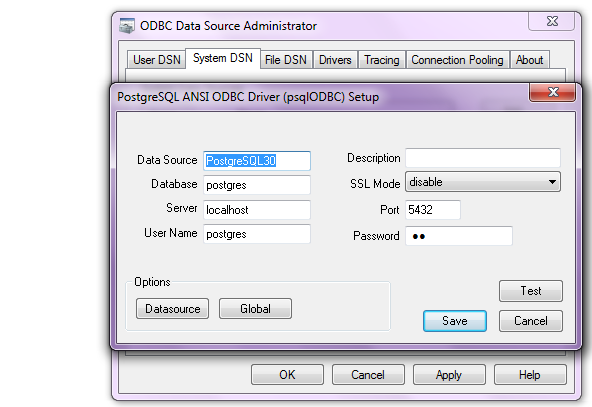
Start Menu\Control Panel\All Control Panel Items\Administrative Tools\Data Sources (ODBC)

4. Configure the following details in System DSN and  User DSN using the ADD tabs .Test connection to check if connection is working

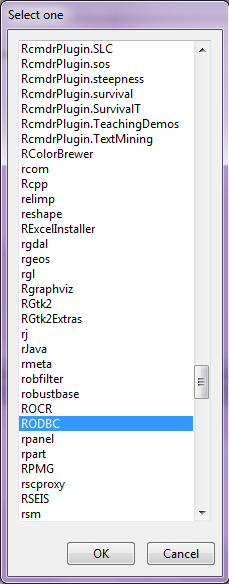
5. Start R and install and load library RODBC

6. Use following initial code for R- if you know SQL you can  do the rest
> library(RODBC)

> odbcDataSources(type = c(“all”, “user”, “system”))
SQLServer              PostgreSQL30             PostgreSQL35W
“SQL Server”    “PostgreSQL ANSI(x64)” “PostgreSQL Unicode(x64)”

> ajay=odbcConnect(“PostgreSQL30”, uid = “postgres”, pwd = “XX”)

> sqlTables(ajay)
TABLE_QUALIFIER TABLE_OWNER TABLE_NAME TABLE_TYPE REMARKS
1        postgres      public      names      TABLE

> crimedat <- sqlFetch(ajay, “names”)

How to make an analytics project?

Some of the process methodologies I have used and been exposed to while making analytics projects are-1) DMAIC/Six Sigma

While Six Sigma was initially a quality control system, it has also been very succesful in managing projects. The various stages of an analytical project can be divided using the DMAIC methodology.

DMAIC stands for

  • Define
  • Measure
  • Analyze
  • Improve
  • Control

Related to this is DMADV, ( “Design For Six Sigma”)

  • Define
  • Measure and identify CTQs
  • Analyze
  • Design
  • Verify

2) CRISP
CRISP-DM stands for Cross Industry Standard Process for Data Mining

CRISP-DM breaks the process of data mining into six major phases- and these can be used for business analytics projects as well.

  • Business Understanding
  • Data Understanding
  • Data Preparation
  • Modeling
  • Evaluation
  • Deployment

3) SEMMA
SEMMA  stands for

  • sample
  • explore
  • modify
  • model
  • assess

4) ISO 9001

ISO 9001 is a certification as well as a philosophy for making a Quality Management System to measure , reduce and eliminate error and customer complaints. Any customer complaint or followup has to be treated as an error, logged, and investigated for control.

5) LEAN
LEAN is a philosophy to eliminate Wastage in a process. Applying LEAN principles to analytics projects helps a lot in eliminating project bottlenecks, technology compatibility issues and data quality resolution. I think LEAN would be great in data quality issues, and IT infrastructure design because that is where the maximum waste is observed in analytics projects.

6) Demings Plan Do Check Act cycle.