AsterData partners with Tableau

This chart represents several constituent comp...
Image via Wikipedia

Tableau which has been making waves recntly with its great new data visualization tool announced a partner with my old friends at AsterData. Its really cool piece of data vis and very very fast on the desktop- so I can imagine what speed it can help with AsterData’s MPP Row and Column Zingbang AND Parallel Analytical Functions

Tableau and AsterData also share the common Stanfordian connection (but it seems software is divided quite equally between Stanford, Hardvard Dropouts and North Carolina )

It remains to be seen in this announcement how much each company  can leverage the partnership or whether it turns like the SAS Institute- AsterData partnership last year or whether it is just to announce connectors in their software to talk to each other.

See a Tableau vis at

http://public.tableausoftware.com/views/geographyofdiabetes/Dashboard2?:embed=yes&:toolbar=yes

AsterData remains the guys with the potential but I would be wrong to say MapReduce–SQL is as hot in December 2010 as it was in June 2009- and the elephant in the room would be Hadoop. That and Google’s continued shyness from encashing its principal comptency of handling Big Data (but hush – I signed a NDA with the Google Prediction API– so things maaaay change very rapidly on ahem that cloud)

Disclaimer- AsterData was my internship sponsor during my winter training while at Univ of  Tenn.


Data Visualization using Tableau

Image representing Tableau Software as depicte...
Image via CrunchBase

Here is a great piece of software for data visualization– the public version is free.

And you can use it for Desktop Analytics as well as BI /server versions at very low cost.

About Tableau Software–

http://www.tableausoftware.com/press_release/tableau-massive-growth-hiring-q3-2010

Tableau was named by Software Magazine as the fastest growing software company in the $10 million to $30 million range in the world, and the second fastest growing software company worldwide overall. The ranking stems from the publication’s 28th annual Software 500 ranking of the world’s largest software service providers.

“We’re growing fast because the market is starving for easy-to-use products that deliver rapid-fire business intelligence to everyone. Our customers want ways to unlock their databases and produce engaging reports and dashboards,” said Christian Chabot CEO and co-founder of Tableau.

http://www.tableausoftware.com/about/who-we-are

History in the Making

Put together an Academy-Award winning professor from the nation’s most prestigious university, a savvy business leader with a passion for data, and a brilliant computer scientist. Add in one of the most challenging problems in software – making databases and spreadsheets understandable to ordinary people. You have just recreated the fundamental ingredients for Tableau.

The catalyst? A Department of Defense (DOD) project aimed at increasing people’s ability to analyze information and brought to famed Stanford professor, Pat Hanrahan. A founding member of Pixar and later its chief architect for RenderMan, Pat invented the technology that changed the world of animated film. If you know Buzz and Woody of “Toy Story”, you have Pat to thank.

Under Pat’s leadership, a team of Stanford Ph.D.s got together just down the hall from the Google folks. Pat and Chris Stolte, the brilliant computer scientist, realized that data visualization could produce large gains in people’s ability to understand information. Rather than analyzing data in text form and then creating visualizations of those findings, Pat and Chris invented a technology called VizQL™ by which visualization is part of the journey and not just the destination. Fast analytics and visualization for everyone was born.

While satisfying the DOD project, Pat and Chris met Christian Chabot, a former data analyst who turned into Jello when he saw what had been invented. The three formed a company and spun out of Stanford like so many before them (Yahoo, Google, VMWare, SUN). With Christian on board as CEO, Tableau rapidly hit one success after another: its first customer (now Tableau’s VP, Operations, Tom Walker), an OEM deal with Hyperion (now Oracle), funding from New Enterprise Associates, a PC Magazine award for “Product of the Year” just one year after launch, and now over 50,000 people in 50+ countries benefiting from the breakthrough.

also see http://www.tableausoftware.com/about/leadership

http://www.tableausoftware.com/about/board

—————————————————————————-

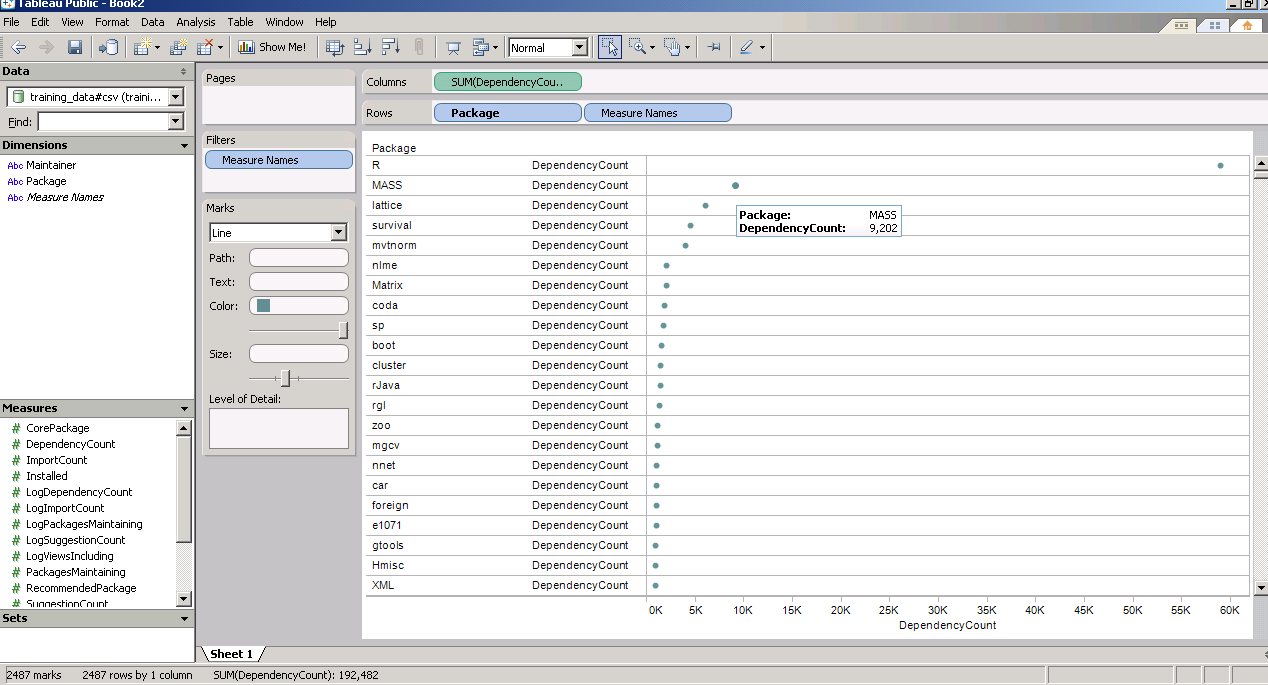
and now  a demo I ran on the Kaggle contest data (it is a csv dataset with 95000 rows)

I found Tableau works extremely good at pivoting data and visualizing it -almost like Excel on  Steroids. Download the free version here ( I dont know about an academic program (see links below) but software is not expensive at all)

http://buy.tableausoftware.com/

Desktop Personal Edition

The Personal Edition is a visual analysis and reporting solution for data stored in Excel, MS Access or Text Files. Available via download.

Product Information

$999*

Desktop Professional Edition

The Professional Edition is a visual analysis and reporting solution for data stored in MS SQL Server, MS Analysis Services, Oracle, IBM DB2, Netezza, Hyperion Essbase, Teradata, Vertica, MySQL, PostgreSQL, Firebird, Excel, MS Access or Text Files. Available via download.

Product Information

$1800*

Tableau Server

Tableau Server enables users of Tableau Desktop Professional to publish workbooks and visualizations to a server where users with web browsers can access and interact with the results. Available via download.

Product Information

Contact Us

* Price is per Named User and includes one year of maintenance (upgrades and support). Products are made available as a download immediately after purchase. You may revisit the download site at any time during your current maintenance period to access the latest releases.


Using Reshape2 for transposing datasets in R

Note Problem Statement-This is quite similar to using Proc Transpose using values in SAS. see http://analytics.ncsu.edu/sesug/2005/TU12_05.PDF
Diagram using geneplotter from R Graph Gallery
In R however this can be done as follow.
convert dataframe
Subject     Item      Score
1 Subject 1     Item 1     1
2 Subject 1     Item 2     0
3 Subject 1     Item 3     1
4 Subject 2     Item 1     1
5 Subject 2     Item 2     1
6 Subject 2      Item 3     0
to
Subject     Item 1 Item 2 Item 3 Item 4
1 Subject 1      1              0               1                 1
5 Subject 2      1              1                0                0
Note- I am using http://www.inside-r.org/pretty-r/tool for auto-generating the color coded R Code.
library("reshape2")
tDat.m<- melt(tDat)tDatCast<- acast(tDat.m,Subject~Item)
and that's it!
Another way (this one is  not recommended as it seems to take longer
 and more memory)
df.wide <- reshape(df, idvar="Subject", timevar="Item", direction="wide")

Using PostgreSQL and MySQL databases in R 2.12 for Windows

Air University Library's Index to Military Per...
Image via Wikipedia

If you use Windows for your stats computing and your data is in a database (probably true for almost all corporate business analysts) R 2.12 has provided a unique procedural hitch for you NO BINARIES for packages used till now to read from these databases.

The Readme notes of the release say-

Packages related to many database system must be linked to the exact
version of the database system the user has installed, hence it does
not make sense to provide binaries for packages
	RMySQL, ROracle, ROracleUI, RPostgreSQL
although it is possible to install such packages from sources by
	install.packages('packagename', type='source')
after reading the manual 'R Installation and Administration'.

So how to connect to Databases if the Windows Binary is not available-

So how to connect to PostgreSQL and MySQL databases.

For Postgres databases-

You can update your PostgreSQL databases here-

http://www.postgresql.org/download/windows

Fortunately the RpgSQL package is still available for PostgreSQL

  • Using the RpgSQL package

library(RpgSQL)

#creating a connection
con <- dbConnect(pgSQL(), user = "postgres", password = "XXXX",dbname="postgres")

#writing a table from a R Dataset
dbWriteTable(con, "BOD", BOD)

# table names are lower cased unless double quoted. Here we write a Select SQL query
dbGetQuery(con, 'select * from "BOD"')

#disconnecting the connection
dbDisconnect(con)

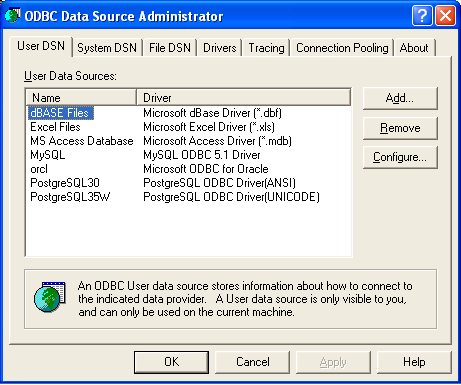
You can also use RODBC package for connecting to your PostgreSQL database but you need to configure your ODBC connections in

Windows Start Panel-

Settings-Control Panel-

Administrative Tools-Data Sources (ODBC)

You should probably see something like this screenshot.

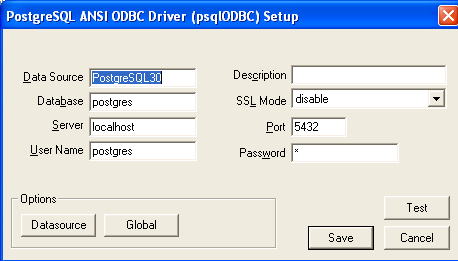
Coming back to R and noting the name of my PostgreSQL DSN from above screenshot-( If not there just click on add-scroll to appropriate database -here PostgreSQL and click on Finish- add in the default values for your database or your own created database values-see screenshot for help with other configuring- and remember to click Test below to check if username and password are working, port is correct etc.

so once the DSN is probably setup in the ODBC (frightening terminology is part of databases)- you can go to R to connect using RODBC package


#loading RODBC

library(RODBC)

#creating a Database connection
# for username,password,database name and DSN name

chan=odbcConnect("PostgreSQL35W","postgres;Password=X;Database=postgres")

#to list all table names

sqlTables(chan)

TABLE_QUALIFIER TABLE_OWNER TABLE_NAME TABLE_TYPE REMARKS
1       postgres      public        bod      TABLE      
 2        postgres      public  database1      TABLE      
 3        postgres      public         tt      TABLE

Now for MySQL databases it is exactly the same code except we download and install the ODBC driver from http://www.mysql.com/downloads/connector/odbc/

and then we run the same configuring DSN as we did for postgreSQL.

After that we use RODBC in pretty much the same way except changing for the default username and password for MySQL and changing the DSN name for the previous step.

channel <- odbcConnect("mysql","jasperdb;Password=XXX;Database=Test")
test2=sqlQuery(channel,"select * from jiuser")
test2
 id  username tenantId   fullname emailAddress  password externallyDefined enabled previousPasswordChangeTime1  1   jasperadmin        1 Jasper Administrator           NA 349AFAADD5C5A2BD477309618DC              NA    01                       
2  2       joe1ser        1             Joe User           NA                 4DD8128D07A               NA    01
odbcClose(channel)
While using RODBC for all databases is a welcome step, perhaps the change release notes for Window Users of R may need to be more substantiative than one given for R 2.12.2

Which software do we buy? -It depends

Software (novel)
Image via Wikipedia

Often I am asked by clients, friends and industry colleagues on the suitability or unsuitability of particular software for analytical needs.  My answer is mostly-

It depends on-

1) Cost of Type 1 error in purchase decision versus Type 2 error in Purchase Decision. (forgive me if I mix up Type 1 with Type 2 error- I do have some weird childhood learning disabilities which crop up now and then)

Here I define Type 1 error as paying more for a software when there were equivalent functionalities available at lower price, or buying components you do need , like SPSS Trends (when only SPSS Base is required) or SAS ETS, when only SAS/Stat would do.

The first kind is of course due to the presence of free tools with GUI like R, R Commander and Deducer (Rattle does have a 500$ commercial version).

The emergence of software vendors like WPS (for SAS language aficionados) which offer similar functionality as Base SAS, as well as the increasing convergence of business analytics (read predictive analytics), business intelligence (read reporting) has led to somewhat brand clutter in which all softwares promise to do everything at all different prices- though they all have specific strengths and weakness. To add to this, there are comparatively fewer business analytics independent analysts than say independent business intelligence analysts.

2) Type 2 Error- In this case the opportunity cost of delayed projects, business models , or lower accuracy – consequences of buying a lower priced software which had lesser functionality than you required.

To compound the magnitude of error 2, you are probably in some kind of vendor lock-in, your software budget is over because of buying too much or inappropriate software and hardware, and still you could do with some added help in business analytics. The fear of making a business critical error is a substantial reason why open source software have to work harder at proving them competent. This is because writing great software is not enough, we need great marketing to sell it, and great customer support to sustain it.

As Business Decisions are decisions made in the constraints of time, information and money- I will try to create a software purchase matrix based on my knowledge of known softwares (and unknown strengths and weakness), pricing (versus budgets), and ranges of data handling. I will add in basically an optimum approach based on known constraints, and add in flexibility for unknown operational constraints.

I will restrain this matrix to analytics software, though you could certainly extend it to other classes of enterprise software including big data databases, infrastructure and computing.

Noted Assumptions- 1) I am vendor neutral and do not suffer from subjective bias or affection for particular software (based on conferences, books, relationships,consulting etc)

2) All software have bugs so all need customer support.

3) All software have particular advantages , strengths and weakness in terms of functionality.

4) Cost includes total cost of ownership and opportunity cost of business analytics enabled decision.

5) All software marketing people will praise their own software- sometimes over-selling and mis-selling product bundles.

Software compared are SPSS, KXEN, R,SAS, WPS, Revolution R, SQL Server,  and various flavors and sub components within this. Optimized approach will include parallel programming, cloud computing, hardware costs, and dependent software costs.

To be continued-


Libre Office

Some ambiguity about Libre Office and why it needed to change from Open Office- just when Open Office seemed so threatening on the desktop

FROM- http://www.documentfoundation.org/faq/

Q: So is this a breakaway project?

A: Not at all. The Document Foundation will continue to be focused on developing, supporting, and promoting the same software, and it’s very much business as usual. We are simply moving to a new and more appropriate organisational model for the next decade – a logical development from Sun’s inspirational launch a decade ago.

Q: Why are you calling yourselves “The Document Foundation”?

A: For ten years we have used the same name – “OpenOffice.org” – for both the Community and the software. We’ve decided it removes ambiguity to have a different name for the two, so the Community is now “The Document Foundation”, and the software “LibreOffice”. Note: there are other examples of this usage in the free software community – e.g. the Mozilla Foundation with the Firefox browser.

Q: Does this mean you intend to develop other pieces of software?

A: We would like to have that possibility open to us in the future…

Q: And why are you calling the software “LibreOffice” instead of “OpenOffice.org”?

A: The OpenOffice.org trademark is owned by Oracle Corporation. Our hope is that Oracle will donate this to the Foundation, along with the other assets it holds in trust for the Community, in due course, once legal etc issues are resolved. However, we need to continue work in the meantime – hence “LibreOffice” (“free office”).

Q: Why are you building a new web infrastructure?

A: Since Oracle’s takeover of Sun Microsystems, the Community has been under “notice to quit” from our previous Collabnet infrastructure. With today’s announcement of a Foundation, we now have an entity which can own our emerging new infrastructure.

Q: What does this announcement mean to other derivatives of OpenOffice.org?

A: We want The Document Foundation to be open to code contributions from as many people as possible. We are delighted to announce that the enhancements produced by the Go-OOo team will be merged into LibreOffice, effective immediately. We hope that others will follow suit.

Q: What difference will this make to the commercial products produced by Oracle Corporation, IBM, Novell, Red Flag, etc?

A: The Document Foundation cannot answer for other bodies. However, there is nothing in the licence arrangements to stop companies continuing to release commercial derivatives of LibreOffice. The new Foundation will also mean companies can contribute funds or resources without worries that they may be helping a commercial competitor.

Q: What difference will The Document Foundation make to developers?

A: The Document Foundation sets out deliberately to be as developer friendly as possible. We do not demand that contributors share their copyright with us. People will gain status in our community based on peer evaluation of their contributions – not by who their employer is.

Q: What difference will The Document Foundation make to users of LibreOffice?

A: LibreOffice is The Document Foundation’s reason for existence. We do not have and will not have a commercial product which receives preferential treatment. We only have one focus – delivering the best free office suite for our users – LibreOffice.

—————————————————————————————————-

Non Microsoft and Non Oracle vendors are indeed going to find it useful the possiblities of bundling a free Libre Office that reduces the total cost of ownership for analytics software. Right now, some of the best free advertising for Microsoft OS and Office is done by enterprise software vendors who create Windows Only Products and enable MS Office integration better than  Open Office integration. This is done citing user demand- but it is a chicken egg dilemma- as functionality leads to enhanced demand. Microsoft on the other hand is aware of this dependence and has made SQL Server and SQL Analytics (besides investing in analytics startups like Revolution Analytics) along with it’s own infrastructure -Azure Cloud Platform/EC2 instances.

Interesting Interview with Quentin G,AsterData

Here is an interesting interview with Quentin G, CEO AsterData, Marketing trumpeting aside apart-the insights on the whats next vision thing are quite good.

Sourcehttp://www.arnoldit.com/search-wizards-speak/aster-data.html

As you look down the road, what are the three major challenges you see for vendors who keep trying to solve big data and other “now” problems with old tools?

Old tools and traditional architectures cannot scale effectively to handle massive data volumes that reach 100’s of terabytes nor can they effectively process large data volumes in a high performance manner. Further, they are restricted to what SQL querying allows. The three challenges I have noted are:

First, performance, specifically, poor performance on large data volumes and heavy workloads: The pre-existing systems rely on storing data in a traditional DBMS or data warehouse and then extracting a sample of data to a separate processing tier. This greatly restricts data insights and analytics as only a sample of data is analyzed and understood.  As more data is stored in these systems they suffer from performance degradation as more users try to access the system concurrently. Additionally moving masses of data out of the traditional DBMS to a separate processing tier adds latency and slows down analytics and response times. This pre-existing architecture greatly limits performance especially as data sizes grow.

Second, limited analytics: Pre-existing systems rely mostly on SQL for data querying and analysis. SQL poses several limitations and is not suited for ad hoc querying, deep data exploration and a range of other analytics. MapReduce overcomes the limitations of SQL and SQL-MapReduce in particular opens up a new class of analytics that cannot be achieved with SQL alone.

And, third, limitations of types of data that can be stored and analyzed: Traditional systems are not designed for non-relational or unstructured data. New solutions such as Aster Data’s are designed from the ground up to handle both relational and non-relational data. Organizations want to store and process a range of data types and do this in a single platform. New solutions allow for different data types to be handled in a single platform whereas pre-existing architectures and solutions are specialized around a single data type or format – this restricts the diversity of analytics that can be performed on these systems.

Read the whole interview at –http://www.arnoldit.com/search-wizards-speak/aster-data.html

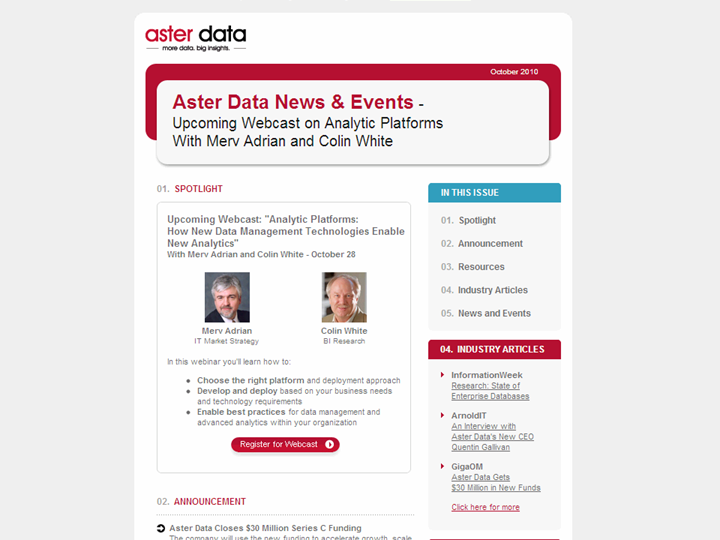
Speaking of which- there is a new webinar by Merv Adrian (interview on Decisionstats) and Colin White-


http://now.eloqua.com/es.asp?s=1015&e=1862&elq=9ec9b73872e849b88d2943cca920acda

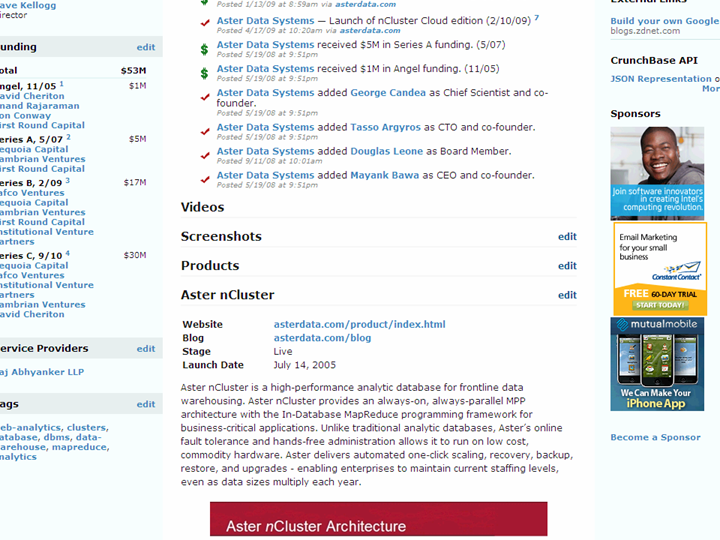
and from the famous AOL website- a profile of AsterData’s money flow which kind of hints at an IPO two years onwards-

http://www.crunchbase.com/company/aster-data-systems