iTunes finally gets some competition ?- Amazon Cloud Player


An interesting development is Amazon’s Cloud Player (though Cannonical may be credited for thinking of the idea first for Ubuntu One). Since Ubuntu One is dependent on the OS (and not the browser) this makes Amazon \s version more of a  mobile Cloud Player (as it seems to be an Android app and not an app that is independent of any platform, os or browser.

Since Android and Ubuntu are both Linux flavors, I am not sure if Cannonical has an exiting mobile app for Ubuntu One. Apple’s cloud plans also seems kind of ambiguous compared to Microsoft (Azure et al)

I guess we will have to wait for a true Cloud player.


http://www.amazon.com/b/ref=tsm_1_tw_s_dm_liujd5?node=2658409011&tag=cloudplayer-20

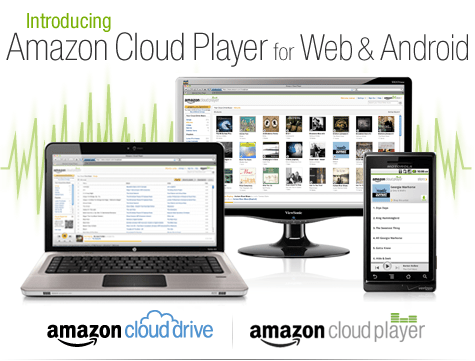
How to Get Started with Cloud Drive and Cloud Player


Step 1. Add music to Cloud Drive

Purchase a song or album from the Amazon MP3 Store and click the Save to Amazon Cloud Drive button when your purchase is complete. Your purchase will be saved for free.


Step 2. Play your music in Cloud Player for Web

Click the Launch Amazon Cloud Player button to start listening to your purchase. Add more music from your library by clicking theUpload to Cloud Drive button from the Cloud Player screen. Start with 5 GB of free Cloud Drive storage. Upgrade to 20 GB with an MP3 album purchase (see details). Use Cloud Player to browse and search your library, create playlists, and download to your computer.


Step 3. Enjoy your music on the go with Cloud Player for Android

Install the Amazon MP3 for Android app to use Cloud Player on your Android device. Shop the full Amazon MP3 store, save your purchases to Cloud Drive, stream your Cloud Player library, and download to your device right from your Android phone or tablet.

compare this with

https://one.ubuntu.com/music/

A cloud-enabled music store

The Ubuntu One Music Store is integrated with the Ubuntu One service making it a cloud-enabled digital music store. All purchases are transferred to your Ubuntu One personal cloud for safe storage and then conveniently downloaded to your synchronizing computers. And don’t worry aboutgoing over your storage quota with music purchases. You won’t need to pay more for personal cloud storage of music purchased from the Ubuntu One Music Store.

An Ubuntu One subscription is required to purchase music from the Ubuntu One Music Store. Choose from either the free 2 GB option or the 50 GB plan for $10 (USD) per month to synchronize more of your digital life.

5 regional stores and more in the works

  • The Ubuntu One Music requires Ubuntu 10.04 LTS and offers digital music through five regional stores.
  • The US, UK, and Germany stores offer music from all major and independent labels.
  • The EU store serves most of the EU member countries (2) and offers music from fewer major label artists.
  • The World store offers only independent label music and serves the countries not covered by the other regional stores.


Top Ten Graphs for Business Analytics -Pie Charts (1/10)

I have not been really posting or writing worthwhile on the website for some time, as I am still busy writing ” R for Business Analytics” which I hope to get out before year end. However while doing research for that, I came across many types of graphs and what struck me is the actual usage of some kinds of graphs is very different in business analytics as compared to statistical computing.

The criterion of top ten graphs is as follows-

1) Usage-The order in which they appear is not strictly in terms of desirability but actual frequency of usage. So a frequently used graph like box plot would be recommended above say a violin plot.

2) Adequacy- Data Visualization paradigms change over time- but the need for accurate conveying of maximum information in a minium space without overwhelming reader or misleading data perceptions.

3) Ease of creation- A simpler graph created by a single function is more preferrable to writing 4-5 lines of code to create an elaborate graph.

4) Aesthetics– Aesthetics is relative and  in addition studies have shown visual perception varies across cultures and geographies. However , beauty is universally appreciated and a pretty graph is sometimes and often preferred over a not so pretty graph. Here being pretty is in both visual appeal without compromising perceptual inference from graphical analysis.


so When do we use a bar chart versus a line graph versus a pie chart? When is a mosaic plot more handy and when should histograms be used with density plots? The list tries to capture most of these practicalities.

Let me elaborate on some specific graphs-

1) Pie Chart- While Pie Chart is not really used much in stats computing, and indeed it is considered a misleading example of data visualization especially the skewed or two dimensional charts. However when it comes to evaluating market share at a particular instance, a pie chart is simple to understand. At the most two pie charts are needed for comparing two different snapshots, but three or more pie charts on same data at different points of time is definitely a bad case.

In R you can create piechart, by just using pie(dataset$variable)

As per official documentation, pie charts are not  recommended at all.

http://stat.ethz.ch/R-manual/R-patched/library/graphics/html/pie.html

Pie charts are a very bad way of displaying information. The eye is good at judging linear measures and bad at judging relative areas. A bar chart or dot chart is a preferable way of displaying this type of data.

Cleveland (1985), page 264: “Data that can be shown by pie charts always can be shown by a dot chart. This means that judgements of position along a common scale can be made instead of the less accurate angle judgements.” This statement is based on the empirical investigations of Cleveland and McGill as well as investigations by perceptual psychologists.

—-

Despite this, pie charts are frequently used as an important metric they inevitably convey is market share. Market share remains an important analytical metric for business.

The pie3D( ) function in the plotrix package provides 3D exploded pie charts.An exploded pie chart remains a very commonly used (or misused) chart.

From http://lilt.ilstu.edu/jpda/charts/chart%20tips/Chartstip%202.htm#Rules

we see some rules for using Pie charts.


  1. Avoid using pie charts.
  2. Use pie charts only for data that add up to some meaningful total.
  3. Never ever use three-dimensional pie charts; they are even worse than two-dimensional pies.
  4. Avoid forcing comparisons across more than one pie chart


From the R Graph Gallery (a slightly outdated but still very comprehensive graphical repository)

http://addictedtor.free.fr/graphiques/RGraphGallery.php?graph=4

par(bg="gray")
pie(rep(1,24), col=rainbow(24), radius=0.9)
title(main="Color Wheel", cex.main=1.4, font.main=3)
title(xlab="(test)", cex.lab=0.8, font.lab=3)
(Note adding a grey background is quite easy in the basic graphics device as well without using an advanced graphical package)


Using Views in R and comparing functions across multiple packages

Some RDF hacking relating to updating probabil...
Image via Wikipedia

R has almost 2923 available packages

This makes the task of searching among these packages and comparing functions for the same analytical task across different packages a bit tedious and prone to manual searching (of reading multiple Pdfs of help /vignette of packages) or sending an email to the R help list.

However using R Views is a slightly better way of managing all your analytical requirements for software rather than the large number of packages (see Graphics view below).

CRAN Task Views allow you to browse packages by topic and provide tools to automatically install all packages for special areas of interest. Currently, 28 views are available. http://cran.r-project.org/web/views/

Bayesian Bayesian Inference
ChemPhys Chemometrics and Computational Physics
ClinicalTrials Clinical Trial Design, Monitoring, and Analysis
Cluster Cluster Analysis & Finite Mixture Models
Distributions Probability Distributions
Econometrics Computational Econometrics
Environmetrics Analysis of Ecological and Environmental Data
ExperimentalDesign Design of Experiments (DoE) & Analysis of Experimental Data
Finance Empirical Finance
Genetics Statistical Genetics
Graphics Graphic Displays & Dynamic Graphics & Graphic Devices & Visualization
gR gRaphical Models in R
HighPerformanceComputing High-Performance and Parallel Computing with R
MachineLearning Machine Learning & Statistical Learning
MedicalImaging Medical Image Analysis
Multivariate Multivariate Statistics
NaturalLanguageProcessing Natural Language Processing
OfficialStatistics Official Statistics & Survey Methodology
Optimization Optimization and Mathematical Programming
Pharmacokinetics Analysis of Pharmacokinetic Data
Phylogenetics Phylogenetics, Especially Comparative Methods
Psychometrics Psychometric Models and Methods
ReproducibleResearch Reproducible Research
Robust Robust Statistical Methods
SocialSciences Statistics for the Social Sciences
Spatial Analysis of Spatial Data
Survival Survival Analysis
TimeSeries Time Series Analysis

To automatically install these views, the ctv package needs to be installed, e.g., via

install.packages("ctv")
library("ctv")
Created by Pretty R at inside-R.org


and then the views can be installed via install.views or update.views (which first assesses which of the packages are already installed and up-to-date), e.g.,

install.views("Econometrics")
 update.views("Econometrics")
 Created by Pretty R at inside-R.org

CRAN Task View: Graphic Displays & Dynamic Graphics & Graphic Devices & Visualization

Maintainer: Nicholas Lewin-Koh
Contact: nikko at hailmail.net
Version: 2009-10-28

R is rich with facilities for creating and developing interesting graphics. Base R contains functionality for many plot types including coplots, mosaic plots, biplots, and the list goes on. There are devices such as postscript, png, jpeg and pdf for outputting graphics as well as device drivers for all platforms running R. lattice and grid are supplied with R’s recommended packages and are included in every binary distribution. lattice is an R implementation of William Cleveland’s trellis graphics, while grid defines a much more flexible graphics environment than the base R graphics.

R’s base graphics are implemented in the same way as in the S3 system developed by Becker, Chambers, and Wilks. There is a static device, which is treated as a static canvas and objects are drawn on the device through R plotting commands. The device has a set of global parameters such as margins and layouts which can be manipulated by the user using par() commands. The R graphics engine does not maintain a user visible graphics list, and there is no system of double buffering, so objects cannot be easily edited without redrawing a whole plot. This situation may change in R 2.7.x, where developers are working on double buffering for R devices. Even so, the base R graphics can produce many plots with extremely fine graphics in many specialized instances.

One can quickly run into trouble with R’s base graphic system if one wants to design complex layouts where scaling is maintained properly on resizing, nested graphs are desired or more interactivity is needed. grid was designed by Paul Murrell to overcome some of these limitations and as a result packages like latticeggplot2vcd or hexbin (on Bioconductor ) use grid for the underlying primitives. When using plots designed with grid one needs to keep in mind that grid is based on a system of viewports and graphic objects. To add objects one needs to use grid commands, e.g., grid.polygon() rather than polygon(). Also grid maintains a stack of viewports from the device and one needs to make sure the desired viewport is at the top of the stack. There is a great deal of explanatory documentation included with grid as vignettes.

The graphics packages in R can be organized roughly into the following topics, which range from the more user oriented at the top to the more developer oriented at the bottom. The categories are not mutually exclusive but are for the convenience of presentation:

  • Plotting : Enhancements for specialized plots can be found in plotrix, for polar plotting, vcd for categorical data, hexbin (on Bioconductor ) for hexagon binning, gclus for ordering plots and gplots for some plotting enhancements. Some specialized graphs, like Chernoff faces are implemented in aplpack, which also has a nice implementation of Tukey’s bag plot. For 3D plots latticescatterplot3d and misc3d provide a selection of plots for different kinds of 3D plotting. scatterplot3d is based on R’s base graphics system, while misc3d is based on rgl. The package onion for visualizing quaternions and octonions is well suited to display 3D graphics based on derived meshes.
  • Graphic Applications : This area is not much different from the plotting section except that these packages have tools that may not for display, but can aid in creating effective displays. Also included are packages with more esoteric plotting methods. For specific subject areas, like maps, or clustering the excellent task views contributed by other dedicated useRs is an excellent place to start.
    • Effect ordering : The gclus package focuses on the ordering of graphs to accentuate cluster structure or natural ordering in the data. While not for graphics directly cba and seriation have functions for creating 1 dimensional orderings from higher dimensional criteria. For ordering an array of displays, biclust can be useful.
    • Large Data Sets : Large data sets can present very different challenges from moderate and small datasets. Aside from overplotting, rendering 1,000,000 points can tax even modern GPU’s. For univariate datalvplot produces letter value boxplots which alleviate some of the problems that standard boxplots exhibit for large data sets. For bivariate data ash can produce a bivariate smoothed histogram very quickly, and hexbin, on Bioconductor , can bin bivariate data onto a hexagonal lattice, the advantage being that the irregular lines and orientation of hexagons do not create linear artifacts. For multivariate data, hexbin can be used to create a scatterplot matrix, combined with lattice. An alternative is to use scagnostics to produce a scaterplot matrix of “data about the data”, and look for interesting combinations of variables.
    • Trees and Graphs ape and ade4 have functions for plotting phylogenetic trees, which can be used for plotting dendrograms from clustering procedures. While these packages produce decent graphics, they do not use sophisticated algorithms for node placement, so may not be useful for very large trees. igraph has the Tilford-Rheingold algorithm implementead and is useful for plotting larger trees. diagram as facilities for flow diagrams and simple graphs. For more sophisticated graphs Rgraphviz and igraph have functions for plotting and layout, especially useful for representing large networks.
  • Graphics Systems lattice is built on top of the grid graphics system and is an R implementation of William Cleveland’s trellis system for S-PLUS. lattice allows for building many types of plots with sophisticated layouts based on conditioning. ggplot2 is an R implementation of the system described in “A Grammar of Graphics” by Leland Wilkinson. Like latticeggplot (also built on top of grid) assists in trellis-like graphics, but allows for much more. Since it is built on the idea of a semantics for graphics there is much more emphasis on reshaping data, transformation, and assembling the elements of a plot.
  • Devices : Whereas grid is built on top of the R graphics engine, many in the R community have found the R graphics engine somewhat inflexible and have written separate device drivers that either emphasize interactivity or plotting in various graphics formats. R base supplies devices for PostScript, PDF, JPEG and other formats. Devices on CRAN include cairoDevice which is a device based libcairo, which can actually render to many device types. The cairo device is desgned to work with RGTK2, which is an interface to the Gimp Tool Kit, similar to pyGTK2. GDD provides device drivers for several bitmap formats, including GIF and BMP. RSvgDevice is an SVG device driver and interfaces well with with vector drawing programs, or R web development packages, such as Rpad. When SVG devices are for web display developers should be aware that internet explorer does not support SVG, but has their own standard. Trust Microsoft. rgl provides a device driver based on OpenGL, and is good for 3D and interactive development. Lastly, the Augsburg group supplies a set of packages that includes a Java-based device, JavaGD.
  • Colors : The package colorspace provides a set of functions for transforming between color spaces and mixcolor() for mixing colors within a color space. Based on the HCL colors provided in colorspacevcdprovides a set of functions for choosing color palettes suitable for coding categorical variables ( rainbow_hcl()) and numerical information ( sequential_hcl()diverge_hcl()). Similar types of palettes are provided in RColorBrewer and dichromat is focused on palettes for color-impaired viewers.
  • Interactive Graphics : There are several efforts to implement interactive graphics systems that interface well with R. In an interactive system the user can interactively query the graphics on the screen with the mouse, or a moveable brush to zoom, pan and query on the device as well as link with other views of the data. rggobi embeds the GGobi interactive graphics system within R, so that one can display a data frame or several in GGobi directly from R. The package has functions to support longitudinal data, and graphs using GGobi’s edge set functionality. The RoSuDA repository maintained and developed by the University of Augsburg group has two packages, iplots and iwidgets as well as their Java development environment including a Java device, JavaGD. Their interactive graphics tools contain functions for alpha blending, which produces darker shading around areas with more data. This is exceptionally useful for parallel coordinate plots where many lines can quickly obscure patterns. playwith has facilities for building interactive versions of R graphics using the cairoDevice and RGtk2. Lastly, the rgl package has mechanisms for interactive manipulation of plots, especially 3D rotations and surfaces.
  • Development : For development of specialized graphics packages in R, grid should probably be the first consideration for any new plot type. rgl has better tools for 3D graphics, since the device is interactive, though it can be slow. An alternative is to use Java and the Java device in the RoSuDA packages, though Java has its own drawbacks. For porting plotting code to grid, using the package gridBase presents a nice intermediate step to embed base graphics in grid graphics and vice versa.

It's a code code summer

East-German pupils ("Junge Pioniere"...
Image via Wikipedia

and soc is back!

also expecting some #Rstats entries (open source!)

from https://code.google.com/soc/

Google Summer of Code 2011

Visit the Google Summer of Code 2011 site for more details about the program this year.

For a detailed timeline and further information about the program, review our Frequently Asked Questions.

About Google Summer of Code

Google Summer of Code is a global program that offers student developers stipends to write code for various open source software projects. We have worked with several open source, free software, and technology-related groups to identify and fund several projects over a three month period. Since its inception in 2005, the program has brought together over 4500 successful student participants and over 3000 mentors from over 100 countries worldwide, all for the love of code. Through Google Summer of Code, accepted student applicants are paired with a mentor or mentors from the participating projects, thus gaining exposure to real-world software development scenarios and the opportunity for employment in areas related to their academic pursuits. In turn, the participating projects are able to more easily identify and bring in new developers. Best of all, more source code is created and released for the use and benefit of all.

To learn more about the program, peruse our 2011 Frequently Asked Questions page. You can also subscribe to the Google Open Source Blog or the Google Summer of Code Discussion Group to keep abreast of the latest announcements.

Participating in Google Summer of Code

For those of you who would like to participate in the program, there are many resources available for you to learn more. Check out the information pages from the 20052006200720082009, and 2010 instances of the program to get a better sense of which projects have participated as mentoring organizations in Google Summer of Code each year. If you are interested in a particular mentoring organization, just click on its name and you’ll find more information about the project, a summary of their students’ work and actual source code produced by student participants. You may also find the program Frequently Asked Questions (FAQs) pages for each year to be useful. Finally, check out all the great content and advice on participation produced by the community, for the community, on our program wiki.

If you don’t find what you need in the documentation, you can always ask questions on our program discussion list or the program IRC channel, #gsoc on Freenode.


The Mommy Track

Wage_labour
Image via Wikipedia

A new paper quantitatively analyzes the impact of child bearing on women. Summary-

Women [who score in the upper third on a standardized test] have a net 8 percent reduction in pay during the first five years after giving birth

From http://papers.nber.org/papers/w16582

Having a child lowers a woman’s lifetime earnings, but how much depends upon her skill level. In The Mommy Track Divides: The Impact of Childbearing on Wages of Women of Differing Skill Levels (NBER Working Paper No. 16582), co-authors Elizabeth Ty Wilde, Lily Batchelder, and David Ellwood estimate that having a child costs the average high skilled woman $230,000 in lost lifetime wages relative to similar women who never gave birth. By comparison, low skilled women experience a lifetime wage loss of only $49,000.

Using the 1979 National Longitudinal Survey of Youth (NLSY), Wilde et. al. divided women into high, medium, and low skill categories based on their Armed Forces Qualification Test (AFQT) scores. The authors use these skill categories, combined with earnings, labor force participation, and family formation data, to chart the labor market progress of women before and after childbirth, from ages 14-to-21 in 1979 through 41-to-49 in 2006, this study’s final sample year.

High scoring and low scoring women differed in a number of ways. While 70-75 percent of higher scoring women work full-time all year prior to their first birth, only 55-60 percent of low scoring women do. As they age, the high scoring women enjoy steeper wage growth than low scoring women; low scoring women’s wages do not change much if they reenter the labor market after they have their first child. Five years after the first birth, about 35 percent of each group is working full-time. However, the high scoring women who are not working full-time are more likely to be working part-time than the low scoring women, who are more likely to leave the workforce entirely.

and

Men’s earning profiles are relatively unaffected by having children although men who never have children earn less on average than those who do. High scoring women who have children late also tend to earn more than high scoring childless women. Their earnings advantage occurs before they have children and narrows substantially after they become mothers.

What to do if you see a possible GPL violation

GNU Lesser General Public License
Image via Wikipedia

Well I have played with software (mostly but not exclusively) analytical, and I admire the zeal and energy of both open source and closed source practioners- all having relatively decent people executing strategies their investors or owners tell them to do (closed source) or motivated by their own self sense of cool-change the world-openness (open source)

What I dont get is people stealing open source code- repackaging without adding major contributions- claiming patent pending stuff- and basically making money by creating CLOSED source from the open source software-(as open source is yet to break the enterprise glass cieling)

you are either open source or you arent.

bi- sexuality is okay. bi-codability is not.

Next time you see someone stealing some community’s open source code- refer to this excellent link.


But, we cannot act on our own if we do not hold copyright. Thus, be sure to find out who the copyright holders of the software are before reporting a violation.

http://www.gnu.org/licenses/gpl-violation.html

Violations of the GNU Licenses

If you think you see a violation of the GNU GPLLGPLAGPL, or FDL, the first thing you should do is double-check the facts:

  • Does the distribution contain a copy of the License?
  • Does it clearly state which software is covered by the License? Does it say anything misleading, perhaps giving the impression that something is covered by the License when in fact it is not?
  • Is source code included in the distribution?
  • Is a written offer for source code included with a distribution of just binaries?
  • Is the available source code complete, or is it designed for linking in other non-free modules?

If there seems to be a real violation, the next thing you need to do is record the details carefully:

  • the precise name of the product
  • the name of the person or organization distributing it
  • email addresses, postal addresses and phone numbers for how to contact the distributor(s)
  • the exact name of the package whose license is violated
  • how the license was violated:
    • Is the copyright notice of the copyright holder included?
    • Is the source code completely missing?
    • Is there a written offer for source that’s incomplete in some way? This could happen if it provides a contact address or network URL that’s somehow incorrect.
    • Is there a copy of the license included in the distribution?
    • Is some of the source available, but not all? If so, what parts are missing?

The more of these details that you have, the easier it is for the copyright holder to pursue the matter.

Once you have collected the details, you should send a precise report to the copyright holder of the packages that are being misused. The copyright holder is the one who is legally authorized to take action to enforce the license.

If the copyright holder is the Free Software Foundation, please send the report to <license-violation@gnu.org>. It’s important that we be able to write back to you to get more information about the violation or product. So, if you use an anonymous remailer, please provide a return path of some sort. If you’d like to encrypt your correspondence, just send a brief mail saying so, and we’ll make appropriate arrangements.

Note that the GPL, and other copyleft licenses, are copyright licenses. This means that only the copyright holders are empowered to act against violations. The FSF acts on all GPL violations reported on FSF copyrighted code, and we offer assistance to any other copyright holder who wishes to do the same.

But, we cannot act on our own if we do not hold copyright. Thus, be sure to find out who the copyright holders of the software are before reporting a violation.


Google Snappy

Diagram of how a 32-bit integer is arranged in...
Image via Wikipedia

a cool sounding software- yet again by the guys from California, this one enables to zip and unzip Big Data much much faster

http://news.ycombinator.com/item?id=2356735

and

https://code.google.com/p/snappy/

Snappy is a compression/decompression library. It does not aim for maximum compression, or compatibility with any other compression library; instead, it aims for very high speeds and reasonable compression. For instance, compared to the fastest mode of zlib, Snappy is an order of magnitude faster for most inputs, but the resulting compressed files are anywhere from 20% to 100% bigger. On a single core of a Core i7 processor in 64-bit mode, Snappy compresses at about 250 MB/sec or more and decompresses at about 500 MB/sec or more.

Snappy is widely used inside Google, in everything from BigTable and MapReduce to our internal RPC systems. (Snappy has previously been referred to as “Zippy” in some presentations and the likes.)

For more information, please see the README. Benchmarks against a few other compression libraries (zlib, LZO, LZF, FastLZ, and QuickLZ) are included in the source code distribution.

Introduction
============
Snappy is a compression/decompression library. It does not aim for maximum
compression, or compatibility with any other compression library; instead,
it aims for very high speeds and reasonable compression. For instance,
compared to the fastest mode of zlib, Snappy is an order of magnitude faster
for most inputs, but the resulting compressed files are anywhere from 20% to
100% bigger. (For more information, see “Performance”, below.)
Snappy has the following properties:
* Fast: Compression speeds at 250 MB/sec and beyond, with no assembler code.
See “Performance” below.
* Stable: Over the last few years, Snappy has compressed and decompressed
petabytes of data in Google’s production environment. The Snappy bitstream
format is stable and will not change between versions.
* Robust: The Snappy decompressor is designed not to crash in the face of
corrupted or malicious input.
* Free and open source software: Snappy is licensed under the Apache license,
version 2.0. For more information, see the included COPYING file.
Snappy has previously been called “Zippy” in some Google presentations
and the like.
Performance
===========
Snappy is intended to be fast. On a single core of a Core i7 processor
in 64-bit mode, it compresses at about 250 MB/sec or more and decompresses at
about 500 MB/sec or more. (These numbers are for the slowest inputs in our
benchmark suite; others are much faster.) In our tests, Snappy usually
is faster than algorithms in the same class (e.g. LZO, LZF, FastLZ, QuickLZ,
etc.) while achieving comparable compression ratios.
Typical compression ratios (based on the benchmark suite) are about 1.5-1.7x
for plain text, about 2-4x for HTML, and of course 1.0x for JPEGs, PNGs and
other already-compressed data. Similar numbers for zlib in its fastest mode
are 2.6-2.8x, 3-7x and 1.0x, respectively. More sophisticated algorithms are
capable of achieving yet higher compression rates, although usually at the
expense of speed. Of course, compression ratio will vary significantly with
the input.
Although Snappy should be fairly portable, it is primarily optimized
for 64-bit x86-compatible processors, and may run slower in other environments.
In particular:
– Snappy uses 64-bit operations in several places to process more data at
once than would otherwise be possible.
– Snappy assumes unaligned 32- and 64-bit loads and stores are cheap.
On some platforms, these must be emulated with single-byte loads
and stores, which is much slower.
– Snappy assumes little-endian throughout, and needs to byte-swap data in
several places if running on a big-endian platform.
Experience has shown that even heavily tuned code can be improved.
Performance optimizations, whether for 64-bit x86 or other platforms,
are of course most welcome; see “Contact”, below.
Usage
=====
Note that Snappy, both the implementation and the interface,
is written in C++.
To use Snappy from your own program, include the file “snappy.h” from
your calling file, and link against the compiled library.
There are many ways to call Snappy, but the simplest possible is
snappy::Compress(input, &output);
and similarly
snappy::Uncompress(input, &output);
where “input” and “output” are both instances of std::string.