Moving data between Windows and Ubuntu VMWare partition

I use Windows 7 on my laptop (it came pre-installed) and Ubuntu using the VMWare Player. What are the advantages of using VM Player instead of creating a dual-boot system? Well I can quickly shift from Ubuntu to Windows and bakc again without restarting my computer everytime. Using this approach allows me to utilize software that run only on Windows and run software like Rattle, the R data mining GUI, that are much easier installed on Linux.

However if your statistical software is on your Virtual Disk , and your data is on your Windows disk, you need a way to move data from Windows to Ubuntu.

The solution to this as per Ubuntu forums is –http://communities.vmware.com/thread/55242

Open My Computer, browse to the folder you want to share.  Right-click on the folder, select Properties.  Sharing tab.  Select the radio button to “Share this Folder”.  Change the default generated name if you wish; add a description if you wish.  Click the Permissions button to modify the security settings of what users can read/write to the share.

On the Linux side, it depends on the distro, the shell, and the window manager.

Well Ubuntu makes it really easy to configure the Linux steps to move data within Windows and Linux partitions.


NEW UPDATE-

VMmare makes it easy to share between your Windows (host) and Linux (guest) OS


Step 1

and step 2

Do this


and

Start the Wizard

when you finish the wizard and share a drive or folder- hey where do I see my shared ones-


see this folder in Linux- /mnt/hgfs (bingo!)

Hacker HW – Make this folder //mnt/hgfs a shortcut in Places your Ubuntu startup

Hacker Hw 2-

Upload using an anon email your VM dark data to Ubuntu one

Delete VM

Purge using software XX

Reinstall VM and bring back backup


Note time to do this


-General Sharing in Windows


Just open the Network tab in Ubuntu- see screenshots below-

Windows will now ask your Ubuntu user for login-

Once Logged in Windows from within Ubuntu Vmware, this is what happens

You see a tab called “users on “windows username”- pc appear on your Ubuntu Desktop  (see top right of the screenshot)

If you double click it- you see your windows path

You can now just click and drag data between your windows and linux partitions , just the way you do it in Windows .

So based on this- if you want to build  decision trees, artifical neural networks, regression models, and even time series models for zero capital expenditure- you can use both Ubuntu/R without compromising on your IT policy of Windows only in your organization (there is a shortage of Ubuntu trained IT administrators in the enterprise world)

Revised Installation Procedure for utilizing both Ubuntu /R/Rattle data mining on your Windows PC.

Using VMWare to build a free data mining system in R, as well as isolate your analytics system (thus using both Linux and Windows without overburdening your machine)

First Time

  1. http://downloads.vmware.com/d/info/desktop_end_user_computing/vmware_player/4_0Download and Install
  2. http://www.ubuntu.com/download/ubuntu/downloadDownload Only
  3. Create New Virtual Image in VM Ware Player
  4. Applications—–Terminal——sudo apt get-install R (to download and install)
  5.                                          sudo R (to open R)
  6. Once R is opened type this  —-install.packages(rattle)—– This will install rattle
  7. library(rattle) will load Rattle—–
  8. rattle() will open the GUI—-
Getting Data from Host to Guest VM
Next Time
  1. Go to VM Player
  2. Open the VM
  3. sudo R in terminal to bring up R
  4. library(rattle) within R
  5. rattle()
At this point even if you dont know any Linux and dont know any R, you can create data mining models using the Rattle GUI (and time series model using E pack in the R Commander GUI) – What can Rattle do in data mining? See this slideshow-http://www.decisionstats.com/data-mining-with-r-gui-rattle-rstats/
If Google Docs is banned as per your enterprise organizational IT policy of having Windows Explorer only- well you can see these screenshots http://rattle.togaware.com/rattle-screenshots.html

Data Mining with R GUI -Rattle #Rstats

Why is RATTLE my favorite R package?
because it allows data mining in a very nice interface.
Complicated software need not have complicated interfaces.
Have a look-

(Note- download rattle from http://rattle.togaware.com)

For better visibility please click the full screen button or click the second pps below- automatically advances every 5 secs

Using R with MySQL #rstats

A brief tutorial to working with R and MySQL. MySQL belongs to Oracle is one of the most widely used databases now.

1. Download mySQL from
http://www.mysql.com/downloads/mysql/  or (http://www.mysql.com/downloads/mirror.php?id=403831)
Click Install -use default options, remember to note down the password=XX
2.Download the ODBC connector from http://www.mysql.com/downloads/connector/odbc/5.1.htmlThe Data Sources (ODBC) can be located from the Control Panel in Windows7

Install ODBC Connector by double clicking the .msi file downloaded in Step 2-
Check this screenshot in ODBC Connectors to verify-
Note this is the Drivers tab in ODBC Data Source Administrator
Click the System DSN and Configure MySQL using the add button 
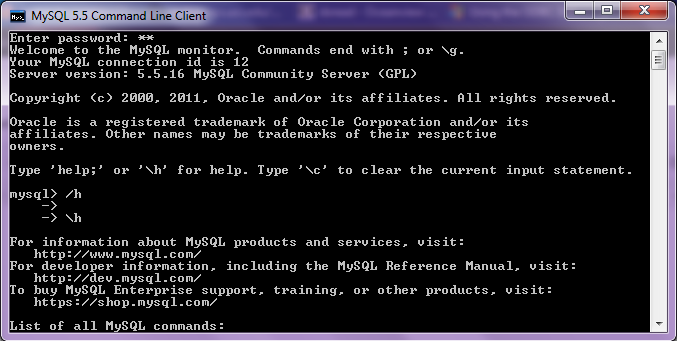
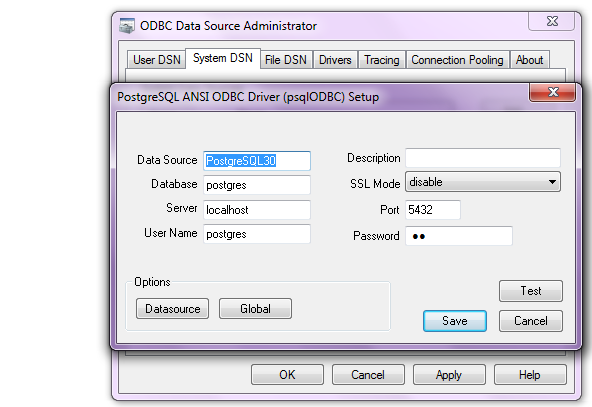
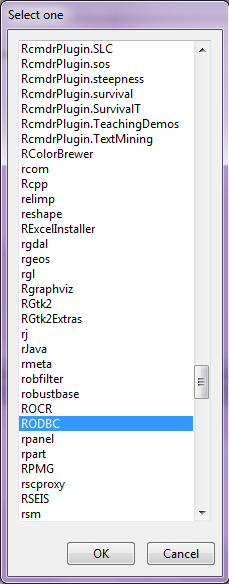
Use the configuration options shown exactly here. The user is root, the TCP/IP Server is local host, use the same password in Step 1 and the Database is MySQL
Test the connection

Click OK to finish this step.
Click the User DSN tab (and repeating the step  immediately above -Add, and Configure the connection using options The user is root, the TCP/IP Server is local host, use the same password in Step 1 and the Database is MySQL , Test the connection and OK to add the connection

3. Download the MySQL workbench from http://www.mysql.com/downloads/workbench/

This is very helpful to configuring the database
http://www.mysql.com/downloads/mirror.php?id=403983#mirrors

Create a new table using the options in the screenshots below

Open Connection

You can create a new table using the options as below,
Once created you can also add new variables (using the Columns Tab)

MySQL allows you create new columns very easily
The  SQL commands are automatically generated.
Click Apply  to execute the changes to the Database.

Now we start R
Type the commands in the screenshot below to create a connection to the Database in MySQL
> library(RODBC)
> odbcDataSources()
> ajay=odbcConnect(“MySQL”,uid=”root”,pwd=”XX”)
> ajay
> sqlTables(ajay)
>tested=sqlFetch(ajay,”host”)

Note- this is a brief tutorial for beginners without getting into too many complexities of database administration and management, to start using R and MySQL.

Interesting announcement from PiCloud

An interesting announcement from PiCloud who is a cloud computing startup, but focused on python (as the name suggests). They basically have created a cloud library (or in R lingo – a package) that enables you to call cloud power sitting from the desktop interface itself. This announcement is for multiple IP addresses. Real parallel processing or just a quick trick in technical jargon- you decide!

  1. Prepare
  2. Run
  3. Monitor
Prepare

s1 cores are comparable in performance to c1 cores with one extra trick up their sleeve: each job running in parallel will have a different IP.

Why is this important?
Using unique IPs is necessary to minimize the automated throttling most sites will impose when seeing fast, repeated access from a single IP.

How do I use it?
If you’re already using our c1 cores, all you’ll need to do is set the _type keyword.

cloud.call(func, _type=’s1′)

How much?
$0.04/core/hour

Why don’t other cores have individual IPs?
For other core types, such as c2, multiple cores may be running on a single machine that is assigned only a single IP address. When using s1 cores, you’re guaranteed that each core sits on a different machine.


http://www.picloud.com/

Knowledge Discovery in Databases -KDD using PostgreSQL and #Rstats

Here is a small brief primer for beginners on configuring an open source database and using an open source analytics package.

All you need to know – is to read!


1. download PostgreSQL from
http://www.postgresql.org/download/windowsInstall PostgreSQL

Remember to store /memorize the password for the user postgres!

Create a connection using pgAdmin feature in Start Menu

2. download ODBC driver from
http://www.postgresql.org/ftp/odbc/versions/msi/
and the Win 64 edition from
http://wwwmaster.postgresql.org/download/mirrors-ftp/odbc/versions/msi/psqlodbc_09_00_0310-x64.zip

install ODBC driver

3. Go to

Start Menu\Control Panel\All Control Panel Items\Administrative Tools\Data Sources (ODBC)

4. Configure the following details in System DSN and  User DSN using the ADD tabs .Test connection to check if connection is working

5. Start R and install and load library RODBC

6. Use following initial code for R- if you know SQL you can  do the rest
> library(RODBC)

> odbcDataSources(type = c(“all”, “user”, “system”))
SQLServer              PostgreSQL30             PostgreSQL35W
“SQL Server”    “PostgreSQL ANSI(x64)” “PostgreSQL Unicode(x64)”

> ajay=odbcConnect(“PostgreSQL30”, uid = “postgres”, pwd = “XX”)

> sqlTables(ajay)
TABLE_QUALIFIER TABLE_OWNER TABLE_NAME TABLE_TYPE REMARKS
1        postgres      public      names      TABLE

> crimedat <- sqlFetch(ajay, “names”)

Oracle adds R to Big Data Appliance -Use #Rstats

From the press release, Oracle gets on R and me too- NoSQL

http://www.oracle.com/us/corporate/press/512001

The Oracle Big Data Appliance is a new engineered system that includes an open source distribution of Apache™ Hadoop™, Oracle NoSQL Database, Oracle Data Integrator Application Adapter for Hadoop, Oracle Loader for Hadoop, and an open source distribution of R.

From

http://www.theregister.co.uk/2011/10/03/oracle_big_data_appliance/

the Big Data Appliance also includes the R programming language, a popular open source statistical-analysis tool. This R engine will integrate with 11g R2, so presumably if you want to do statistical analysis on unstructured data stored in and chewed by Hadoop, you will have to move it to Oracle after the chewing has subsided.

This approach to R-Hadoop integration is different from that announced last week between Revolution Analytics, the so-called Red Hat for stats that is extending and commercializing the R language and its engine, and Cloudera, which sells a commercial Hadoop setup called CDH3 and which was one of the early companies to offer support for Hadoop. Both Revolution Analytics and Cloudera now have Oracle as their competitor, which was no doubt no surprise to either.

In any event, the way they do it, the R engine is put on each node in the Hadoop cluster, and those R engines just see the Hadoop data as a native format that they can do analysis on individually. As statisticians do analyses on data sets, the summary data from all the nodes in the Hadoop cluster is sent back to their R workstations; they have no idea that they are using MapReduce on unstructured data.

Oracle did not supply configuration and pricing information for the Big Data Appliance, and also did not say when it would be for sale or shipping to customers

From

http://www.oracle.com/us/corporate/features/feature-oracle-nosql-database-505146.html

A Horizontally Scaled, Key-Value Database for the Enterprise
Oracle NoSQL Database is a commercial grade, general-purpose NoSQL database using a key/value paradigm. It allows you to manage massive quantities of data, cope with changing data formats, and submit simple queries. Complex queries are supported using Hadoop or Oracle Database operating upon Oracle NoSQL Database data.

Oracle NoSQL Database delivers scalable throughput with bounded latency, easy administration, and a simple programming model. It scales horizontally to hundreds of nodes with high availability and transparent load balancing. Customers might choose Oracle NoSQL Database to support Web applications, acquire sensor data, scale authentication services, or support online serves and social media.

and

from

http://siliconangle.com/blog/2011/09/30/oracle-adopting-open-source-r-to-connect-legacy-systems/

Oracle says it will integrate R with its Oracle Database. Other signs from Oracle show the deeper interest in using the statistical framework for integration with Hadoop to potentially speed statistical analysis. This has particular value with analyzing vast amounts of unstructured data, which has overwhelmed organizations, especially over the past year.

and

from

http://www.oracle.com/us/corporate/features/features-oracle-r-enterprise-498732.html

Oracle R Enterprise

Integrates the Open-Source Statistical Environment R with Oracle Database 11g
Oracle R Enterprise allows analysts and statisticians to run existing R applications and use the R client directly against data stored in Oracle Database 11g—vastly increasing scalability, performance and security. The combination of Oracle Database 11g and R delivers an enterprise-ready, deeply integrated environment for advanced analytics. Users can also use analytical sandboxes, where they can analyze data and develop R scripts for deployment while results stay managed inside Oracle Database.

Building a Regression Model in R – Use #Rstats

One of the most commonly used uses of Statistical Software is building models, and that too logistic regression models for propensity in marketing of goods and services.


If building a model is what you do-here is a brief easy essay on  how to build a model in R.

1) Packages to be used-

For smaller datasets

use these

  1. CAR Package http://cran.r-project.org/web/packages/car/index.html
  2. GVLMA Package http://cran.r-project.org/web/packages/gvlma/index.html
  3. ROCR Package http://rocr.bioinf.mpi-sb.mpg.de/
  4. Relaimpo Package
  5. DAAG package
  6. MASS package
  7. Bootstrap package
  8. Leaps package

Also see

http://cran.r-project.org/web/packages/rms/index.html or RMS package

rms works with almost any regression model, but it was especially written to work with binary or ordinal logistic regression, Cox regression, accelerated failure time models, ordinary linear models, the Buckley-James model, generalized least squares for serially or spatially correlated observations, generalized linear models, and quantile regression.

For bigger datasets also see Biglm http://cran.r-project.org/web/packages/biglm/index.html and RevoScaleR packages.

http://www.revolutionanalytics.com/products/enterprise-big-data.php

2) Syntax

  1. outp=lm(y~x1+x2+xn,data=dataset) Model Eq
  2. summary(outp) Model Summary
  3. par(mfrow=c(2,2)) + plot(outp) Model Graphs
  4. vif(outp) MultiCollinearity
  5. gvlma(outp) Heteroscedasticity using GVLMA package
  6. outlierTest (outp) for Outliers
  7. predicted(outp) Scoring dataset with scores
  8. anova(outp)
  9. > predict(lm.result,data.frame(conc = newconc), level = 0.9, interval = “confidence”)


For a Reference Card -Cheat Sheet see

http://cran.r-project.org/doc/contrib/Ricci-refcard-regression.pdf

3) Also read-

http://cran.r-project.org/web/views/Econometrics.html

http://cran.r-project.org/web/views/Robust.html