Product Review – Revolution R 5.0

So I got the email from Revolution R. Version 5.0 is ready for download, and unlike half hearted attempts by many software companies they make it easy for the academics and researchers to get their free copy. Free as in speech and free as in beer.

Some thoughts-

1) R ‘s memory problem is now an issue of marketing and branding. Revolution Analytics has definitely bridged this gap technically  beautifully and I quote from their documentation-

The primary advantage 64-bit architectures bring to R is an increase in the amount of memory available to a given R process.
The first benefit of that increase is an increase in the size of data objects you can create. For example, on most 32-bit versions of R, the largest data object you can create is roughly 3GB; attempts to create 4GB objects result in errors with the message “cannot allocate vector of length xxxx.”
On 64-bit versions of R, you can generally create larger data objects, up to R’s current hard limit of 231 􀀀 1 elements in a vector (about 2 billion elements). The functions memory.size and memory.limit help you manage the memory used byWindows versions of R.
In 64-bit Revolution R Enterprise, R sets the memory limit by default to the amount of physical RAM minus half a gigabyte, so that, for example, on a machine with 8GB of RAM, the default memory limit is 7.5GB:

2) The User Interface is best shown as below or at  https://docs.google.com/presentation/pub?id=1V_G7r0aBR3I5SktSOenhnhuqkHThne6fMxly_-4i8Ag&start=false&loop=false&delayms=3000

-(but I am still hoping for the GUI ,Revolution Analytics promised us for Christmas)

3) The partnership with Microsoft HPC is quite awesome given Microsoft’s track record in enterprise software penetration

but I am also interested in knowing more about the Oracle version of R and what it will do there.

Using R with MySQL #rstats

A brief tutorial to working with R and MySQL. MySQL belongs to Oracle is one of the most widely used databases now.

1. Download mySQL from
http://www.mysql.com/downloads/mysql/  or (http://www.mysql.com/downloads/mirror.php?id=403831)
Click Install -use default options, remember to note down the password=XX
2.Download the ODBC connector from http://www.mysql.com/downloads/connector/odbc/5.1.htmlThe Data Sources (ODBC) can be located from the Control Panel in Windows7

Install ODBC Connector by double clicking the .msi file downloaded in Step 2-
Check this screenshot in ODBC Connectors to verify-
Note this is the Drivers tab in ODBC Data Source Administrator
Click the System DSN and Configure MySQL using the add button 
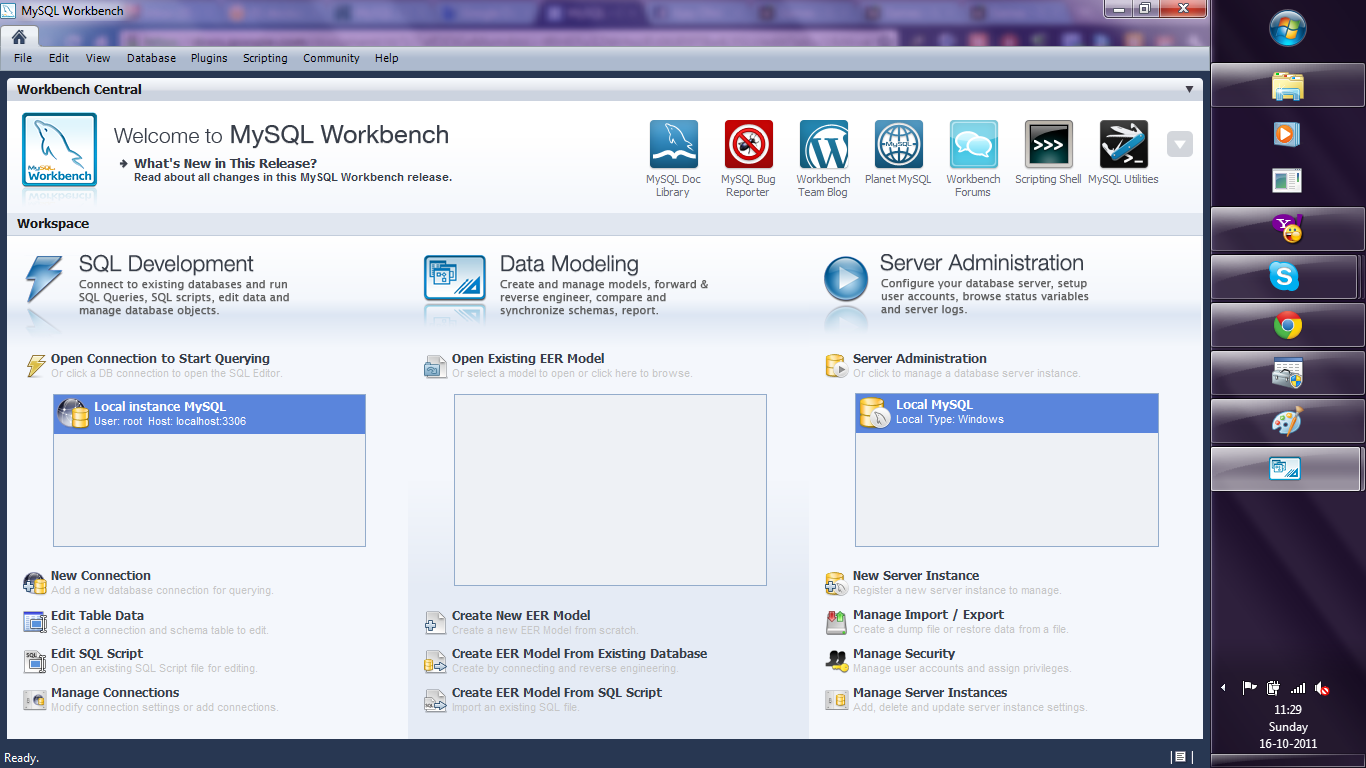
Use the configuration options shown exactly here. The user is root, the TCP/IP Server is local host, use the same password in Step 1 and the Database is MySQL
Test the connection

Click OK to finish this step.
Click the User DSN tab (and repeating the step  immediately above -Add, and Configure the connection using options The user is root, the TCP/IP Server is local host, use the same password in Step 1 and the Database is MySQL , Test the connection and OK to add the connection

3. Download the MySQL workbench from http://www.mysql.com/downloads/workbench/

This is very helpful to configuring the database
http://www.mysql.com/downloads/mirror.php?id=403983#mirrors

Create a new table using the options in the screenshots below

Open Connection

You can create a new table using the options as below,
Once created you can also add new variables (using the Columns Tab)

MySQL allows you create new columns very easily
The  SQL commands are automatically generated.
Click Apply  to execute the changes to the Database.

Now we start R
Type the commands in the screenshot below to create a connection to the Database in MySQL
> library(RODBC)
> odbcDataSources()
> ajay=odbcConnect(“MySQL”,uid=”root”,pwd=”XX”)
> ajay
> sqlTables(ajay)
>tested=sqlFetch(ajay,”host”)

Note- this is a brief tutorial for beginners without getting into too many complexities of database administration and management, to start using R and MySQL.

Oracle adds R to Big Data Appliance -Use #Rstats

From the press release, Oracle gets on R and me too- NoSQL

http://www.oracle.com/us/corporate/press/512001

The Oracle Big Data Appliance is a new engineered system that includes an open source distribution of Apache™ Hadoop™, Oracle NoSQL Database, Oracle Data Integrator Application Adapter for Hadoop, Oracle Loader for Hadoop, and an open source distribution of R.

From

http://www.theregister.co.uk/2011/10/03/oracle_big_data_appliance/

the Big Data Appliance also includes the R programming language, a popular open source statistical-analysis tool. This R engine will integrate with 11g R2, so presumably if you want to do statistical analysis on unstructured data stored in and chewed by Hadoop, you will have to move it to Oracle after the chewing has subsided.

This approach to R-Hadoop integration is different from that announced last week between Revolution Analytics, the so-called Red Hat for stats that is extending and commercializing the R language and its engine, and Cloudera, which sells a commercial Hadoop setup called CDH3 and which was one of the early companies to offer support for Hadoop. Both Revolution Analytics and Cloudera now have Oracle as their competitor, which was no doubt no surprise to either.

In any event, the way they do it, the R engine is put on each node in the Hadoop cluster, and those R engines just see the Hadoop data as a native format that they can do analysis on individually. As statisticians do analyses on data sets, the summary data from all the nodes in the Hadoop cluster is sent back to their R workstations; they have no idea that they are using MapReduce on unstructured data.

Oracle did not supply configuration and pricing information for the Big Data Appliance, and also did not say when it would be for sale or shipping to customers

From

http://www.oracle.com/us/corporate/features/feature-oracle-nosql-database-505146.html

A Horizontally Scaled, Key-Value Database for the Enterprise
Oracle NoSQL Database is a commercial grade, general-purpose NoSQL database using a key/value paradigm. It allows you to manage massive quantities of data, cope with changing data formats, and submit simple queries. Complex queries are supported using Hadoop or Oracle Database operating upon Oracle NoSQL Database data.

Oracle NoSQL Database delivers scalable throughput with bounded latency, easy administration, and a simple programming model. It scales horizontally to hundreds of nodes with high availability and transparent load balancing. Customers might choose Oracle NoSQL Database to support Web applications, acquire sensor data, scale authentication services, or support online serves and social media.

and

from

http://siliconangle.com/blog/2011/09/30/oracle-adopting-open-source-r-to-connect-legacy-systems/

Oracle says it will integrate R with its Oracle Database. Other signs from Oracle show the deeper interest in using the statistical framework for integration with Hadoop to potentially speed statistical analysis. This has particular value with analyzing vast amounts of unstructured data, which has overwhelmed organizations, especially over the past year.

and

from

http://www.oracle.com/us/corporate/features/features-oracle-r-enterprise-498732.html

Oracle R Enterprise

Integrates the Open-Source Statistical Environment R with Oracle Database 11g
Oracle R Enterprise allows analysts and statisticians to run existing R applications and use the R client directly against data stored in Oracle Database 11g—vastly increasing scalability, performance and security. The combination of Oracle Database 11g and R delivers an enterprise-ready, deeply integrated environment for advanced analytics. Users can also use analytical sandboxes, where they can analyze data and develop R scripts for deployment while results stay managed inside Oracle Database.

Interview Jaime Fitzgerald President Fitzgerald Analytics

Here is an interview with noted analytics expert Jaime Fitzgerald, of Fitzgerald Analytics.

Ajay-Describe your career journey from being a Harvard economist to being a text analytics thought leader.

 Jaime- I was attracted to economics because of the logic, the structured and systematic approach to understanding the world and to solving problems. In retrospect, this is the same passion for logic in problem solving that drives my business today.

About 15 years ago, I began working in consulting and initially took a traditional career path. I worked for well-known strategy consulting firms including First Manhattan Consulting Group, Novantas LLC, Braun Consulting, and for the former Japan-focused division of Deloitte Consulting, which had spun off as an independent entity. I was the only person in their New York City office for whom Japanese was not the first language.

While I enjoyed traditional consulting, I was especially passionate about the role of data, analytics, and process improvement. In traditional strategy consulting, these are important factors, but I had a vision for a “next generation” approach to strategy consulting that would be more transparent, more robust, and more focused on the role that information, analysis, and process plays in improving business results. I often explain that while my firm is “not your father’s consulting model,” we have incorporated key best practices from traditional consulting, and combined them with an approach that is more data-centric, technology-centric, and process-centric.

At the most fundamental level, I was compelled to found Fitzgerald Analytics more than six years ago by my passion for the role information plays in improving results, and ultimately improving lives. In my vision, data is an asset waiting to be transformed into results, including profit as well as other results that matter deeply to people. For example,one of the most fulfilling aspects of our work at Fitzgerald Analytics is our support of non-profits and social entrepreneurs, who we help increase their scale and their success in achieving their goals.

Ajay- How would you describe analytics as a career option to future students. What do you think are the most essential qualities an analytics career requires.

Jaime- My belief is that analytics will be a major driver of job-growth and career growth for decades. We are just beginning to unlock the full potential of analytics, and already the demand for analytic talent far exceeds the supply.

To succeed in analytics, the most important quality is logic. Many people believe that math or statistical skills are the most important quality, but in my experience, the most essential trait is what I call “ThoughtStyle” — critical thinking, logic, an ability to break down a problem into components, into sub-parts.

Ajay -What are your favorite techniques and methodologies in text analytics. How do you see social media and Big Data analytics as components of text analytics

 Jaime-We do a lot of work for our clients measuring Customer Experience, by which I mean the experience customers have when interacting with our clients. For example, we helped a major brokerage firm to measure 12 key “Moments that Matter,” including the operational aspects of customer service, customer satisfaction and sentiment, and ultimately customer behavior. Clients care about this a lot, because customer experience drives customer loyalty, which in turn drives customer behavior, customer loyalty, and customer profitability.

Text analytics plays a key role in these projects because much of our data on customer sentiment comes via unstructured text data. For example, we have access to call center transcripts and notes, to survey responses, and to social media comments.

We use a variety of methods, some of which I’m not in a position to describe in great detail. But at a high level, I would say that our favorite text analytics methodologies are “hybrid solutions” which use a two-step process to answer key questions for clients:

Step 1: convert unstructured data into key categorical variables (for example, using contextual analysis to flag users who are critical vs. neutral vs. advocates)

Step 2: linking sentiment categories to customer behavior and profitability (for example, linking customer advocacy and loyalty with customer profits as well as referral volume, to define the ROI that clients accrue for customer satisfaction improvements)

Ajay- Describe your consulting company- Fitzgerald Analytics and some of the work that you have been engaged in.

 Jaime- Our mission is to “illuminate reality” using data and to convert Data to Dollars for our clients. We have a track record of doing this well, with concrete and measurable results in the millions of dollars. As a result, 100% of our clients have engaged us for more than one project: a 100% client loyalty rate.

Our specialties–and most frequent projects–include customer profitability management projects, customer segmentation, customer experience management, balanced scorecards, and predictive analytics. We are often engaged to address high-stakes analytic questions, including issues that help to set long-term strategy. In other cases, clients hire us to help them build their internal capabilities. We have helped build several brand new analytic teams for clients, which continue to generate millions of dollars of profits with their fact-based recommendations.

Our methodology is based on Steven Covey’s principle: “begin with the end in mind,” the concept of starting with the client’s goal and working backwards from there. I often explain that our methods are what you would have gotten if Steven Covey had been a data analyst…we are applying his principles to the world of data analytics.

Ajay- Analytics requires more and more data while privacy requires the least possible data. What do you think are the guidelines that need to be built in sharing internet browsing and user activity data and do we need regulations just like we do for sharing financial data.

 Jaime- Great question. This is an essential challenge of the big data era. My perspective is that firms who depend on user data for their analysis need to take responsibility for protecting privacy by using data management best practices. Best practices to adequately “mask” or remove private data exist…the problem is that these best practices are often not applied. For example, Facebook’s practice of sharing unique user IDs with third-party application companies has generated a lot of criticism, and could have been avoided by applying data management best practices which are well known among the data management community.

If I were able to influence public policy, my recommendation would be to adopt a core set of simple but powerful data management standards that would protect consumers from perhaps 95% of the privacy risks they face today. The number one standard would be to prohibit sharing of static, personally identifiable user IDs between companies in a manner that creates “privacy risk.” Companies can track unique customers without using a static ID…they need to step up and do that.

Ajay- What are your favorite text analytics software that you like to work with.

 Jaime- Because much of our work in deeply embedded into client operations and systems, we often use the software our clients already prefer. We avoid recommending specific vendors unless our client requests it. In tandem with our clients and alliance partners, we have particular respect for Autonomy, Open Text, Clarabridge, and Attensity.

Biography-

http://www.fitzgerald-analytics.com/jaime_fitzgerald.html

The Founder and President of Fitzgerald Analytics, Jaime has developed a distinctively quantitative, fact-based, and transparent approach to solving high stakes problems and improving results.  His approach enables translation of Data to Dollars™ using methodologies clients can repeat again and again.  He is equally passionate about the “human side of the equation,” and is known for his ability to link the human and the quantitative, both of which are needed to achieve optimal results.

Experience: During more than 15 years serving clients as a management strategy consultant, Jaime has focused on customer experience and loyalty, customer profitability, technology strategy, information management, and business process improvement.  Jaime has advised market-leading banks, retailers, manufacturers, media companies, and non-profit organizations in the United States, Canada, and Singapore, combining strategic analysis with hands-on implementation of technology and operations enhancements.

Career History: Jaime began his career at First Manhattan Consulting Group, specialists in financial services, and was later a Co-Founder at Novantas, the strategy consultancy based in New York City.  Jaime was also a Manager for Braun Consulting, now part of Fair Isaac Corporation, and for Japan-based Abeam Consulting, now part of NEC.

Background: Jaime is a graduate of Harvard University with a B.A. in Economics.  He is passionate and supportive of innovative non-profit organizations, their effectiveness, and the benefits they bring to our society.

Upcoming Speaking Engagements:   Jaime is a frequent speaker on analytics, information management strategy, and data-driven profit improvement.  He recently gave keynote presentations on Analytics in Financial Services for The Data Warehousing Institute, the New York Technology Council, and the Oracle Financial Services Industry User Group. A list of Jaime’s most interesting presentations on analyticscan be found here.

He will be presenting a client case study this fall at Text Analytics World re:   “New Insights from ‘Big Legacy Data’: The Role of Text Analytics” 

Connecting with Jaime:  Jaime can be found at Linkedin,  and Twitter.  He edits the Fitzgerald Analytics Blog.

Interview Mike Boyarski Jaspersoft

Here is an interview with Mike Boyarski , Director Product Marketing at Jaspersoft

.


the largest BI community with over 14 million downloads, nearly 230,000 registered members, representing over 175,000 production deployments, 14,000 customers, across 100 countries.

Ajay- Describe your career in science from Biology to marketing great software.
Mike- I studied Biology with the assumption I’d pursue a career in medicine. It took about 2 weeks during an internship at a Los Angeles hospital to determine I should do something else.  I enjoyed learning about life science, but the whole health care environment was not for me.  I was initially introduced to enterprise-level software while at Applied Materials within their Microcontamination group.  I was able to assist with an internal application used to collect contamination data.  I later joined Oracle to work on an Oracle Forms application used to automate the production of software kits (back when documentation and CDs had to be physically shipped to recognize revenue). This gave me hands on experience with Oracle 7, web application servers, and the software development process.
I then transitioned to product management for various products including application servers, software appliances, and Oracle’s first generation SaaS based software infrastructure. In 2006, with the Siebel and PeopleSoft acquisitions underway, I moved on to Ingres to help re-invigorate their solid yet antiquated technology. This introduced me to commercial open source software and the broader Business Intelligence market.  From Ingres I joined Jaspersoft, one of the first and most popular open source Business Intelligence vendors, serving as head of product marketing since mid 2009.
Ajay- Describe some of the new features in Jaspersoft 4.1 that help differentiate it from the rest of the crowd. What are the exciting product features we can expect from Jaspersoft down the next couple of years.
Mike- Jaspersoft 4.1 was an exciting release for our customers because we were able to extend the latest UI advancements in our ad hoc report designer to the data analysis environment. Now customers can use a unified intuitive web-based interface to perform several powerful and interactive analytic functions across any data source, whether its relational, non-relational, or a Big Data source.
 The reality is that most (roughly 70%) of todays BI adoption is in the form of reports and dashboards. These tools are used to drive and measure an organizations business, however, data analysis presents the most strategic opportunity for companies because it can identify new opportunities, efficiencies, and competitive differentiation.  As more data comes online, the difference between those companies that are successful and those that are not will likely be attributed to their ability to harness data analysis techniques to drive and improve business performance. Thus, with Jaspersoft 4.1, and our improved ad hoc reporting and analysis UI we can effectively address a broader set of BI requirements for organizations of all sizes.
Ajay-  What do you think is a good metric to measure influence of an open source software product – is it revenue or is it number of downloads or number of users. How does Jaspersoft do by these counts.
Mike- History has shown that open source software is successful as a “bottoms up” disrupter within IT or the developer market.  Today, many new software projects and startup ventures are birthed on open source software, often initiated with little to no budget. As the organization achieves success with a particular project, the next initiative tends to be larger and more strategic, often displacing what was historically solved with a proprietary solution. These larger deployments strengthen the technology over time.
Thus, the more proven and battle tested an open source solution is, often measured via downloads, deployments, community size, and community activity, usually equates to its long term success. Linux, Tomcat, and MySQL have plenty of statistics to model this lifecycle. This model is no different for open source BI.
The success to date of Jaspersoft is directly tied to its solid proven technology and the vibrancy of the community.  We proudly and openly claim to have the largest BI community with over 14 million downloads, nearly 230,000 registered members, representing over 175,000 production deployments, 14,000 customers, across 100 countries.  Every day, 30,000 developers are using Jaspersoft to build BI applications.  Behind Excel, its hard to imagine a more widely used BI tool in the market.  Jaspersoft could not reach these kind of numbers with crippled or poorly architected software.
Ajay- What are your plans for leveraging cloud computing, mobile and tablet platforms and for making Jaspersoft more easy and global  to use.

#SAS 9.3 and #Rstats 2.13.1 Released

A bit early but the latest editions of both SAS and R were released last week.

SAS 9.3 is clearly a major release with multiple enhancements to make SAS both relevant and pertinent in enterprise software in the age of big data. Also many more R specific, JMP specific and partners like Teradata specific enhancements.

http://support.sas.com/software/93/index.html

Features

Data management

  • Enhanced manageability for improved performance
  • In-database processing (EL-T pushdown)
  • Enhanced performance for loading oracle data
  • New ET-L transforms
  • Data access

Data quality

  • SAS® Data Integration Server includes DataFlux® Data Management Platform for enhanced data quality
  • Master Data Management (DataFlux® qMDM)
    • Provides support for master hub of trusted entity data.

Analytics

  • SAS® Enterprise Miner™
    • New survival analysis predicts when an event will happen, not just if it will happen.
    • New rate making capability for insurance predicts optimal insurance premium for individuals based on attributes known at application time.
    • Time Series Data Mining node (experimental) applies data mining techniques to transactional, time-stamped data.
    • Support Vector Machines node (experimental) provides a supervised machine learning method for prediction and classification.
  • SAS® Forecast Server
    • SAS Forecast Server is integrated with the SAP APO Demand Planning module to provide SAP users with access to a superior forecasting engine and automatic forecasting capabilities.
  • SAS® Model Manager
    • Seamless integration of R models with the ability to register and manage R models in SAS Model Manager.
    • Ability to perform champion/challenger side-by-side comparisons between SAS and R models to see which model performs best for a specific need.
  • SAS/OR® and SAS® Simulation Studio
    • Optimization
    • Simulation
      • Automatic input distribution fitting using JMP with SAS Simulation Studio.

Text analytics

  • SAS® Text Miner
  • SAS® Enterprise Content Categorization
  • SAS® Sentiment Analysis

Scalability and high-performance

  • SAS® Analytics Accelerator for Teradata (new product)
  • SAS® Grid Manager
 and latest from http://www.r-project.org/ I was a bit curious to know why the different licensing for R now (from GPL2 to GPL2- GPL 3)

LICENCE:

No parts of R are now licensed solely under GPL-2. The licences for packages rpart and survival have been changed, which means that the licence terms for R as distributed are GPL-2 | GPL-3.


This is a maintenance release to consolidate various minor fixes to 2.13.0.
CHANGES IN R VERSION 2.13.1:

  NEW FEATURES:

    • iconv() no longer translates NA strings as "NA".

    • persp(box = TRUE) now warns if the surface extends outside the
      box (since occlusion for the box and axes is computed assuming
      the box is a bounding box). (PR#202.)

    • RShowDoc() can now display the licences shipped with R, e.g.
      RShowDoc("GPL-3").

    • New wrapper function showNonASCIIfile() in package tools.

    • nobs() now has a "mle" method in package stats4.

    • trace() now deals correctly with S4 reference classes and
      corresponding reference methods (e.g., $trace()) have been added.

    • xz has been updated to 5.0.3 (very minor bugfix release).

    • tools::compactPDF() gets more compression (usually a little,
      sometimes a lot) by using the compressed object streams of PDF
      1.5.

    • cairo_ps(onefile = TRUE) generates encapsulated EPS on platforms
      with cairo >= 1.6.

    • Binary reads (e.g. by readChar() and readBin()) are now supported
      on clipboard connections.  (Wish of PR#14593.)

    • as.POSIXlt.factor() now passes ... to the character method
      (suggestion of Joshua Ulrich).  [Intended for R 2.13.0 but
      accidentally removed before release.]

    • vector() and its wrappers such as integer() and double() now warn
      if called with a length argument of more than one element.  This
      helps track down user errors such as calling double(x) instead of
      as.double(x).

  INSTALLATION:

    • Building the vignette PDFs in packages grid and utils is now part
      of running make from an SVN checkout on a Unix-alike: a separate
      make vignettes step is no longer required.

      These vignettes are now made with keep.source = TRUE and hence
      will be laid out differently.

    • make install-strip failed under some configuration options.

    • Packages can customize non-standard installation of compiled code
      via a src/install.libs.R script. This allows packages that have
      architecture-specific binaries (beyond the package's shared
      objects/DLLs) to be installed in a multi-architecture setting.

  SWEAVE & VIGNETTES:

    • Sweave() and Stangle() gain an encoding argument to specify the
      encoding of the vignette sources if the latter do not contain a
      \usepackage[]{inputenc} statement specifying a single input
      encoding.

    • There is a new Sweave option figs.only = TRUE to run each figure
      chunk only for each selected graphics device, and not first using
      the default graphics device.  This will become the default in R
      2.14.0.

    • Sweave custom graphics devices can have a custom function
      foo.off() to shut them down.

    • Warnings are issued when non-portable filenames are found for
      graphics files (and chunks if split = TRUE).  Portable names are
      regarded as alphanumeric plus hyphen, underscore, plus and hash
      (periods cause problems with recognizing file extensions).

    • The Rtangle() driver has a new option show.line.nos which is by
      default false; if true it annotates code chunks with a comment
      giving the line number of the first line in the sources (the
      behaviour of R >= 2.12.0).

    • Package installation tangles the vignette sources: this step now
      converts the vignette sources from the vignette/package encoding
      to the current encoding, and records the encoding (if not ASCII)
      in a comment line at the top of the installed .R file.

  DEPRECATED AND DEFUNCT:

    • The internal functions .readRDS() and .saveRDS() are now
      deprecated in favour of the public functions readRDS() and
      saveRDS() introduced in R 2.13.0.

    • Switching off lazy-loading of code _via_ the LazyLoad field of
      the DESCRIPTION file is now deprecated.  In future all packages
      will be lazy-loaded.

    • The off-line help() types "postscript" and "ps" are deprecated.

  UTILITIES:

    • R CMD check on a multi-architecture installation now skips the
      user's .Renviron file for the architecture-specific tests (which
      do read the architecture-specific Renviron.site files).  This is
      consistent with single-architecture checks, which use
      --no-environ.

    • R CMD build now looks for DESCRIPTION fields BuildResaveData and
      BuildKeepEmpty for per-package overrides.  See ‘Writing R
      Extensions’.

  BUG FIXES:

    • plot.lm(which = 5) was intended to order factor levels in
      increasing order of mean standardized residual.  It ordered the
      factor labels correctly, but could plot the wrong group of
      residuals against the label.  (PR#14545)

    • mosaicplot() could clip the factor labels, and could overlap them
      with the cells if a non-default value of cex.axis was used.
      (Related to PR#14550.)

    • dataframe[[row,col]] now dispatches on [[ methods for the
      selected column (spotted by Bill Dunlap).

    • sort.int() would strip the class of an object, but leave its
      object bit set.  (Reported by Bill Dunlap.)

    • pbirthday() and qbirthday() did not implement the algorithm
      exactly as given in their reference and so were unnecessarily
      inaccurate.

      pbirthday() now solves the approximate formula analytically
      rather than using uniroot() on a discontinuous function.

      The description of the problem was inaccurate: the probability is
      a tail probablity (‘2 _or more_ people share a birthday’)

    • Complex arithmetic sometimes warned incorrectly about producing
      NAs when there were NaNs in the input.

    • seek(origin = "current") incorrectly reported it was not
      implemented for a gzfile() connection.

    • c(), unlist(), cbind() and rbind() could silently overflow the
      maximum vector length and cause a segfault.  (PR#14571)

    • The fonts argument to X11(type = "Xlib") was being ignored.

    • Reading (e.g. with readBin()) from a raw connection was not
      advancing the pointer, so successive reads would read the same
      value.  (Spotted by Bill Dunlap.)

    • Parsed text containing embedded newlines was printed incorrectly
      by as.character.srcref().  (Reported by Hadley Wickham.)

    • decompose() used with a series of a non-integer number of periods
      returned a seasonal component shorter than the original series.
      (Reported by Rob Hyndman.)

    • fields = list() failed for setRefClass().  (Reported by Michael
      Lawrence.)

    • Reference classes could not redefine an inherited field which had
      class "ANY". (Reported by Janko Thyson.)

    • Methods that override previously loaded versions will now be
      installed and called.  (Reported by Iago Mosqueira.)

    • addmargins() called numeric(apos) rather than
      numeric(length(apos)).

    • The HTML help search sometimes produced bad links.  (PR#14608)

    • Command completion will no longer be broken if tail.default() is
      redefined by the user. (Problem reported by Henrik Bengtsson.)

    • LaTeX rendering of markup in titles of help pages has been
      improved; in particular, \eqn{} may be used there.

    • isClass() used its own namespace as the default of the where
      argument inadvertently.

    • Rd conversion to latex mis-handled multi-line titles (including
      cases where there was a blank line in the \title section).
Also see this interesting blog
Examples of tasks replicated in SAS and R

Oracle launches XBRL extension for financial domains

What is XBRL and how does it work?

http://www.xbrl.org/HowXBRLWorks/

How XBRL Works
XBRL is a member of the family of languages based on XML, or Extensible Markup Language, which is a standard for the electronic exchange of data between businesses and on the internet.  Under XML, identifying tags are applied to items of data so that they can be processed efficiently by computer software.

XBRL is a powerful and flexible version of XML which has been defined specifically to meet the requirements of business and financial information.  It enables unique identifying tags to be applied to items of financial data, such as ‘net profit’.  However, these are more than simple identifiers.  They provide a range of information about the item, such as whether it is a monetary item, percentage or fraction.  XBRL allows labels in any language to be applied to items, as well as accounting references or other subsidiary information.

XBRL can show how items are related to one another.  It can thus represent how they are calculated.  It can also identify whether they fall into particular groupings for organisational or presentational purposes.  Most importantly, XBRL is easily extensible, so companies and other organisations can adapt it to meet a variety of special requirements.

The rich and powerful structure of XBRL allows very efficient handling of business data by computer software.  It supports all the standard tasks involved in compiling, storing and using business data.  Such information can be converted into XBRL by suitable mapping processes or generated in XBRL by software.  It can then be searched, selected, exchanged or analysed by computer, or published for ordinary viewing.

also see

http://www.xbrl.org/Example1/


and from-

http://www.oracle.com/us/dm/xbrlextension-354972.html?msgid=3-3856862107

With more than 7,000 new U.S. companies facing extensible business reporting language (XBRL) filing mandates in 2011, Oracle has released a free XBRL extension on top of the latest release of Oracle Database.

Oracle’s XBRL extension leverages Oracle Database 11g Release 2 XML to manage the collection, validation, storage, and analysis of XBRL data. It enables organizations to create one or more back-end XBRL repositories based on Oracle Database, providing secure XBRL storage and query-ability with a set of XBRL-specific services.

In addition, the extension integrates easily with Oracle Business Intelligence Suite Enterprise Edition to provide analytics, plus interactive development environments (IDEs) and design tools for creating and editing XBRL taxonomies.

The Other Side of XBRL
“While the XBRL mandate continues to grow, the feedback we keep hearing from the ‘other side’ of XRBL—regulators, academics, financial analysts, and investors—is that they lack sufficient tools and historic data to leverage the full potential of XBRL,” says John O’Rourke, vice president of product marketing, Oracle.

However, O’Rourke says this is quickly changing as XBRL mandates enter their third year—and more and more companies have to comply. While the new extension should be attractive to organizations that produce XBRL filings, O’Rourke expects it will prove particularly valuable to regulators, stock exchanges, universities, and other organizations that need to collect, analyze, and disseminate XBRL-based filings.

Outsourcing, a Bolt-on Solution, or Integrated XBRL Tagging
Until recently, reporting organizations had to choose between expensive third-party outsourcing or manual, in-house tagging with bolt-on solutions— both of which introduce the possibility of error.

In response, Oracle launched Oracle Hyperion Disclosure Management, which provides an XBRL tagging solution that is integrated with the financial close and reporting process for fast and reliable XBRL report submission—without relying on third-party providers. The solution enables organizations to

  • Author regulatory filings in Microsoft Office and “hot link” them directly to financial reporting systems so they can be easily updated
  • Graphically perform XBRL tagging at several levels—within Microsoft Office, within EPM system reports, or in the data source metadata
  • Modify or extend XBRL taxonomies before the mapping process, as well as set up multiple taxonomies
  • Create and validate final XBRL instance documents before submission