IBM SPSS 19: Marketing Analytics and RFM

What is RFM Analysis?

Recency Frequency Monetization is basically a technique to classify your entire customer list. You may be a retail player with thousands of customers or a enterprise software seller with only two dozen customers.

RFM Analysis can help you cut through and focus on the real customer that drives your profit.

As per Wikipedia

http://en.wikipedia.org/wiki/RFM

RFM is a method used for analyzing customer behavior and defining market segments. It is commonly used in database marketing and direct marketing and has received particular attention in retail.

RFM stands for

  • Recency – How recently a customer has purchased?
  • Frequency – How often he purchases?
  • Monetary Value – How much does he spend?

To create an RFM analysis, one creates categories for each attribute. For instance, the Recency attribute might be broken into three categories: customers with purchases within the last 90 days; between 91 and 365 days; and longer than 365 days. Such categories may be arrived at by applying business rules, or using a data mining technique, such asCHAID, to find meaningful breaks.

—————————————————————————————————-

Even if you dont know what or how to do a RFM, see below for an easy to do way.

I just got myself an evaluation copy of a fully loaded IBM SPSS 19 Module and did some RFM Analysis on some data- the way SPSS recent version is it makes it very very useful even to non statistical tool- but an extremely useful one to a business or marketing user.

Here are some screenshots to describe the features.

1) A simple dashboard to show functionality (with room for improvement for visual appeal)
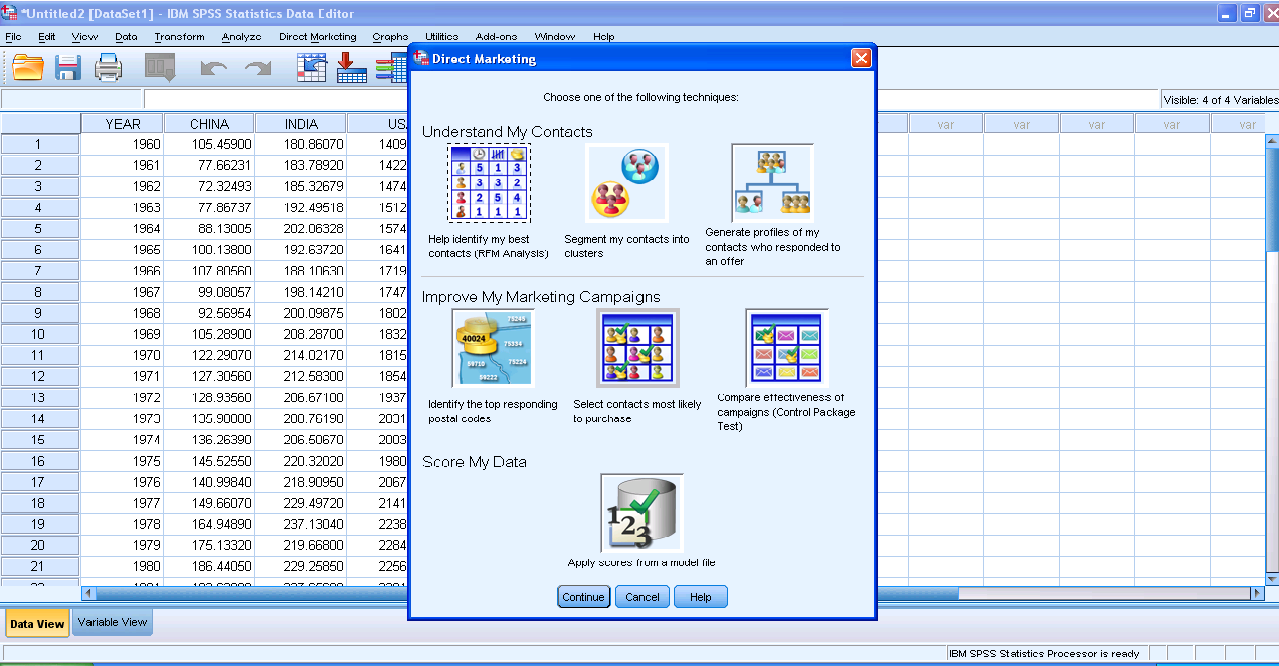
2) Simple Intuitive design to inputting data3) Some options in creating marketing scorecards4) Easy to understand features for a business audiences
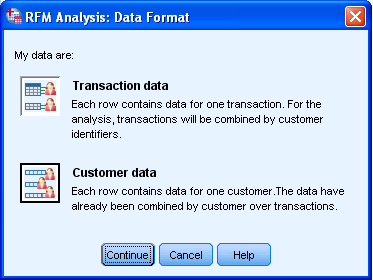
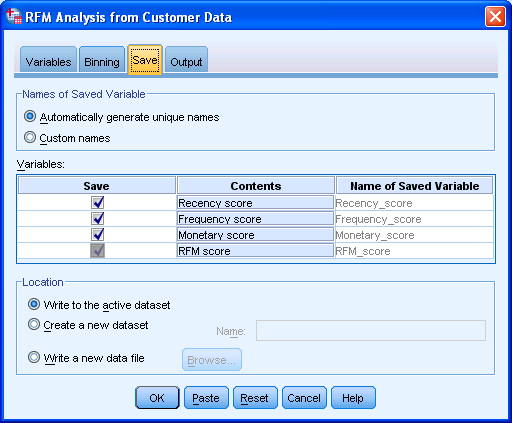
rather than pseudo techie jargon5) Note the clean design of the GUI in specifying data input type6) Again multiple options to export results in a very user friendly manner with options to customize business report7) Graphical output conveniently pasted inside a word document rather than a jumble of images. Auto generated options for customized standard graphs.8) An attractive heatmap to represent monetization for customers. Note the effect that a scale of color shades have in visual representation of data.9) Comparative plots placed side by side with easy to understand explanation (in the output word doc not shown here)10) Auto generated scores attached to data table to enhance usage. 
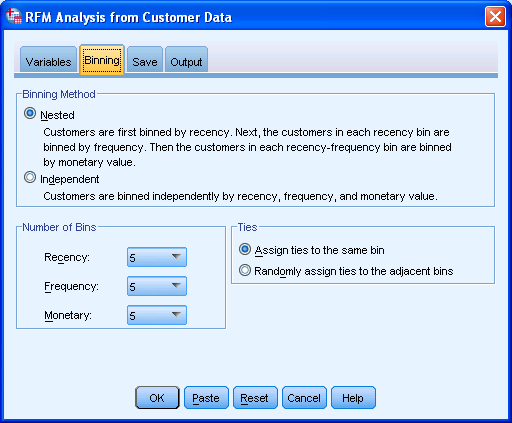
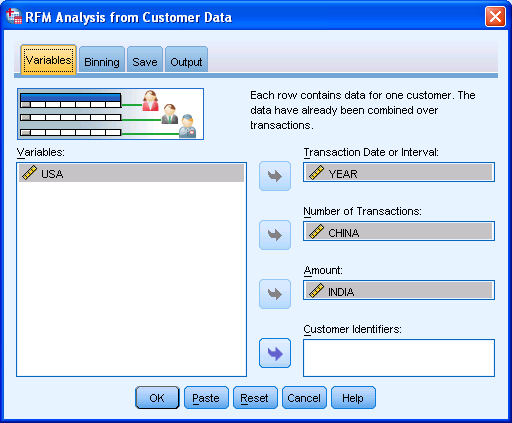
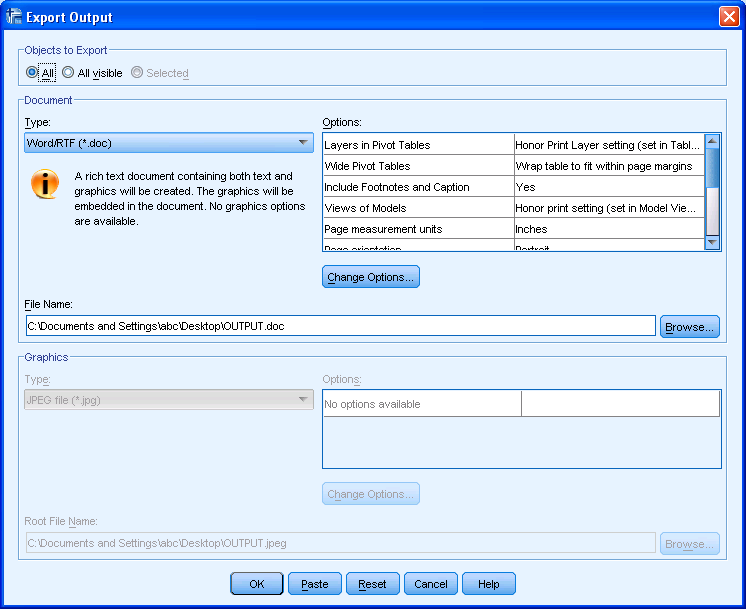
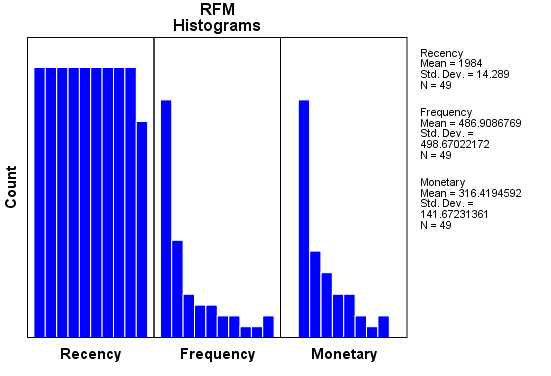
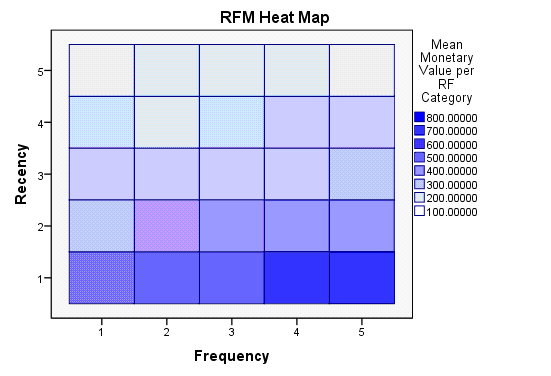
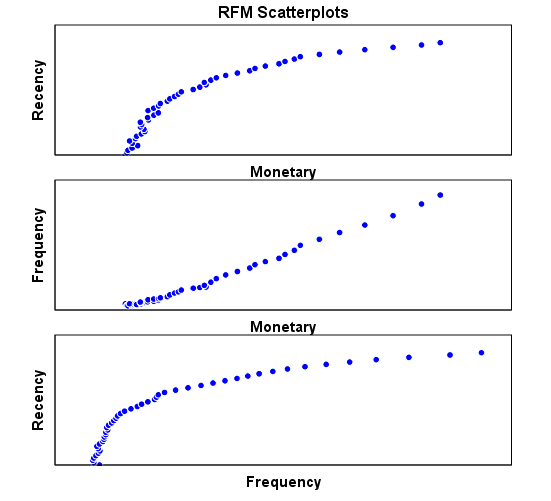
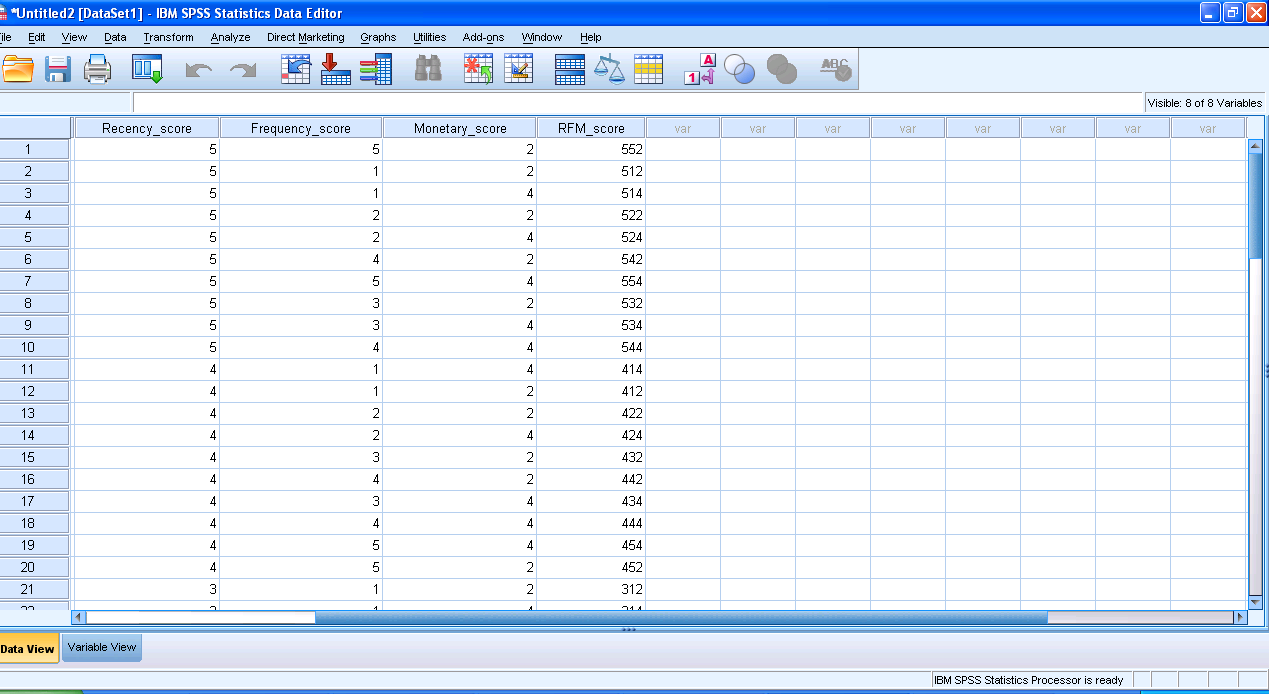
Note here I am evaluating RFM as a marketing technique (which is well known) but also the GUI of IBM SPSS 19 Marketing Analytics. It is simple, and yet powerful into turning what used to be a purely statistical software for nerds into a beautiful easy to implement tool for business users.

So what else can you do in Marketing Analytics with SPSS 19.

IBM SPSS Direct Marketing

The Direct Marketing add-on option allows organizations to ensure their marketing programs are as effective as possible, through techniques specifically designed for direct marketing, including:

• RFM Analysis. This technique identifies existing customers who are most likely to respond to a new offer.

• Cluster Analysis. This is an exploratory tool designed to reveal natural groupings (or clusters) within your data. For example, it can identify different groups of customers based on various demographic and purchasing characteristics.

• Prospect Profiles. This technique uses results from a previous or test campaign to create descriptive profiles. You can use the profiles to target specific groups of contacts in future campaigns.

• Postal Code Response Rates. This technique uses results from a previous campaign to calculate postal code response rates. Those rates can be used to target specific postal codes in future campaigns.

• Propensity to Purchase. This technique uses results from a test mailing or previous campaign to generate propensity scores. The scores indicate which contacts are most likely to respond.

• Control Package Test. This technique compares marketing campaigns to see if there is a significant difference in effectiveness for different packages or offers.

Click here to find out more about Direct Marketing.

Clustering Business Analysts and Industry Analysts

In my interactions with the world at large (mostly online) in the ways of data, statistics and analytics- I come across people who like to call themselves analysts.

As per me, there are 4 kinds of analysts principally,

1) Corporate Analysts- They work for a particular software company. As per them their product is great and infallible, their code has no bugs, and last zillion customer case studies all got a big benefit by buying their software.

They are very good at writing software code themselves, unfortunately this expertise is restricted to Microsoft Outlook (emails) and MS Powerpoint ( presentations). No they are more like salesmen than analysts, but as Arthur Miller said ” All salesmen (person) are dreamers. When the dream dies, the salesman (person) dies (read transfers to bigger job at a rival company)

2) Third -Party Independent Analsyst- The main reason they are third party is they can not be tolerated in a normal corporate culture, their spouse can barely stand them for more than 2 hours a day, and their Intelligence is not matched by their emotional maturity. Alas, after turning independent analysts, they realize they are actually more dependent to people than before, and they quickly polish their behaviour to praise who ever is sponsoring their webinar,  white paper , newsletter, or flying them to junkets. They are more of boutique consultants, but they used to be quite nifty at writing code, when younger, so they call themselves independent and “Noted Industry Analyst”

3) Researcher Analysts- They mostly scrape info from press releases which are mostly written by a hapless overworked communications team thrown at a task at last moment. They get into one hour call with who ever is the press or industry/analyst  relations honcho is- turn the press release into bullet points, and publish on the blog. They call this as research Analysts and give it away for free (but actually couldnt get anyone to pay for it for last 4 years). Couldnt write code if their life depended on it, but usually will find transformation and expert somehwere in their resume/about me web page. May have co -authored a book, which would have gotten them a F for plagiarism had they submitted it as a thesis.

4) Analytical Analysts- They are mostly buried deep within organizational bureaucracies if corporate, or within partnerships if they are independent. Understand coding, innovation (or creativity). Not very aggressive at networking unless provoked by an absolute idiot belonging to first three classes of industry analyst. Prefer to read Atlas Shrugged than argue on business semantics.

Next time you see an industry expert- you know which cluster to classify them 😉

Image Citation-

http://gapingvoidgallery.com/

Creating 3D Graphs with Data in R

Creating 3D graphs  in a 3d scatterplot is a 2 minute task in R using the woderful R Commander GUI. You can see an example video-

I loaded R,                                                                                                                                               then loaded the GUI,                                                                                                                           inputted data (from an attached package) but you can input data from a csv,           then went to Graphs- 3D ScatterPlot.

Here is the result-

and here is the video.

Not bad for 2 minutes of clicking a GUI.

Here is the auto generated code by R Commander.

> data(iris3, package="datasets")
> iris3 <- as.data.frame(iris3)
> names(iris3) <- make.names(names(iris3))
> library(rgl, pos=4)
> library(mgcv, pos=4)
> scatter3d(iris3$Petal.W..Setosa, iris3$Petal.L..Setosa, +   iris3$Sepal.L..Setosa, fit="linear", residuals=TRUE, bg="black", +   axis.scales=TRUE, grid=TRUE, ellipsoid=FALSE, xlab="Petal.W..Setosa", +   ylab="Petal.L..Setosa", zlab="Sepal.L..Setosa")
> scatter3d(iris3$Petal.L..Versicolor, iris3$Petal.L..Setosa, +   iris3$Petal.L..Virginica, fit="linear", residuals=TRUE, bg="white", +   axis.scales=TRUE, grid=TRUE, ellipsoid=FALSE, xlab="Petal.L..Versicolor", +   ylab="Petal.L..Setosa", zlab="Petal.L..Virginica")
> rgl.snapshot("C:/Documents and Settings/abc/Desktop/RGLGraph.png")

Using JMP 9 and R together

An interesting blog post at http://blogs.sas.com/jmp/index.php?/archives/298-JMP-Into-R!.html on using the new JMP 9 with R, and quite possibly using SAS as well.

Example Code-

Here’s the R integration JSL code used to run the bootstrap

rconn = R Connect();
rconn << Submit(“\[
library(boot)

# Load Boot package
library(boot)

RStatFctn <- function(x,d) {return(mean(x[d]))}

b.basic = matrix(data=NA, nrow=1000, ncol=2)
b.normal = matrix(data=NA, nrow=1000, ncol=2)
b.percent =matrix(data=NA, nrow=1000, ncol=2)
b.bca =matrix(data=NA, nrow=1000, ncol=2)

for(i in 1:1000){
rnormdat = rnorm(30,0,1)
b <- boot(rnormdat, RStatFctn, R = 1000)
b.ci=boot.ci(b, conf =095,type=c(“basic”,”norm”,”perc”,”bca”)) b.basic[i,] = b.ci$basic[,4:5]
b.normal[i,] = b.ci$normal[,2:3]
b.percent[i,] = b.ci$percent[,4:5]
b.bca[i,] = b.ci$bca[,4:5]
}
]\”));
b_basic= rconn << Get(b.basic);
b_normal = rconn << Get(b.normal);
b_percent= rconn << Get(b.percent);
b_bca = rconn << Get(b.bca);
rconn << Disconnect();

Using the R Connect() JSL command and assigning it to the object “rconn”, the code sends messages to the JSL scriptable object “rconn” to submit R code via the Submit() command and to retrieve R matrices containing the bootstrap confidence intervals back via the Get() commands.

and I also found interesting what the write has to say about using JMP (for visual analysis) and SAS (bigger datasets handling) and R (for advanced statistics) together

Other standard JMP tools such as the Data Filter can help to explore these results in ways that cannot easily and quickly be done in R

and

With a little JSL and the statistical and graphics platforms of JMP coupled with the breadth and variety of packages and functions in R, one can build complete easy-to-use applications for statistical analysis.

JMP can also integrate with SAS, which adds the ability to work with large-scale data through the file-based system as well as the depth and advanced capabilities of SAS procedures. With these seamless integrations, JMP can become a hub that enables you to connect with both SAS and R, as well as provide unique statistical features such as the JMP Profiler and interactive graphic features such as Graph Builder

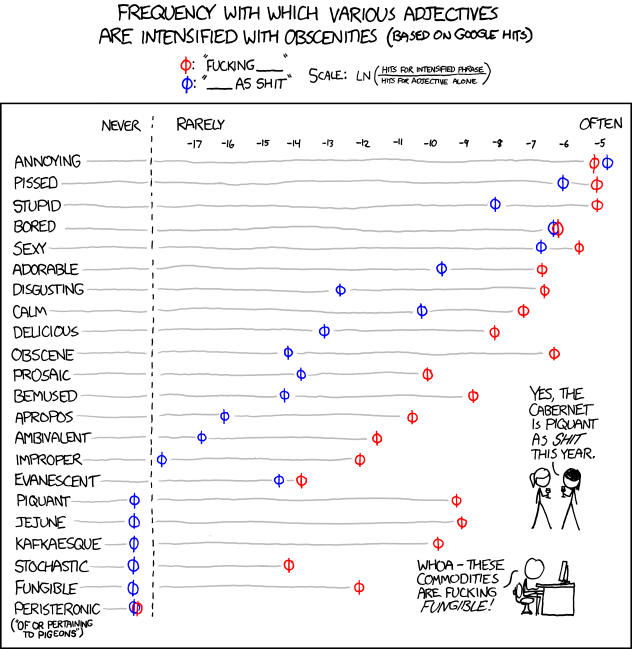
and in the meanwhile here is a data visualization of a frequency analysis of various words bundled together from xkcd.com

When China overtook India- using DEDUCER

I was just reading about the new release of World Bank Data at http://www.r-chart.com/2010/09/new-world-bank-data-available.html Now World Bank Data is something I worked with in the past, but the RWDI package is a great package. (see http://www.r-chart.com/2010/09/new-world-bank-data-available.html)

The whole dataset is a 29 mb in zipped CSV though and is available for terrific macroeconomic analysis _ I downloaded it and loaded it instead.

http://data.worldbank.org/sites/default/files/data/wdiandgdf_csv.zip

I took a small subset of the data –


WDI_GDF_Data <- read.table("C:/Documents and Settings/abc/My Documents/Downloads/WDI_GDF_Data.csv",header=T,sep=",",quote="\"")
 WDI_GDF_Data.sub<-subset(WDI_GDF_Data,Country.Code == "CHN" | Country.Code == "IND" | Country.Code == "USA")
WDI_GDF_Data.sub.sub<-subset(WDI_GDF_Data.sub,Series.Code == "NY.GDP.PCAP.KD")
WDI_GDF_Data.sub.sub<-as.data.frame(t(WDI_GDF_Data.sub.sub))
write.csv(WDI_GDF_Data.sub.sub,'C:/Documents and Settings/abc/Desktop/gdp3.csv')

Note- WordPress.com now supports source code in R via http://en.support.wordpress.com/code/posting-source-code/

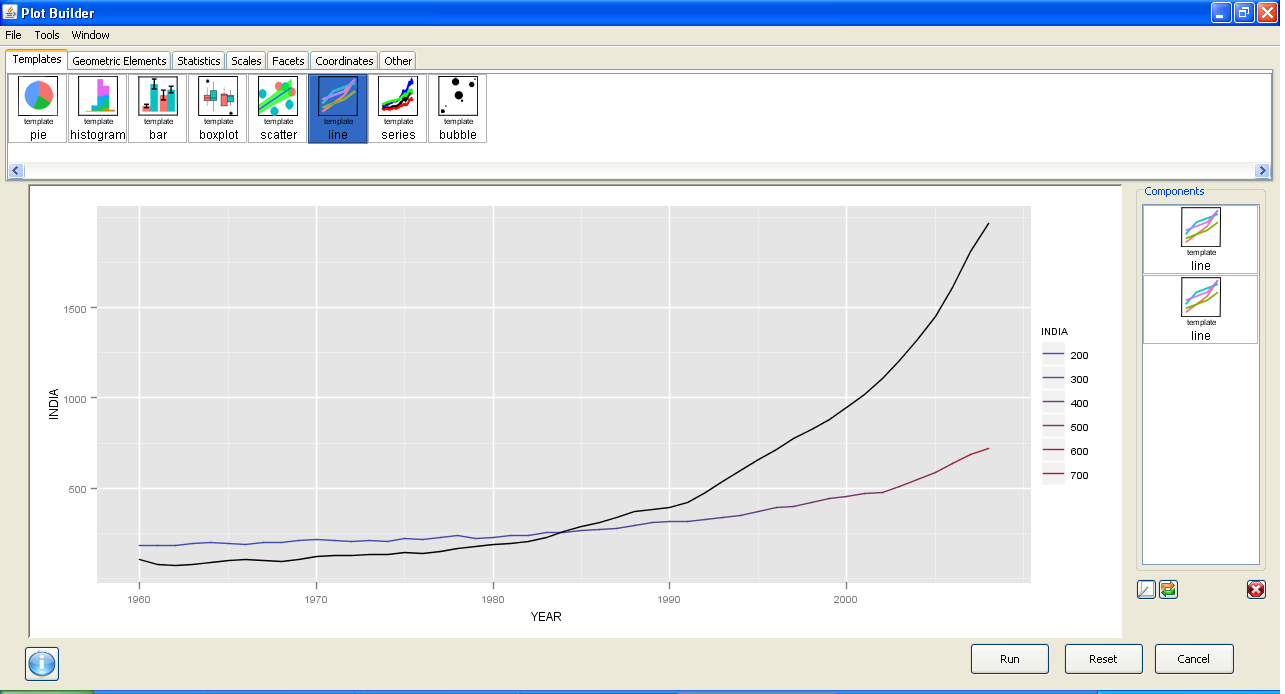
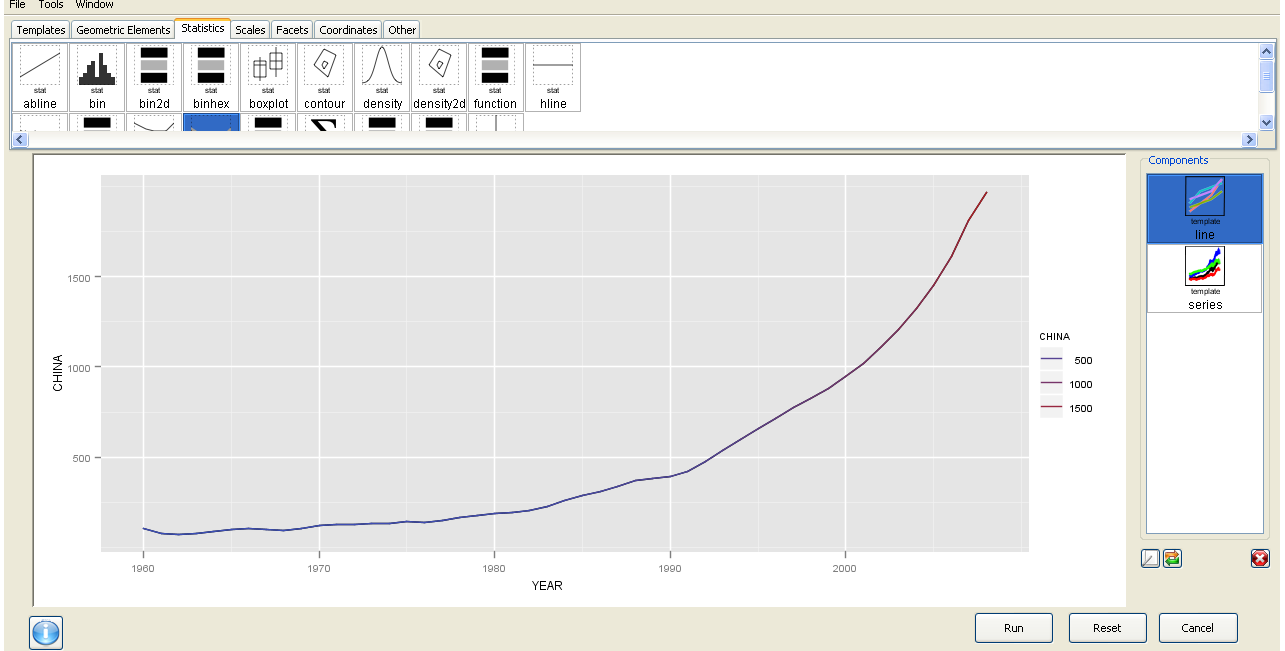
Now this is basic data manipulation- and I used Deducer for it.

The best thing is the ability to use GGPlot using a GUI.
I am now trying to create more complicated plots for example with more than one Y variable but it is still a work in progress. Overall Deducer has made impressive improvements and with the JGR GUI seems very very promising. The look and feel also shows a combination of features (from SPSS ‘s variable and data view)

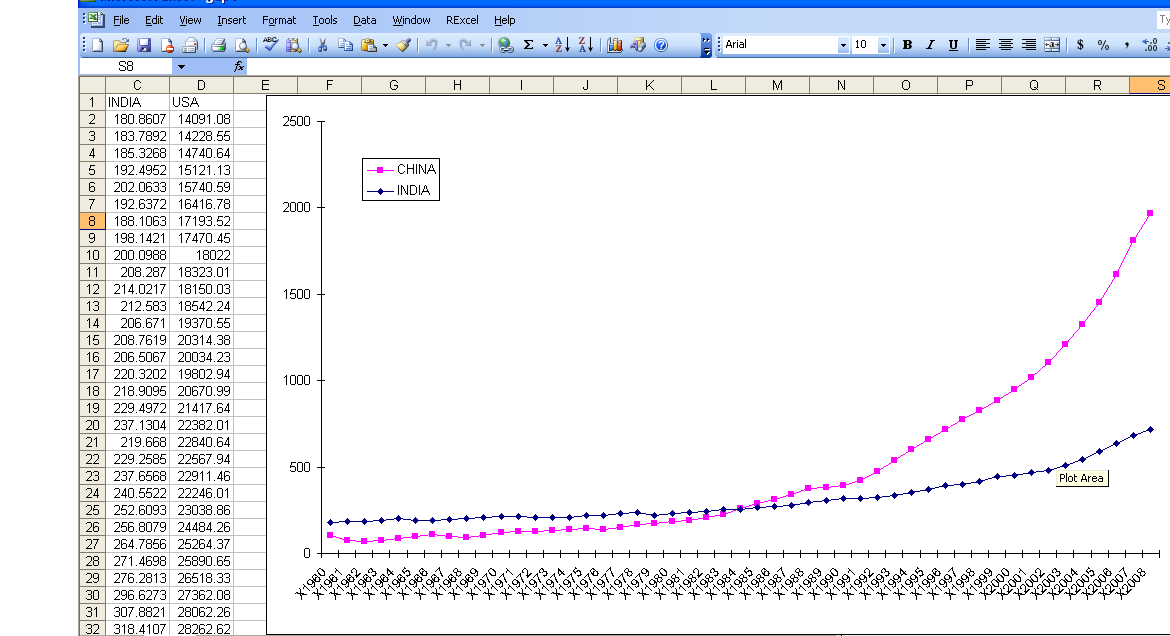
And yes China overtook India in 1985. In GDP per capita. Sigh

GGPLot though overtook Excel graphics as well.


Here is a video which is much better than my screenshots

Hearst DataMining Challenge

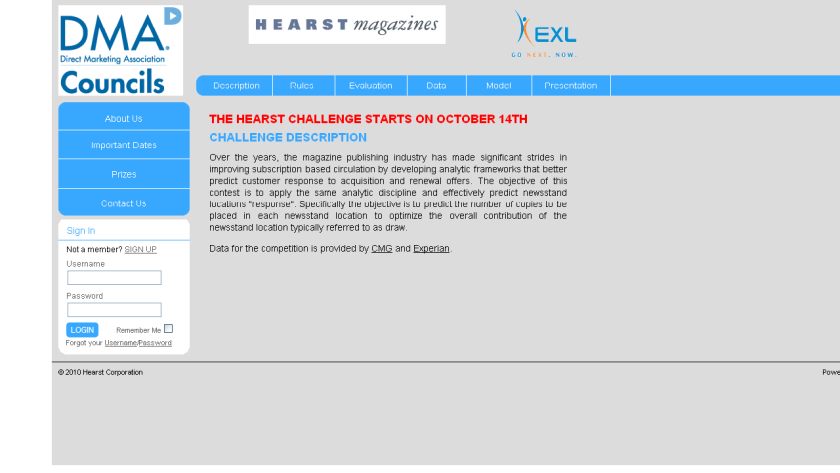
Check out the Hearst Data Mining Challenge- a new competition-sponsored by DMA, Hearst Magazine, and EXL

THE HEARST CHALLENGE STARTS ON OCTOBER 14TH

CHALLENGE

DESCRIPTION

Over the years, the magazine publishing industry has made significant strides in improving subscription based circulation by developing analytic frameworks that better predict customer response to acquisition and renewal offers. The objective of this contest is to apply the same analytic discipline and effectively predict newsstand locations “response”. Specifically the objective is to predict the number of copies to be placed in each newsstand location to optimize the overall contribution of the newsstand location typically referred to as draw.

Data for the competition is provided by CMG and Experian.

and

RULES

HOW TO ENTER: Beginning October 14th, 2010 at 12:01 AM (ET) throughDecember 3rd, 2010 at 11:59 PM (ET) go to the Hearst Challenge website located at http://www.HearstChallenge.com (the “Site”) and complete and submit the entry form pursuant to the onscreen instructions. Entrants will be provided a historical sample of newsstand location draw, sales and associated location level data to help develop their predictive algorithm. Hearst will in turn hold back two distinct sets of draw/sales data, one to be used as a validation set by the contestant and one to be used as a final contest evaluation set. Entrants may not include any other external variables for the challenge. Additional details will be provided with the data. Entrants will be able to track their performance against the validation set throughout the course of the challenge via a leader tracking board to be made available on the Site. Entries must include the following documentation:

  • Data file with id variables and expected sales values by store and publication
  • The final model/ algorithm code used to score the final data set
  • Any supporting documentation that pertains to the development of the submitted model/algorithm including variable creation. Variables that were used in the model need to be traced through from input to coefficient / node (if using a tree based methodology).

Check out http://www.hearstchallenge.com/index.php for further details.

Making NeW R

Tal G in his excellent blog piece talks of “Why R Developers  should not be paid” http://www.r-statistics.com/2010/09/open-source-and-money-why-r-developers-shouldnt-be-paid/

His argument of love is not very original though it was first made by these four guys

I am going to argue that “some” R developers should be paid, while the main focus should be volunteers code. These R developers should be paid as per usage of their packages.

Let me expand.

Imagine the following conversation between Ross Ihaka, Norman Nie and Peter Dalgaard.

Norman- Hey Guys, Can you give me some code- I got this new startup.

Ross Ihaka and Peter Dalgaard- Sure dude. Here is 100,000 lines of code, 2000 packages and 2 decades of effort.

Norman- Thanks guys.

Ross Ihaka- Hey, What you gonna do with this code.

Norman- I will better it. Sell it. Finally beat Jim Goodnight and his **** Proc GLM and **** Proc Reg.

Ross- Okay, but what will you give us? Will you give us some code back of what you improve?

Norman – Uh, let me explain this open core …

Peter D- Well how about some royalty?

Norman- Sure, we will throw parties at all conferences, snacks you know at user groups.

Ross – Hmm. That does not sound fair. (walks away in a huff muttering)-He takes our code, sells it and wont share the code

Peter D- Doesnt sound fair. I am back to reading Hamlet, the great Dane, and writing the next edition of my book. I am glad I wrote a book- Ross didnt even write that.

Norman-Uh Oh. (picks his phone)- Hey David Smith, We need to write some blog articles pronto – these open source guys ,man…

———–I think that sums what has been going on in the dynamics of R recently. If Ross Ihaka and R Gentleman had adopted an open core strategy- meaning you can create packages to R but not share the original where would we all be?

At this point if he is reading this, David Smith , long suffering veteran of open source  flameouts is rolling his eyes while Tal G is wondering if he will publish this on R Bloggers and if so when or something.

Lets bring in another R veteran-  Hadley Wickham who wrote a book on R and also created ggplot. Thats the best quality, most often used graphics package.

In terms of economic utilty to end user- the ggplot package may be as useful if not more as the foreach package developed by Revolution Computing/Analytics.

Now http://cran.r-project.org/web/packages/foreach/index.html says that foreach is licensed under http://www.apache.org/licenses/LICENSE-2.0

However lets come to open core licensing ( read it here http://alampitt.typepad.com/lampitt_or_leave_it/2008/08/open-core-licen.html ) which is where the debate is- Revolution takes code- enhances it (in my opinion) substantially with new formats XDF for better efficieny, web services API, and soon coming next year a GUI (thanks in advance , Dr Nie and guys)

and sells this advanced R code to businesses happy to pay ( they are currently paying much more to DR Goodnight and HIS guys)

Why would any sane customer buy it from Revolution- if he could download exactly the same thing from http://r-project.org

Hence the business need for Revolution Analytics to have an enhanced R- as they are using a product based software model not software as a service model.

If Revolution gives away source code of these new enhanced codes to R core team- how will R core team protect the above mentioned intelectual property- given they have 2 decades experience of giving away free code , and back and forth on just code.

Now Revolution also has a marketing budget- and thats how they sponsor some R Core events, conferences, after conference snacks.

How would people decide if they are being too generous or too stingy in their contribution (compared to the formidable generosity of SAS Institute to its employees, stakeholders and even third party analysts).

Would it not be better- IF Revolution can shift that aspect of relationship to its Research and Development budget than it’s marketing budget- come with some sort of incentive for “SOME” developers – even researchers need grants and assistantships, scholarships, make a transparent royalty formula say 17.5 % of the NEW R sales goes to R PACKAGE Developers pool, which in turn examines usage rate of packages and need/merit before allocation- that would require Revolution to evolve from a startup to a more sophisticated corporate and R Core can use this the same way as John M Chambers software award/scholarship

Dont pay all developers- it would be an insult to many of them – say Prof Harrell creator of HMisc to accept – but can Revolution expand its dev base (and prospect for future employees) by even sponsoring some R Scholarships.

And I am sure that if Revolution opens up some more code to the community- they would the rest of the world and it’s help useful. If it cant trust people like R Gentleman with some source code – well he is a board member.

——————————————————————————————–

Now to sum up some technical discussions on NeW R

1)  An accepted way of benchmarking efficiencies.

2) Code review and incorporation of efficiencies.

3) Multi threading- Multi core usage are trends to be incorporated.

4) GUIs like R Commander E Plugins for other packages, and Rattle for Data Mining to have focussed (or Deducer). This may involve hiring User Interface Designers (like from Apple 😉  who will work for love AND money ( Even the Beatles charge royalty for that song)

5) More support to cloud computing initiatives like Biocep and Elastic R – or Amazon AMI for using cloud computers- note efficiency arguements dont matter if you just use a Chrome Browser and pay 2 cents a hour for an Amazon Instance. Probably R core needs more direct involvement of Google (Cloud OS makers) and Amazon as well as even Salesforce.com (for creating Force.com Apps). Note even more corporates here need to be involved as cloud computing doesnot have any free and open source infrastructure (YET)

_______________________________________________________

Debates will come and go. This is an interesting intellectual debate and someday the liitle guys will win the Revolution-

From Hugh M of Gaping Void-

http://www.gapingvoid.com/Moveable_Type/archives/cat_microsoft_blue_monster_series.html

HOW DOES A SOFTWARE COMPANY MAKE MONEY, IF ALL

SOFTWARE IS FREE?

“If something goes wrong with Microsoft, I can phone Microsoft up and have it fixed. With Open Source, I have to rely on the community.”

And the community, as much as we may love it, is unpredictable. It might care about your problem and want to fix it, then again, it may not. Anyone who has ever witnessed something online go “viral”, good or bad, will know what I’m talking about.

and especially-

http://gapingvoid.com/2007/04/16/how-well-does-open-source-currently-meet-the-needs-of-shareholders-and-ceos/

Source-http://gapingvoidgallery.com/

Kind of sums up why the open core licensing is all about.