
There are multiple packages in R to read data straight from online datasets.
These are as follows- Continue reading “Using #Rstats for online data access”
Tag: world bank data
When China overtook India- using DEDUCER
I was just reading about the new release of World Bank Data at http://www.r-chart.com/2010/09/new-world-bank-data-available.html Now World Bank Data is something I worked with in the past, but the RWDI package is a great package. (see http://www.r-chart.com/2010/09/new-world-bank-data-available.html)
The whole dataset is a 29 mb in zipped CSV though and is available for terrific macroeconomic analysis _ I downloaded it and loaded it instead.
http://data.worldbank.org/sites/default/files/data/wdiandgdf_csv.zip
I took a small subset of the data –
WDI_GDF_Data <- read.table("C:/Documents and Settings/abc/My Documents/Downloads/WDI_GDF_Data.csv",header=T,sep=",",quote="\"")
 WDI_GDF_Data.sub<-subset(WDI_GDF_Data,Country.Code == "CHN" | Country.Code == "IND" | Country.Code == "USA")
WDI_GDF_Data.sub.sub<-subset(WDI_GDF_Data.sub,Series.Code == "NY.GDP.PCAP.KD")
WDI_GDF_Data.sub.sub<-as.data.frame(t(WDI_GDF_Data.sub.sub))
write.csv(WDI_GDF_Data.sub.sub,'C:/Documents and Settings/abc/Desktop/gdp3.csv')
Note- WordPress.com now supports source code in R via http://en.support.wordpress.com/code/posting-source-code/
Now this is basic data manipulation- and I used Deducer for it.
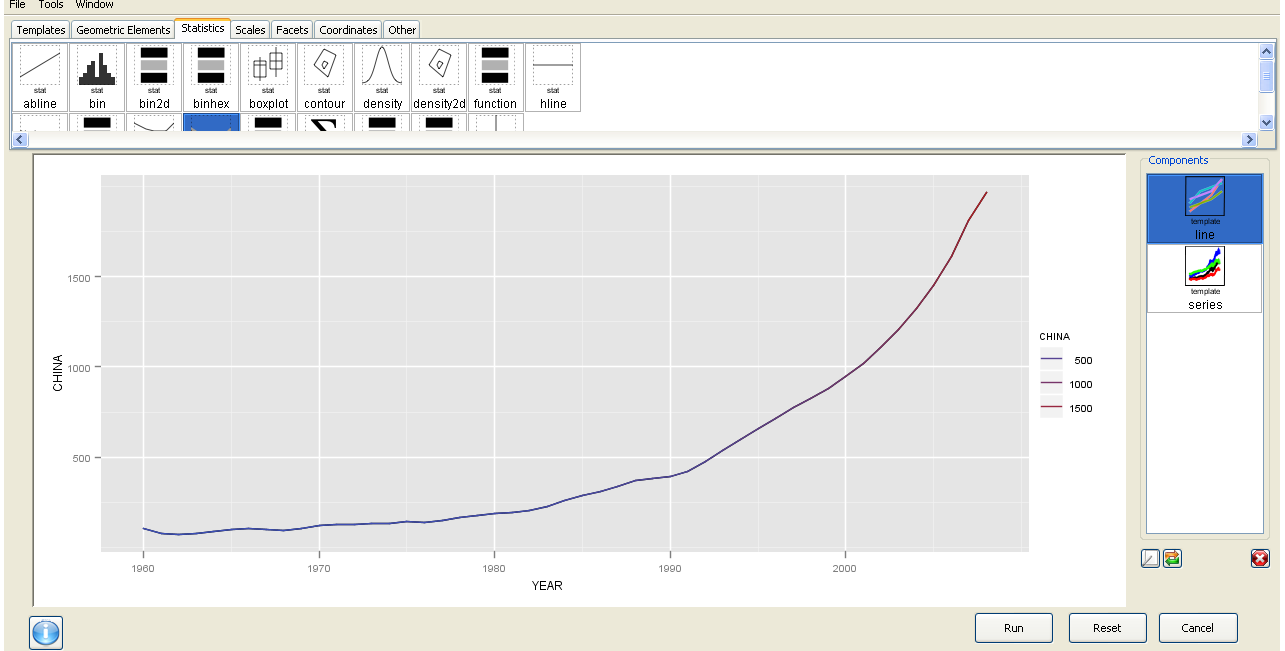
The best thing is the ability to use GGPlot using a GUI.
I am now trying to create more complicated plots for example with more than one Y variable but it is still a work in progress. Overall Deducer has made impressive improvements and with the JGR GUI seems very very promising. The look and feel also shows a combination of features (from SPSS ‘s variable and data view)
And yes China overtook India in 1985. In GDP per capita. Sigh
GGPLot though overtook Excel graphics as well.


Here is a video which is much better than my screenshots
