Top 10 Games on Linux -sudo update

The phrase "Doom clone" was initiall...
Image via Wikipedia

Here are some cool games I like to play on my Ubuntu 10.10 – I think they run on most other versions of Linux as well. 1) Open ArenaFirst person Shooter– This is like Quake Arena- very very nice graphics and good for playing for a couple of hours while taking a break. It is available here- http://openarena.ws/smfnews.php ideally if you have a bunch of gaming friends, playing on a local network or internet is quite mind blowing entertaining. And it’s free! 2) Armagetron– This is based on the TRON game of light cycles-It is available here at http://www.armagetronad.net/ or you can use Synaptic packages manager for all the games mentioned here

If violence or cars is not your stuff and you like puzzles like Sudoko, well just install the application Sudoko from http://gnome-sudoku.sourceforge.net/ Also recommended for people of various ages as it has multiple levels.
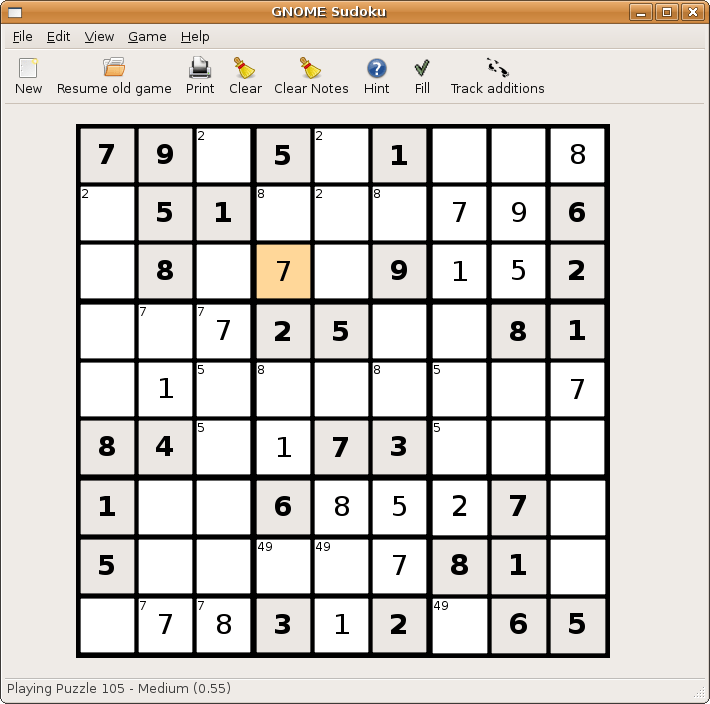
If you ever liked Pinball play the open source version from download at http://pinball.sourceforge.net/ Alternatively you can go to Ubuntu Software Centre>Games>Arcade>Emilio>Pinball and you can also build your own pinball if you like the game well enough. 5) Pacman/Njam- Clone of the original classic game.  Downloadable from http://www.linuxcompatible.org/news/story/pacman_for_linux.html 6) Gweled– This is free clone version of Bejeweled. It now has a new website at http://gweled.org/ http://linux.softpedia.com/progDownload/Gweled-Download-3449.html

Gweled is a GNOME version of a popular PalmOS/Windows/Java game called “Bejeweled” or “Diamond Mine”. The aim of the game is to make alignment of 3 or more gems, both vertically or horizontally by swapping adjacent gems. The game ends when there are no possible moves left. Here are some key features of “Gweled”: · exact same gameplay as the commercial versions · SVG original graphics

7) Hearts – For this card game classis you can use Ubuntu software to install the package or go to http://linuxappfinder.com/package/gnome-hearts 8) Card Games- KPatience has almost 14 card games including solitaire, and free cell. 9) Sauerbraten -First person shooter with good network play, edit maps capabilities. You can read more here- http://sauerbraten.org/ 10) Tetris-KBlocks Tetris is the classic game. If you like classic slow games- Tetris is the best. and I like the toughest Tetris game -Bastet http://fph.altervista.org/prog/bastet.html Even an xkcd toon for it

Protected: Using SAS and C/C++ together

This content is password-protected. To view it, please enter the password below.

Google Cloud Print -print documents from the internet

Print Jobs just got easier- especially if you prefer one printer, use Google Chrome, and can take 2 minutes to set up your printer to print from anywhere in the world through the internet.

It’s called Google Cloud Print– and it makes my life a lot easier when I travel and need to give to printer at home some documents to print rather than rely on external printers. See screenshots below and check out http://www.google.com/cloudprint/ for more

Heritage Health Prize- Data Mining Contest for 3mill USD

An animation of the quicksort algorithm sortin...
Image via Wikipedia

If Netflix was about 1 mill USD to better online video choices, here is a chance to earn serious money, write great code, and save lives!

From http://www.heritagehealthprize.com/

Heritage Health Prize
Launching April 4

Laptop

More than 71 Million individuals in the United States are admitted to
hospitals each year, according to the latest survey from the American
Hospital Association. Studies have concluded that in 2006 well over
$30 billion was spent on unnecessary hospital admissions. Each of
these unnecessary admissions took away one hospital bed from someone
else who needed it more.

Prize Goal & Participation

The goal of the prize is to develop a predictive algorithm that can identify patients who will be admitted to the hospital within the next year, using historical claims data.

Official registration will open in 2011, after the launch of the prize. At that time, pre-registered teams will be notified to officially register for the competition. Teams must consent to be bound by final competition rules.

Registered teams will develop and test their algorithms. The winning algorithm will be able to predict patients at risk for an unplanned hospital admission with a high rate of accuracy. The first team to reach the accuracy threshold will have their algorithms confirmed by a judging panel. If confirmed, a winner will be declared.

The competition is expected to run for approximately two years. Registration will be open throughout the competition.

Data Sets

Registered teams will be granted access to two separate datasets of de-identified patient claims data for developing and testing algorithms: a training dataset and a quiz/test dataset. The datasets will be comprised of de-identified patient data. The datasets will include:

  • Outpatient encounter data
  • Hospitalization encounter data
  • Medication dispensing claims data, including medications
  • Outpatient laboratory data, including test outcome values

The data for each de-identified patient will be organized into two sections: “Historical Data” and “Admission Data.” Historical Data will represent three years of past claims data. This section of the dataset will be used to predict if that patient is going to be admitted during the Admission Data period. Admission Data represents previous claims data and will contain whether or not a hospital admission occurred for that patient; it will be a binary flag.

DataThe training dataset includes several thousand anonymized patients and will be made available, securely and in full, to any registered team for the purpose of developing effective screening algorithms.

The quiz/test dataset is a smaller set of anonymized patients. Teams will only receive the Historical Data section of these datasets and the two datasets will be mixed together so that teams will not be aware of which de-identified patients are in which set. Teams will make predictions based on these data sets and submit their predictions to HPN through the official Heritage Health Prize web site. HPN will use the Quiz Dataset for the initial assessment of the Team’s algorithms. HPN will evaluate and report back scores to the teams through the prize website’s leader board.

Scores from the final Test Dataset will not be made available to teams until the accuracy thresholds are passed. The test dataset will be used in the final judging and results will be kept hidden. These scores are used to preserve the integrity of scoring and to help validate the predictive algorithms.

Teams can begin developing and testing their algorithms as soon as they are registered and ready. Teams will log onto the official Heritage Health Prize website and submit their predictions online. Comparisons will be run automatically and team accuracy scores will be posted on the leader board. This score will be only on a portion of the predictions submitted (the Quiz Dataset), the additional results will be kept back (the Test Dataset).

Form

Once a team successfully scores above the accuracy thresholds on the online testing (quiz dataset), final judging will occur. There will be three parts to this judging. First, the judges will confirm that the potential winning team’s algorithm accurately predicts patient admissions in the Test Dataset (again, above the thresholds for accuracy).

Next, the judging panel will confirm that the algorithm does not identify patients and use external data sources to derive its predictions. Lastly, the panel will confirm that the team’s algorithm is authentic and derives its predictive power from the datasets, not from hand-coding results to improve scores. If the algorithm meets these three criteria, it will be declared the winner.

Failure to meet any one of these three parts will disqualify the team and the contest will continue. The judges reserve the right to award second and third place prizes if deemed applicable.


Google Refine

An interesting data cleaning software from Google at

https://code.google.com/p/google-refine/

From the page at

https://code.google.com/p/google-refine/wiki/UserGuide

The Basics

First, although Google Refine might start out looking like a spreadsheet program (Microsoft Excel, Google Spreadsheets, etc.), don’t expect it to work like a spreadsheet program. That’s almost like expecting a database to work like a text editor.

Google Refine is NOT for entering new data one cell at a time. It is NOT for doing accounting.

Google Refine is for applying transformations over many existing cells in bulk, for the purpose of cleaning up the data, extending it with more data from other sources, and getting it to some form that other tools can consume.

To use Google Refine, think in big patterns. For example, to spot errors, think

  • Show me every row where the string length of the customer’s name is longer than 50 characters (because I suspect that the customer’s address is mistakenly included in the name field)
  • Show me every row where the contract fee is less than 1 (because I suspect the fee was entered in unit of thousand dollars rather than dollars)
  • Show me every row where the description field (scraped from some web site) contains “&” (because I suspect it wasn’t decoded properly)

To edit data, think

  • For every row where the contract fee is less than 1, multiply the fee by 1000.
  • For every row where the customer name contains a comma (it has been entered as “last_name, first_name”), split the name by the comma, reverse the array, and join it back with a space (producing “first_name last_name”)

To specify patterns, use filters and facets. Typically, you create a filter or facet on a particular column. For example, you can create a numeric facet on the “contract fee” column and adjust its range selector to select values less than 1. If the default facet doesn’t do what you want, you can configure it (by clicking “change” on the facet’s header). For example, you can create a text facet with on the same “contract fee” column with this expression:

  value < 1

It will show 2 choices: true and false. Just select true. Then, invoke the Transform command on that same column and enter the expression

  value * 1000

That Transform command affects only rows where the “contract fee” cell contains a value less than 1.

You can use several filters and facets together. Only rows that are selected by all facets and filters will be shown in the data table. For example, say you have two text facets, one on the “contract fee” column with the expression

  value < 1

and another on the “state” column (with the default expression). If you select “true” in the first facet and “Nevada” in the second, then you will only see rows for contracts in Nevada with fees less than 1.

Analogies

Databases

If you have programmed databases before (performing SQL queries), then what Google Refine works should be quite familiar to you. Creating filters and facets and selecting something in them is like performing this SELECT statement:

  SELECT *
  WHERE ... constraints determined by selection in facets and filters ...

And invoking the Transform command on a column while having some filters and facets selected is like performing this UPDATE statement

  UPDATE whole_table SET column_X = ... expression ...
  WHERE ... constraints determined by selection in facets and filters ...

The difference between Google Refine and databases is that the facets show you choices that you can select, whereas databases assume that you already know what’s in the data.


HIGHLIGHTS from REXER Survey :R gives best satisfaction

Simple graph showing hierarchical clustering. ...
Image via Wikipedia

A Summary report from Rexer Analytics Annual Survey


HIGHLIGHTS from the 4th Annual Data Miner Survey (2010):


•   FIELDS & GOALS: Data miners work in a diverse set of fields.  CRM / Marketing has been the #1 field in each of the past four years.  Fittingly, “improving the understanding of customers”, “retaining customers” and other CRM goals are also the goals identified by the most data miners surveyed.


•   ALGORITHMS: Decision trees, regression, and cluster analysis continue to form a triad of core algorithms for most data miners.  However, a wide variety of algorithms are being used.  This year, for the first time, the survey asked about Ensemble Models, and 22% of data miners report using them.
A third of data miners currently use text mining and another third plan to in the future.


•   MODELS: About one-third of data miners typically build final models with 10 or fewer variables, while about 28% generally construct models with more than 45 variables.


•   TOOLS: After a steady rise across the past few years, the open source data mining software R overtook other tools to become the tool used by more data miners (43%) than any other.  STATISTICA, which has also been climbing in the rankings, is selected as the primary data mining tool by the most data miners (18%).  Data miners report using an average of 4.6 software tools overall.  STATISTICA, IBM SPSS Modeler, and R received the strongest satisfaction ratings in both 2010 and 2009.


•   TECHNOLOGY: Data Mining most often occurs on a desktop or laptop computer, and frequently the data is stored locally.  Model scoring typically happens using the same software used to develop models.  STATISTICA users are more likely than other tool users to deploy models using PMML.


•   CHALLENGES: As in previous years, dirty data, explaining data mining to others, and difficult access to data are the top challenges data miners face.  This year data miners also shared best practices for overcoming these challenges.  The best practices are available online.


•   FUTURE: Data miners are optimistic about continued growth in the number of projects they will be conducting, and growth in data mining adoption is the number one “future trend” identified.  There is room to improve:  only 13% of data miners rate their company’s analytic capabilities as “excellent” and only 8% rate their data quality as “very strong”.


Please contact us if you have any questions about the attached report or this annual research program.  The 5th Annual Data Miner Survey will be launching next month.  We will email you an invitation to participate.


Information about Rexer Analytics is available at www.RexerAnalytics.com. Rexer Analytics continues their impressive journey see http://www.rexeranalytics.com/Clients.html

|My only thought- since most data miners are using multiple tools including free tools as well as paid software, Perhaps a pie chart of market share by revenue and volume would be handy.

Also some ideas on comparing diverse data mining projects by data size, or complexity.