
On my second day of bludering about high technology, I came across http://rgrossman.com/2009/05/17/running-r-on-amazons-ec2/ which describes how to run R on Amazon EC2.
I tried it out and have subsequently added some screenshots to this tutorial so as to help you run R. My intention of course was to run a R GUI preferable Revolution Enterprise on the Amazon EC 2- and crunch uhm a lot of data.
Now go through the steps as follows-
0) Logging onto Amazon Console
Note you need your Amazon Id (even the same id which you use for buying books).
Note we are into Amazon EC2 as shown by the upper tab. Click upper tab to get into the Amazon EC2
2) Choosing the right AMI-
On the left margin, you can click AMI -Images.
Now you can search for the image-
I chose Ubuntu images (linux images are cheaper) and opendata in the search as belows- I get two images.
You can choose whether you want 32 bit or 64 bit image. Thumb rule- 64 bit images are preferable for data intensive tasks.

Click on launch instance in the upper tab ( near the search feature)
2) A pop up comes up, which shows the 5 step process to launch your computing.
Choose the right compute instance- As the screenshot shows- there are various compute instances and they all are at different multiples of prices or compute units.

After choosing the compute instance of your choice (extra large is highlighted)- click on continue-
3) Instance Details-

I did not choose cloudburst monitoring as it has a extra charge- and I am just trying out things.So I simply clicked continue.
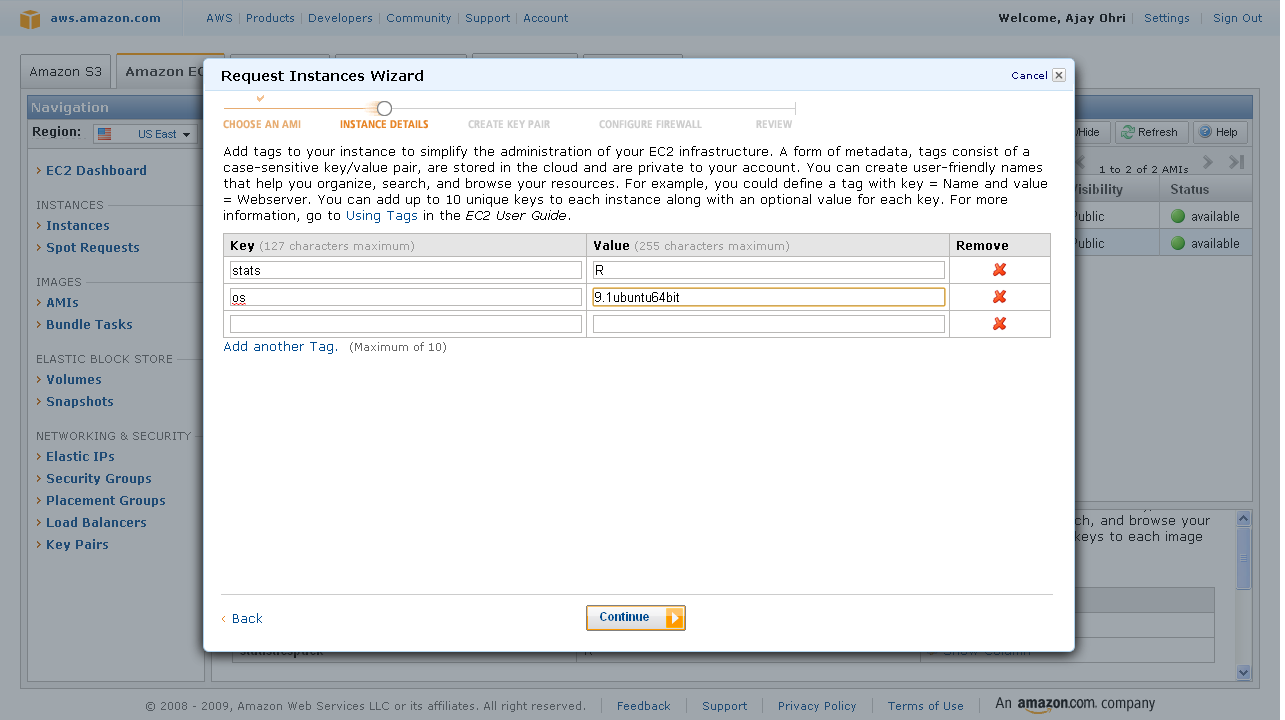
4) Add Tag Details- If you are running a lot of instances you need to create your own tags to help you manage them. Advisable if you are running many instances.

Since I am going to run just one- I clicked continue with adding just two things OS and Stats Package.
5) Create a key pair- A key pair is an added layer of encryption. Click on create new pair and name it (note the name will be handy in coming steps)

6)
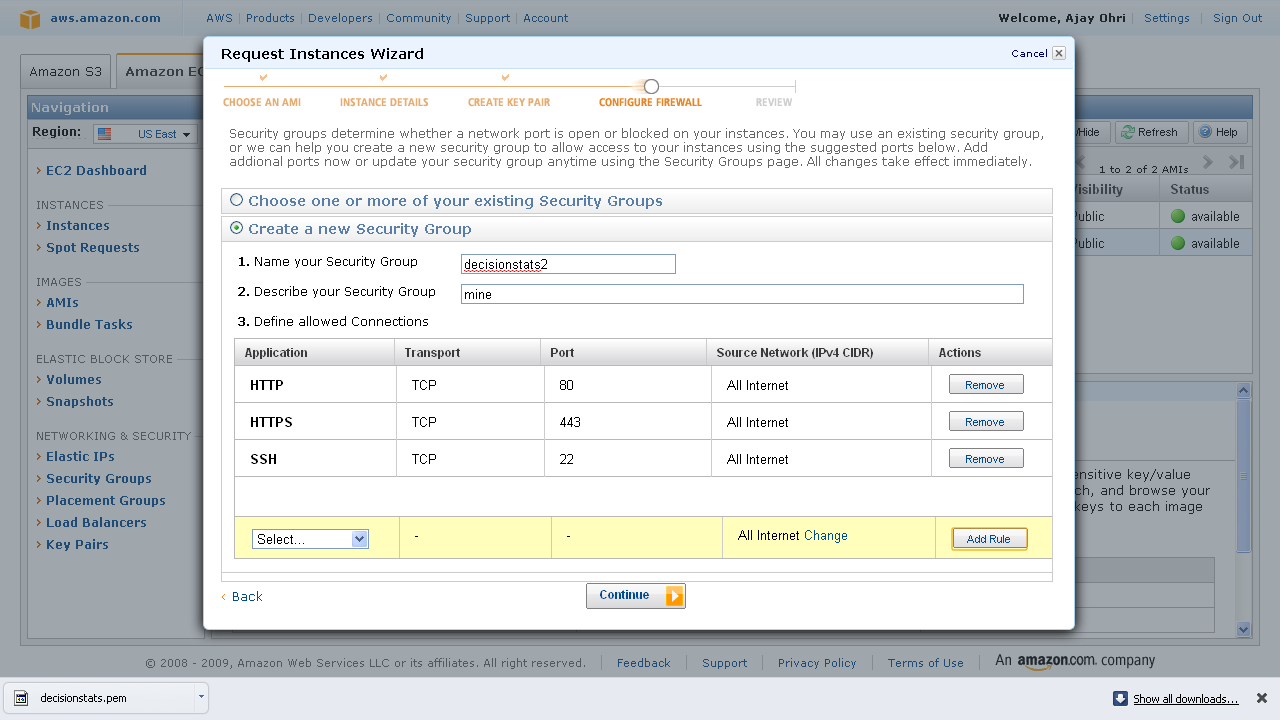
After clicking and downloading the key pair- you come into security groups. Security groups is just a set of instructions to help keep your data transfer secure. So I created a new security group.

And I added some ways in security group to connect (like SSH using Port 22)

7) Last step- Review Details and Click Launch

8) On the Left margin click on instances ( you were in Images.>AMI earlier)
It will take some 3-5 minutes to launch an instance. You can see status as pending till then.

9) Pending instance as shown by yellow light-

10) Once the instance is running -it is shown by a green light.

Click on the check box, and on upper tab go to instance actions. Click on connect-

you see a popup with instructions like these-
chmod to make sure your key file isn’t publicly viewable, ssh won’t work otherwise:chmod 400 decisionstats.pemExample
IMPORTANT-
If you are choosing Ubuntu Terminal to connect- you need to change the word root from above to Ubuntu above.
12) To launch R, just type R at the terminal
If all goes well you should be able to see this-

choose to install any custom packages (like
install.packages(‘doSNOW’)
work on R using command line
13) IMPORTANT- After doing your R work, please CLOSE your instance (
Go to LEFT Margin-Instances-Check the check box of instance you are running- on upper tab- Instance Actions- Click Terminate.
Amazon EC2 Ubuntu 8.10 intrepid AMI built by Eric Hammond; Eduardo Leoni added R, many R packages, JAGS, mysql-client and subversion.
| Submitted By: | Eduardo L Leoni |
|---|---|
| US East AMI ID: | ami-1b9b7c72 |
| AMI Manifest: | PolMethImages/imageR64.manifest.xml |
| License: | Public |
| Operating System: | Linux/Uni
|
| AMI ID: ami-8ba347e2 | ||
| Name:– | ||
| Description:– | ||
| Source:redhat-cloud/RHEL-5-Server/5.2/x86_64/Beta-2.6.18-92.1.1/RHEL5.2-Server-x86_64-Beta-2.6.18-92.1.1.manifest.xml | ||
| Owner:432018295444 | Visibility:Public | Product Code:54DBF944 |
| State:available | Kernel ID:aki-89a347e0 | RAM Disk ID:ari-88a347e1 |
| Image Type:machine | Architecture:x86_64 | Platform:Red Hat |
| Root Device Type:instance-store | Root Device:– | Image Size:0 bytes |
| Block Devices:N/A – Instance Store | ||
| Virtualization:paravirtual | ||


![[ Image of Variable Sheet ]](https://i0.wp.com/www.gnu.org/software/pspp/images/variable-sheet-thumb.png) The most important of these exceptions are, that there are no “time bombs”; your copy of PSPP will not “expire” or deliberately stop working in the future. Neither are there any artificial limits on the number of cases or variables which you can use. There are no additional packages to purchase in order to get “advanced” functions; all functionality that PSPP currently supports is in the core package.
The most important of these exceptions are, that there are no “time bombs”; your copy of PSPP will not “expire” or deliberately stop working in the future. Neither are there any artificial limits on the number of cases or variables which you can use. There are no additional packages to purchase in order to get “advanced” functions; all functionality that PSPP currently supports is in the core package.
