Economic: Indian Caste System -Simplification

I am often asked by Western and non Indian people regarding the caste system. It trips me a lot trying to explain the complexity, necessity and current scenario given the history.

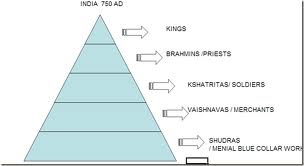
Here is an effort- The Indian /Hindu caste system was primarily an economic system to divide labor. In the original Manusmriti ,named by the King Manu- it was flexible.

A son of blue collar worker could become a warrior if he was brave etc.

A couple of centuries later – the top castes primarily the priests decided to make it rigid. No more social intermingling or marriage between castes, and no more migration of occupation regardless of merit.

This led to a lot of lower caste people leaving Hinduism to join religions like Islam ( post 1000 AD, Muslim Invasions and Mughal Rule) and Christianity ( post the arrival of English).
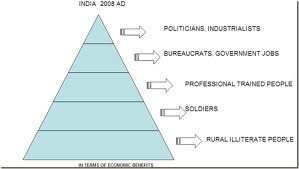
Post 1947 , many of “lower castes” preferred to remain within Hinduism but adopted Buddhism as their primary worship mechanism.Also India‘s leaders in the 1940’s , many of whom were educated in UK as lawyers ( including Mahatma Gandhi, Subhash Chandra Bose, Jawahar Lal Nehru) decided this system had weakened the nation state and divided the energies of India, besides being obviously inhumane and degrading.

The Constitution of India was shepharded in 1950  by an assembly led by Dr. B R Ambedkar , one of the very first educated lower castes ( also called Harijan , after Mahatma Gandhi’s name for them, literally Hari -Jan people of the Lord).That Cosntitution endures as India remains the finest example of a Democracy in the non Western world.

The Indian constitution established 7.5 % jobs reservation in Government jobs and educational institutes at a college and masters level only for lowest and most educationally backward castes ( hence called scheduled castes), 15 % jobs reservation in Government jobs only for tribal people ( hence called scheduled tribes). The provision is renewed every 10 years. Think of it as a constitutionallu bound affirmative action.

In 1990, another 27.5 % of jobs and educational seats were reserved for castes that were socially okay but educationally backward. This caused some riots, delays, political actions, but was finally implemented by 2007.

Opponents of the new affirmative action say that this is like doing two wrongs to make a right. Supporters say data proves that reservation has led to social advancement ( especially in the State of Tamil Nadu).Rollback of the new system is a political impossibilty thanks to unity among hitherto repressed classes.

As an upper caste Hindu ( embarassingly enough my caste is both a warrior and a kingly royal caste , which gives me zero benefit in 2010 AD)……..

In God we Trust..All others must bring Data.

Unfortunately, when it comes to politics the same data is either hidden, partially hidden, or interpreted in different ways especially with regards to projecting sampling error or decisions.

Phew…!! That was an analytical layman definition of the Indian Caste System over 2000 years.

Note- The Indian soldier caste is Kshatriyas not Kshatritas..
Using JMP 9 and R together

An interesting blog post at http://blogs.sas.com/jmp/index.php?/archives/298-JMP-Into-R!.html on using the new JMP 9 with R, and quite possibly using SAS as well.

Example Code-

Here’s the R integration JSL code used to run the bootstrap

rconn = R Connect();
rconn << Submit(“\[
library(boot)

# Load Boot package
library(boot)

RStatFctn <- function(x,d) {return(mean(x[d]))}

b.basic = matrix(data=NA, nrow=1000, ncol=2)
b.normal = matrix(data=NA, nrow=1000, ncol=2)
b.percent =matrix(data=NA, nrow=1000, ncol=2)
b.bca =matrix(data=NA, nrow=1000, ncol=2)

for(i in 1:1000){
rnormdat = rnorm(30,0,1)
b <- boot(rnormdat, RStatFctn, R = 1000)
b.ci=boot.ci(b, conf =095,type=c(“basic”,”norm”,”perc”,”bca”)) b.basic[i,] = b.ci$basic[,4:5]
b.normal[i,] = b.ci$normal[,2:3]
b.percent[i,] = b.ci$percent[,4:5]
b.bca[i,] = b.ci$bca[,4:5]
}
]\”));
b_basic= rconn << Get(b.basic);
b_normal = rconn << Get(b.normal);
b_percent= rconn << Get(b.percent);
b_bca = rconn << Get(b.bca);
rconn << Disconnect();

Using the R Connect() JSL command and assigning it to the object “rconn”, the code sends messages to the JSL scriptable object “rconn” to submit R code via the Submit() command and to retrieve R matrices containing the bootstrap confidence intervals back via the Get() commands.

and I also found interesting what the write has to say about using JMP (for visual analysis) and SAS (bigger datasets handling) and R (for advanced statistics) together

Other standard JMP tools such as the Data Filter can help to explore these results in ways that cannot easily and quickly be done in R

and

With a little JSL and the statistical and graphics platforms of JMP coupled with the breadth and variety of packages and functions in R, one can build complete easy-to-use applications for statistical analysis.

JMP can also integrate with SAS, which adds the ability to work with large-scale data through the file-based system as well as the depth and advanced capabilities of SAS procedures. With these seamless integrations, JMP can become a hub that enables you to connect with both SAS and R, as well as provide unique statistical features such as the JMP Profiler and interactive graphic features such as Graph Builder

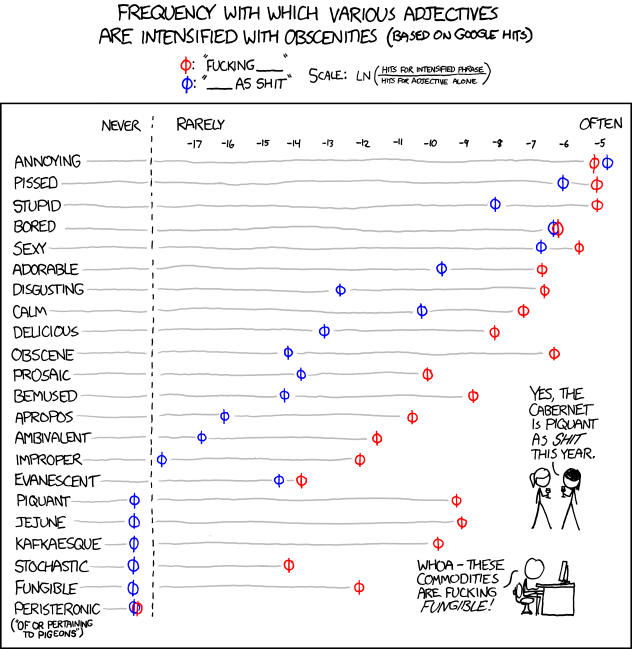
and in the meanwhile here is a data visualization of a frequency analysis of various words bundled together from xkcd.com

Q&A with David Smith, Revolution Analytics.

Here’s a group of questions and answers that David Smith of Revolution Analytics was kind enough to answer post the launch of the new R Package which integrates Hadoop and R-                         RevoScaleR

Ajay- How does RevoScaleR work from a technical viewpoint in terms of Hadoop integration?

David-The point isn’t that there’s a deep technical integration between Revolution R and Hadoop, rather that we see them as complementary (not competing) technologies. Hadoop is amazing at reliably (if slowly) processing huge volumes of distributed data; the RevoScaleR package complements Hadoop by providing statistical algorithms to analyze the data processed by Hadoop. The analogy I use is to compare a freight train with a race car: use Hadoop to slog through a distributed data set and use Map/Reduce to output an aggregated, rectangular data file; then use RevoScaleR to perform statistical analysis on the processed data (and use the speed of RevolScaleR to iterate through many model options to find the best one).

Ajay- How is it different from MapReduce and R Hipe– existing R Hadoop packages?
David- They’re complementary. In fact, we’ll be publishing a white paper soon by Saptarshi Guha, author of the Rhipe R/Hadoop integration, showing how he uses Hadoop to process vast volumes of packet-level VOIP data to identify call time/duration from the packets, and then do a regression on the table of calls using RevoScaleR. There’s a little more detail in this blog post: http://blog.revolutionanalytics.com/2010/08/announcing-big-data-for-revolution-r.html
Ajay- Is it going to be proprietary, free or licensable (open source)?
David- RevoScaleR is a proprietary package, available to paid subscribers (or free to academics) with Revolution R Enterprise. (If you haven’t seen it, you might be interested in this Q&A I did with Matt Shotwell: http://biostatmatt.com/archives/533 )
Ajay- Any existing client case studies for Terabyte level analysis using R.
David- The VOIP example above gets close, but most of the case studies we’ve seen in beta testing have been in the 10’s to 100’s of Gb range. We’ve tested RevoScaleR on larger data sets internally, but we’re eager to hear about real-life use cases in the terabyte range.
Ajay- How can I use RevoScaleR on my dual chip Win Intel laptop for say 5 gb of data.
David- One of the great things about RevoScaleR is that it’s designed to work on commodity hardware like a dual-core laptop. You won’t be constrained by the limited RAM available, and the parallel processing algorithms will make use of all cores available to speed up the analysis even further. There’s an example in this white paper (http://info.revolutionanalytics.com/bigdata.html) of doing linear regression on 13Gb of data on a simple dual-core laptop in less than 5 seconds.
AJ-Thanks to David Smith, for this fast response and wishing him, Saptarshi Guha Dr Norman Nie and the rest of guys at Revolution Analytics a congratulations for this new product launch.

Business Analytics Analyst Relations /Ethics/White Papers

Curt Monash, whom I respect and have tried to interview (unsuccessfully) points out suitable ethical dilemmas and gray areas in Analyst Relations in Business Intelligence here at http://www.dbms2.com/2010/07/30/advice-for-some-non-clients/

If you dont know what Analyst Relations are, well it’s like credit rating agencies for BI software. Read Curt and his landscaping of the field here ( I am quoting a summary) at http://www.strategicmessaging.com/the-ethics-of-white-papers/2010/08/01/

Vendors typically pay for

  1. They want to connect with sales prospects.
  2. They want general endorsement from the analyst.
  3. They specifically want endorsement from the analyst for their marketing claims.
  4. They want the analyst to do a better job of explaining something than they think they could do themselves.
  5. They want to give the analyst some money to enhance the relationship,

Merv Adrian (I interviewed Merv here at http://www.dudeofdata.com/?p=2505) has responded well here at http://www.enterpriseirregulars.com/23040/white-paper-sponsorship-and-labeling/

None of the sites I checked clearly identify the work as having been sponsored in any way I found obvious in my (admittefly) quick scan. So this is an issue, but it’s not confined to Oracle.

My 2 cents (not being so well paid 😉 are-

I think Curt was calling out Oracle (which didnt respond) and not Merv ( whose subsequent blog post does much to clarify).

As a comparative new /younger blogger in this field,
I applaud both Curt to try and bell the cat ( or point out what everyone in AR winks at) and for Merv for standing by him.

In the long run, it would strengthen analyst relations as a channel if they separate financial payment of content from bias. An example is credit rating agencies who forgot to do so in BFSI and see what happened.

Customers invest millions of dollars in BI systems trusting marketing collateral/white papers/webinars/tests etc. Perhaps it’s time for an industry association for analysts so that individual analysts don’t knuckle down under vendor pressure.

It is easier for someone of Curt, Merv’s stature to declare editing policy and disclosures before they write a white paper.It is much harder for everyone else who is not so well established.

White papers can take as much as 25,000$ to produce- and I know people who in Business Analytics (as opposed to Business Intelligence) slog on cents per hour cranking books on R, SAS , webinars, trainings but there are almost no white papers in BA. Are there any analytics independent analysts who are not biased by R or SAS or SPSS or etc etc. I am not sure but this looks like a good line to  pursue 😉 – provided ethical checks and balances are established.

Personally I know of many so called analytics communities go all out to please their sponsors so bias in writing does exist (you cant praise SAS on a R Blogging Forum or R USers Meet and you cant write on WPS at SAS Community.org )

– at the same time someone once told me- It is tough to make a living as a writer, and that choice between easy money and credible writing needs to be respected.

Most sponsored white papers I read are pure advertisements, directed at CEOs rather than the techie community at large.

Almost every BI vendor claims to have the fastest database with 5X speed- and benchmarking in technical terms could be something they could do too.

Just like Gadget sites benchmark products, you can not benchmark BI or even BA products as it is written not to do so  in many licensing terms.

Probably that is the reason Billions are spent in BI and the positive claims are doubtful ( except by the sellers). Similarly in Analytics, many vendors would have difficulty justifying their claims or prices if they are subjected to a side by side comparison. Unfortunately the resulting confusion results in shoddy technology coming stronger due to more aggressive marketing.

Friday Poem: Live Music in Austin

Ok the events in the following poem really happened when I visited Austin, Texas for a business visit, and thanks to the Austin Post ( a new media Austin based site) for publishing it.

austin_post

And you can read the rest at http://www.austinpost.org/content/live-music-sixth-street-austin-poetry

If you like poetry, live music, Austin  ….