Contest for SAS Users and Students

Heres a new contest for SAS users. The prizes are books, so students should be interested as well.

From http://www.sascommunity.org/mwiki/images/b/bc/PointsforprizesRules.pdf

HOW TO ENTER: To qualify for entry, go to the sasCommunity.org web site located at http://www.sascommunity.org/wiki/Main_Page
between April 11, 2011 and May 9, 2011 and either add or edit valid content as described herein to earn award points.
Creation of a first time profile on www.sascommunity.org will earn 1,000 points. For each valid article creation or edit, 100
points will be earned. Articles and subsequent edits should adhere to the sasCommunity.org terms of use as outlined on
http://www.sascommunity.org/wiki/sasCommunity:Terms_of_Use. All points’ accumulation will end at 5:00 PM GMT on
May 9, 2011 and only those points earned between 8:00 AM GMT on April 11, 2011 and 5:00 PM GMT on May 9, 2011
will be counted in this contest. Contest entries made through the Internet will be declared made by the registered user of
the sasCommunity.org profile account. Sponsor is not responsible for phone, technical, network, electronic, computer
hardware or software failures of any kind, misdirected, incomplete, garbled or delayed transmissions. Sponsor will not be
responsible for incorrect or inaccurate entry information, whether caused by entrants or by any of the equipment or
programming associated with or utilized in the contest.
ELIGIBILITY: The contest is open to all sasCommunity.org members 18 year of age or older on the start date of the
contest. Void where prohibited by law. Employees (including immediate family members and/or those living in the same 
household of each), the Sponsor, members of the sasCommunity.org Advisory Board, SAS Global Users Group Executive 
Board, their advertising, promotion and production agencies, the affiliated companies of each, and the immediate family 
members of each are not eligible. 

PRIZE: Three (3) prizes will be awarded based on total points accumulated during the contest as follows:
 1stPlace: 3 SAS®Press books - not to exceed $250 in combined retail value;
 2ndPlace: 2 SAS®Press books - not to exceed $150 in combined retail value; and
 3rdPlace: 1 SAS®Press book - not to exceed $100 in retail value.

What’s New

http://www.sascommunity.org/wiki/Main_Page

New Points for Prizes Contest
Points for Prizes Contest
Win SAS books!
Contribute content or SAS code to sasCommunity.org for your chance to WIN! To qualify, simply add or edit articles between April 11, 2011 and May 9, 2011 (GMT). Creation of a first-time profile on sasCommunity.org gives you 1,000 points. For each valid article creation or edit, 100 points will be earned. The user with the most points collected during this time wins SAS Press Books!

Become a sasCommunity Guru
Thanks for Contributing to sasCommunity.org!
New sasCommunity.org Point System
The sasCommunity support team has been hard at work adding new features and is pleased to announce a points system that recognizes each user’s contributions to the site. Every time you contribute by creating a page, updating it, or just doing a little wiki gardening, you earn points.Earning points is automatic and simple – all you have to do is contribute! Creating your account starts you with 1000 points and all the current users have been credited with points dating back to the site coming online in April 2007.

Oracle launches XBRL extension for financial domains

What is XBRL and how does it work?

http://www.xbrl.org/HowXBRLWorks/

How XBRL Works
XBRL is a member of the family of languages based on XML, or Extensible Markup Language, which is a standard for the electronic exchange of data between businesses and on the internet.  Under XML, identifying tags are applied to items of data so that they can be processed efficiently by computer software.

XBRL is a powerful and flexible version of XML which has been defined specifically to meet the requirements of business and financial information.  It enables unique identifying tags to be applied to items of financial data, such as ‘net profit’.  However, these are more than simple identifiers.  They provide a range of information about the item, such as whether it is a monetary item, percentage or fraction.  XBRL allows labels in any language to be applied to items, as well as accounting references or other subsidiary information.

XBRL can show how items are related to one another.  It can thus represent how they are calculated.  It can also identify whether they fall into particular groupings for organisational or presentational purposes.  Most importantly, XBRL is easily extensible, so companies and other organisations can adapt it to meet a variety of special requirements.

The rich and powerful structure of XBRL allows very efficient handling of business data by computer software.  It supports all the standard tasks involved in compiling, storing and using business data.  Such information can be converted into XBRL by suitable mapping processes or generated in XBRL by software.  It can then be searched, selected, exchanged or analysed by computer, or published for ordinary viewing.

also see

http://www.xbrl.org/Example1/


and from-

http://www.oracle.com/us/dm/xbrlextension-354972.html?msgid=3-3856862107

With more than 7,000 new U.S. companies facing extensible business reporting language (XBRL) filing mandates in 2011, Oracle has released a free XBRL extension on top of the latest release of Oracle Database.

Oracle’s XBRL extension leverages Oracle Database 11g Release 2 XML to manage the collection, validation, storage, and analysis of XBRL data. It enables organizations to create one or more back-end XBRL repositories based on Oracle Database, providing secure XBRL storage and query-ability with a set of XBRL-specific services.

In addition, the extension integrates easily with Oracle Business Intelligence Suite Enterprise Edition to provide analytics, plus interactive development environments (IDEs) and design tools for creating and editing XBRL taxonomies.

The Other Side of XBRL
“While the XBRL mandate continues to grow, the feedback we keep hearing from the ‘other side’ of XRBL—regulators, academics, financial analysts, and investors—is that they lack sufficient tools and historic data to leverage the full potential of XBRL,” says John O’Rourke, vice president of product marketing, Oracle.

However, O’Rourke says this is quickly changing as XBRL mandates enter their third year—and more and more companies have to comply. While the new extension should be attractive to organizations that produce XBRL filings, O’Rourke expects it will prove particularly valuable to regulators, stock exchanges, universities, and other organizations that need to collect, analyze, and disseminate XBRL-based filings.

Outsourcing, a Bolt-on Solution, or Integrated XBRL Tagging
Until recently, reporting organizations had to choose between expensive third-party outsourcing or manual, in-house tagging with bolt-on solutions— both of which introduce the possibility of error.

In response, Oracle launched Oracle Hyperion Disclosure Management, which provides an XBRL tagging solution that is integrated with the financial close and reporting process for fast and reliable XBRL report submission—without relying on third-party providers. The solution enables organizations to

  • Author regulatory filings in Microsoft Office and “hot link” them directly to financial reporting systems so they can be easily updated
  • Graphically perform XBRL tagging at several levels—within Microsoft Office, within EPM system reports, or in the data source metadata
  • Modify or extend XBRL taxonomies before the mapping process, as well as set up multiple taxonomies
  • Create and validate final XBRL instance documents before submission


Input Data in R using the top 3 R GUI

PC-DOS was an early OS for personal computers ...
Image via Wikipedia

One area where clearly GUI methods are preferable to command line methods in R, is data input. There is no need of learning read.csv or read.table when these options are only two clicks away in any R GUI. For academics/students there is a definite need to easily access

datasets from attached packages just as it is a need for business analysts to access databases with a few clicks than learn or read pages of pdf on RODBC. However some GUI (like Rattle) need data only in data frames, rather than list or arrays-this limits R’s flexibility. These are my views but you can see and compare views of data input in R Commander, Rattle and Deducer.


Pentaho and R: working together

open_source_communism
Image by jagelado via Flickr

I interview Pentaho Co-founder here at https://decisionstats.com/2010/11/14/pentaho/

and recently became aware of the R Pentaho integration.

“R” is a popular open source statistical and analytical language that academics and commercial organizations alike have used for years to get maximum insight out of information using advanced analytic techniques. In this twelve-minute video, David Reinke from Pentaho Certified Partner OpenBI provides an overview of R, as well as a demonstration of integration between R and Pentaho.

http://www.pentaho.com/products/demos/r_project_with_pentaho/

or http://www.pentaho.com/products/demos/showNtell.php

Related-

M.S. in Applied Statistics

http://www.information-management.com/blogs/analytics_business_intelligence_BI_statistics-10019474-1.html

R and BI – Integrating R with Open Source BusinessIntelligence Platforms Pentaho and Jaspersoft

http://www.r-project.org/conferences/useR-2010/abstracts/Reinke+Miller.pdf

Web development with R

http://www.r-project.org/conferences/useR-2010/slides/Ooms.pdf

In-database analytics with R

http://www.r-project.org/conferences/useR-2010/slides/Hess+Chambers_1.pdf

R role in Business Intelligence Software Architecture

http://www.r-project.org/conferences/useR-2010/slides/Colombo+Ronzoni+Fontana.pdf

Protovis a graphical toolkit for visualization

I just found about a new data visualization tool called Protovis http://vis.stanford.edu/protovis/ex/

Protovis composes custom views of data with simple marks such as bars and dots. Unlike low-level graphics libraries that quickly become tedious for visualization, Protovis defines marks through dynamic properties that encode data, allowing inheritancescales and layouts to simplify construction.

Protovis is free and open-source and is a Stanford project. It has been used in web interface R Node (which I will talk later )

http://squirelove.net/r-node/doku.php

Conventional

While Protovis is designed for custom visualization, it is still easy to create many standard chart types. These simpler examples serve as an introduction to the language, demonstrating key abstractions such as quantitative and ordinal scales, while hinting at more advanced features, including stack layout.

Custom

Many charting libraries provide stock chart designs, but offer only limited customization; Protovis excels at custom visualization design through a concise representation and precise control over graphical marks. These examples, including a few recreations of unusual historical designs, demonstrate the language’s expressiveness.


Try Protovis today 🙂 http://vis.stanford.edu/protovis/

It uses JavaScript and SVG for web-native visualizations; no plugin required (though you will need a modern web browser)! Although programming experience is helpful, Protovis is mostly declarative and designed to be learned by example.

SAS Knowledge Exchange

Visual analytics : research and practice
Image via Wikipedia

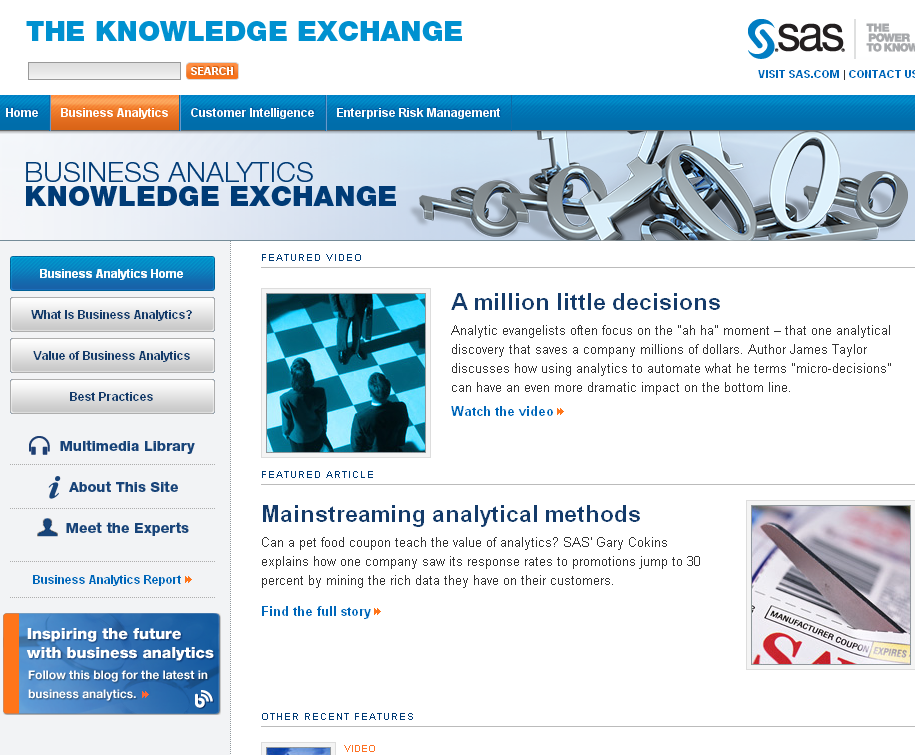
Here is an interesting website by SAS.com – it showcases lots of business analytics content more from a conceptual rather than a tool based perspective- have a glance yourself.

http://www.sas.com/knowledge-exchange/business-analytics/

Copyright © SAS Institute Inc. All rights reserved

SAS to R Challenge: Unique benchmarking

Flag of Town of Cary
Image via Wikipedia

An interesting announcemnet from Revolution Analytics promises to convert your legacy code in SAS language not only cheaper but faster. It’ s a very very interesting challenge and I wonder how SAS users ,corporates, customers as well as the Institute itself reacts

http://www.revolutionanalytics.com/sas-challenge/

Take the SAS to R Challenge

Are you paying for expensive software licenses and hardware to run time-consuming statistical analyses on big data sets?

If you’re doing linear regressions, logistic regressions, predictions, or multivariate crosstabulations* there’s something you should know: Revolution Analytics can get the same results for a substantially lower cost and faster than SAS®.

For a limited time only, Revolution Analytics invites you take the SAS to R Challenge. Let us prove that we can deliver on our promise of replicating your results in R, faster and cheaper than SAS.

Take the challenge

Here’s how it works:

Fill out the short form below, and one of our conversion experts will contact you to discuss the SAS code you want to convert. If we think Revolution R Enterprise can get the same results faster than SAS, we’ll convert your code to R free of charge. Our goal is to demonstrate that Revolution R Enterprise will produce the same results in less time. There’s no obligation, but if you choose to convert, we guarantee that your license cost for Revolution R Enterprise will be less than half what you’re currently paying for the equivalent SAS software.**

It’s that simple.

We’ll show you that you don’t need expensive hardware and software to do high quality statistical analysis of big data. And we’ll show that you don’t need to tie up your computing resources with long running operations. With Revolution R Enterprise, you can run analyses on commodity hardware using Linux or Windows, scale to terabyte-class data problems and do it at processing speeds you would never have thought possible.

Sign up now, and we will be in touch shortly.

Take the challenge


—————————-

SAS is a registered trademark of the SAS Institute, Cary, NC, in the US and other countries.

*Additional statistical algorithms are being rapidly added to Revolution R Enterprise. Custom development services are also available.

**Revolution Analytics retains the right to determine eligibility for this offer. Offer available until March 31, 2011.