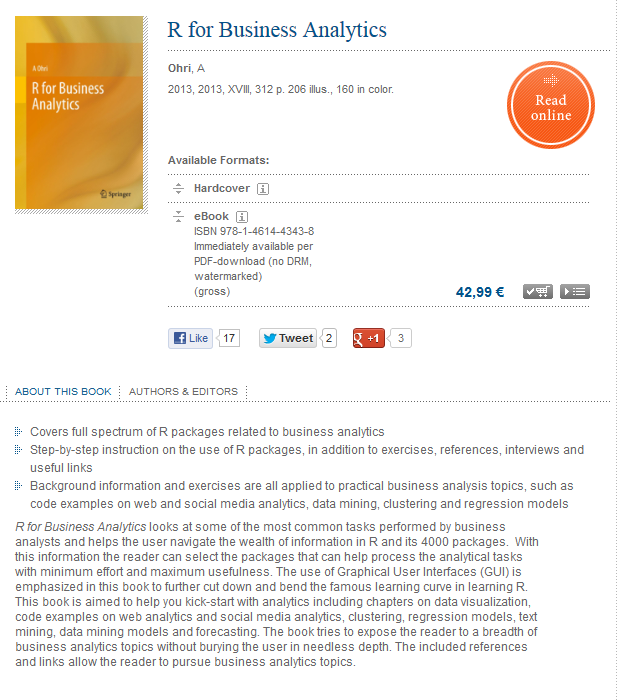
The book I had been writing for 2+ years is now live Try it out here
http://www.springer.com/statistics/book/978-1-4614-4342-1
Thanks to all my friends for encouraging my curious nature!
Ajay

The book I had been writing for 2+ years is now live Try it out here
http://www.springer.com/statistics/book/978-1-4614-4342-1
Thanks to all my friends for encouraging my curious nature!
Ajay
Here is an interview with Rob Kabacoff, Ph.D, author and creator of the popular R reference website Quick-R (http://www.statmethods.net/)

Ajay- What are the reasons you started using R?
Rob- I had been using SAS and SPSS for many years, when I applied for a position that required a solid command of R programming. I had some experience using S in the early days and wanted to refresh my knowledge before the interview. I was very surprised to see how the language and platform had grown, and how powerful and comprehensive it had become in its new incarnation. It quickly became apparent that I would not be able to develop any kind of expertise in time for the interview. However, despite turning down the position, I become smitten with the language, and continue to use and study it to this day.
Ajay- What were your motivations in writing Quick R and designing your website
Rob- Although I was an experienced programmer and statistician, I found R a very difficult language to learn. The number of packages and functions available can feel overwhelming, and it can be hard to get handle on the language as a whole. I learn best by teaching, so I created Quick-R as a place where people who were familiar with statistics, but not R, could jump into the language rapidly. It started out as a simple cookbook and has expanded ever since.
Ajay- What has been the feedback to your website so far
Rob- The feedback has been amazing. I have received roughly 500 emails thanking me for the site, and there are 10,000+ unique visitors a day. A couple of years ago Manning Publishing asked me to write a book about R and Quick-R turned in “R in Action: Data Analysis and Graphics with R”. After only one year I am already writing a second edition (R changes fast!), but I still support Quick-R every day. Knowing how much it is used is incredibly gratifying.
Ajay- Name some consulting projects in which you used R for great effect? ( or real time case studies with confidential details suppressed)
Rob– I do a lot of research on global leadership. The goal is to understand how leaders in different countries approach the leadership role, what behaviors they rely on, what behaviors they expect from others, and what values they bring to the table.
Differences among leaders in different cultures can be enormous – and understanding them can reduce misunderstandings, conflicts, and tensions. Such research frequently entails comparing the leadership behaviors of business executives and government officials in dozens of countries on dozens (or hundreds) of variables. It can be very challenging to understand such complicated observational data, and communicate it a meaningful way to a nontechnical audience. R really excels at both model building and graphics. In particular, I rely on packages like relimpo to help identify the relative importance of variables in predicting leadership effectiveness, and graphics packages like ggplot2 to build plots that convey the results in easily digestible ways.
Ajay- Initiatives like coursera, and multiple free video lectures on the internet, and helpful websites like yours are helping introduce R to a broader than just a niche audience. How can we make learning statistics and tools more popular.
Rob- I love statistics, and actually think that it is becoming increasingly popular on its own. With the advent of big data, fast and powerful software, and the internet as a driving force, the field of statistics is finally becoming sexy. I am amazed at the number of jobs I see for data scientists of all types (analysts, programmers, modelers, data miners) listed in popular websites like Monster and Career Builder. I think that quantitatively oriented students will always gravitate to languages like R if there are practical books, videos, and websites that show real world applications. Once you see how something can be used, I think you are more willing to buckle down and learn the nitty-gritty details necessary to make it work. For people averse to programming, I think that easy to use GUIs become increasingly important. This is why IBM SPSS has done so well. RCommander and Deducer are good examples of GUIs that can help you to incorporate R into courses that do not include programming.
Ajay- How can we make statistics books more affordable to students while adequately compensating authors, including usage of web based tools.
Rob- Boy, that is a tough one. Quick-R is obviously free and I donate the time and expense it takes to keep it running because I want to contribute to the community. Writing is much harder than I ever imagined and the hundreds of hours it took to write R in Action were exhausting and painful. Even if I didn’t get royalties, I probably would still have written it, but I might not be doing a second edition now. To be honest, only a small portion of the income from traditionally published books go to authors. The rest goes to the publisher, and I can’t speak to costs or profit. To bring the cost down, we would have to reduce the cost to publishers, their profits, or find an alternative distribution model. One solution may be to have authors publish small texts (booklets) that are less time consuming to write and can be offered in PDF format for free or for a small fee. These can be practical use books, explanations for frequently misunderstood topics, or solutions to particular problems. Additionally, I have found that authors will frequently work for recognition (won’t we all?), as well as money. Rewarding authors with attention, opportunities to speak, teach, etc., may be very motivating for many such individuals. Perhaps we could create and promote more websites that aggregate donated online textbooks – giving aspiring authors an opportunity and an outlet for their writing, and an audience in the process.
About-
Rob is a statistical consultant and research methodologist for more than 25 years. His Ph.D. was originally in psychology.For the past 15 years he have been head of research for Management Research Group, a global HR development firm in Portland, Maine and Dublin, Ireland
Rob primarily study cross-cultural leadership and issues of workplace diversity. Before that, Kabacoff was a graduate school professor in Southern Florida for 10 years teaching multivariate statistics and statistical programming (and surprising, family therapy and adult psychopathology).
The book inspired by the Quick -R website is now available! It takes the material there and significantly expands upon it. If you are interested, you can get it here. Use promo code ria38 for a 38% discount

R in Action
Data Analysis and Graphics with R
Robert I. Kabacoff
August, 2011 | 472 pages
ISBN 9781935182399
Here is a brief tutorial for people to run R on Windows Azure Cloud (OS=Windows in this case , but there are 4 kinds of Linux also available)
There is a free 90 day trial so you can run R for free on the cloud for free (since Google Cloud Compute is still in closed hush hush beta)
Go to https://www.windowsazure.com/en-us/pricing/free-trial/
The Analytics (or stats) dashboard at WordPress.com continues to disappoint, and is a major reason for people to move out of WordPress.com hosting (since they need better analytics like that by Google Analytics which cant be enabled on the default mode)
Its not really beautiful unlike the rest of WordPress Universe!
 It can be made better if people try harder! Analytics matters
Here are some points
1) Bar charts and Histograms are not really the best way to visualize trends across time

2) Location Analytics is limited to just country level analysis and the heatmap (?) is aweful in terms of distinguishing gradients 
3) Referrers Tab needs to do a better job on distinguishing between mobile and non mobile traffic, social and non social traffic (and there are better ways to visualize than just a simple list)!
4) I cant even export my traffic stats (and forget an api !) so I am stuck with the bad data viz here
From–
WASHINGTON — From his first months in office, President Obama secretly ordered increasingly sophisticated attacks on the computer systems that run Iran’s main nuclear enrichment facilities, significantly expanding America’s first sustained use of cyberweapons,
From–
http://www.politico.com/news/stories/0612/76973.html
By JENNIFER MARTINEZ and JONATHAN ALLEN | 6/1/12
“When we see the results it’s pretty clear they’re doing it without anybody except a very few people knowing about it, much less having any impact on whether it’s happening or not,” said Rep. Jim McDermott (D-Wash.).
McDermott is troubled because “we have given more and more power to the president, through the CIA, to carry out operations, and, frankly, if you go back in history, the reason we have problems with Iran is because the CIA brought about a coup.”
From–
http://www.house.gov/house/Constitution/Constitution.html
All legislative Powers herein granted shall be vested in a Congress of the United States, which shall consist of a Senate and House of Representatives.
The Congress shall have Power
—
Clause 11: To declare War, grant Letters of Marque and Reprisal, and make Rules concerning Captures on Land and Water;
Related-
http://www.huffingtonpost.com/2009/10/09/obama-wins-nobel-peace-pr_n_314907.html
KARL RITTER and MATT MOORE 10/ 9/09 11:02 PM ET
http://www.law.uchicago.edu/media
The Law School has received many media requests about Barack Obama, especially about his status as “Senior Lecturer.”
From 1992 until his election to the U.S. Senate in 2004, Barack Obama served as a professor in the Law School. He was a Lecturer from 1992 to 1996. He was a Senior Lecturer from 1996 to 2004, during which time he taught three courses per year.
Exploring some Python Packages and R packages to move /work with both Python and R without melting your brain or exceeding your project deadline
—————————————
If you liked the data.frame structure in R, you have some way to work with them at a faster processing speed in Python.
Here are three packages that enable you to do so-
(1) pydataframe http://code.google.com/p/pydataframe/
An implemention of an almost R like DataFrame object. (install via Pypi/Pip: “pip install pydataframe”)
Usage:
        u = DataFrame( { "Field1": [1, 2, 3],
                        "Field2": ['abc', 'def', 'hgi']},
                        optional:
                         ['Field1', 'Field2']
                         ["rowOne", "rowTwo", "thirdRow"])
A DataFrame is basically a table with rows and columns.
Columns are named, rows are numbered (but can be named) and can be easily selected and calculated upon. Internally, columns are stored as 1d numpy arrays. If you set row names, they’re converted into a dictionary for fast access. There is a rich subselection/slicing API, see help(DataFrame.get_item) (it also works for setting values). Please note that any slice get’s you another DataFrame, to access individual entries use get_row(), get_column(), get_value().
DataFrames also understand basic arithmetic and you can either add (multiply,…) a constant value, or another DataFrame of the same size / with the same column names, like this:
#multiply every value in ColumnA that is smaller than 5 by 6.
my_df[my_df[:,'ColumnA'] < 5, 'ColumnA'] *= 6

#you always need to specify both row and column selectors, use : to mean everything
my_df[:, 'ColumnB'] = my_df[:,'ColumnA'] + my_df[:, 'ColumnC']

#let's take every row that starts with Shu in ColumnA and replace it with a new list (comprehension)
select = my_df.where(lambda row: row['ColumnA'].startswith('Shu'))
my_df[select, 'ColumnA'] = [row['ColumnA'].replace('Shu', 'Sha') for row in my_df[select,:].iter_rows()]
Dataframes talk directly to R via rpy2 (rpy2 is not a prerequiste for the library!)
(2) pandas http://pandas.pydata.org/
First of all, we love open source R! It is the most widely-used open source environment for statistical modeling and graphics, and it provided some early inspiration for pandas features. R users will be pleased to find this library adopts some of the best concepts of R, like the foundational DataFrame (one user familiar with R has described pandas as “R data.frame on steroids”). But pandas also seeks to solve some frustrations common to R users:
(3) datamatrix http://pypi.python.org/pypi/datamatrix/0.8
datamatrix 0.8
A Pythonic implementation of R’s data.frame structure.
Latest Version: 0.9
This module allows access to comma- or other delimiter separated files as if they were tables, using a dictionary-like syntax. DataMatrix objects can be manipulated, rows and columns added and removed, or even transposed
—————————————————————–
Modeling in Python
I really liked Scribd Analytics feature (and that we have racked up 3200 reads in 11 months for Poets and Hackers). I think Google Docs /Drive should really incorporate more Scribd like document sharing features including social (now that Slideshare is off the market for a relatively cheap $119m) and turn on analytics by default
I really liked the heatmap on the document feature in the second screenshot.
Anyways nice to see someone out there cares for Poets &….


 DECISION STATS