Data Frame in Python

Exploring some Python Packages and R packages to move /work with both Python and R without melting your brain or exceeding your project deadline

—————————————

If you liked the data.frame structure in R, you have some way to work with them at a faster processing speed in Python.

Here are three packages that enable you to do so-

(1) pydataframe http://code.google.com/p/pydataframe/

An implemention of an almost R like DataFrame object. (install via Pypi/Pip: “pip install pydataframe”)

Usage:

        u = DataFrame( { "Field1": [1, 2, 3],
                        "Field2": ['abc', 'def', 'hgi']},
                        optional:
                         ['Field1', 'Field2']
                         ["rowOne", "rowTwo", "thirdRow"])

A DataFrame is basically a table with rows and columns.

Columns are named, rows are numbered (but can be named) and can be easily selected and calculated upon. Internally, columns are stored as 1d numpy arrays. If you set row names, they’re converted into a dictionary for fast access. There is a rich subselection/slicing API, see help(DataFrame.get_item) (it also works for setting values). Please note that any slice get’s you another DataFrame, to access individual entries use get_row(), get_column(), get_value().

DataFrames also understand basic arithmetic and you can either add (multiply,…) a constant value, or another DataFrame of the same size / with the same column names, like this:

#multiply every value in ColumnA that is smaller than 5 by 6.
my_df[my_df[:,'ColumnA'] < 5, 'ColumnA'] *= 6

#you always need to specify both row and column selectors, use : to mean everything
my_df[:, 'ColumnB'] = my_df[:,'ColumnA'] + my_df[:, 'ColumnC']

#let's take every row that starts with Shu in ColumnA and replace it with a new list (comprehension)
select = my_df.where(lambda row: row['ColumnA'].startswith('Shu'))
my_df[select, 'ColumnA'] = [row['ColumnA'].replace('Shu', 'Sha') for row in my_df[select,:].iter_rows()]

Dataframes talk directly to R via rpy2 (rpy2 is not a prerequiste for the library!)


(2) pandas http://pandas.pydata.org/

Library Highlights

  • A fast and efficient DataFrame object for data manipulation with integrated indexing;
  • Tools for reading and writing data between in-memory data structures and different formats: CSV and text files, Microsoft Excel, SQL databases, and the fast HDF5 format;
  • Intelligent data alignment and integrated handling of missing data: gain automatic label-based alignment in computations and easily manipulate messy data into an orderly form;
  • Flexible reshaping and pivoting of data sets;
  • Intelligent label-based slicing, fancy indexing, and subsetting of large data sets;
  • Columns can be inserted and deleted from data structures for size mutability;
  • Aggregating or transforming data with a powerful group by engine allowing split-apply-combine operations on data sets;
  • High performance merging and joining of data sets;
  • Hierarchical axis indexing provides an intuitive way of working with high-dimensional data in a lower-dimensional data structure;
  • Time series-functionality: date range generation and frequency conversion, moving window statistics, moving window linear regressions, date shifting and lagging. Even create domain-specific time offsets and join time series without losing data;
  • The library has been ruthlessly optimized for performance, with critical code paths compiled to C;
  • Python with pandas is in use in a wide variety of academic and commercial domains, including Finance, Neuroscience, Economics, Statistics, Advertising, Web Analytics, and more.

Why not R?

First of all, we love open source R! It is the most widely-used open source environment for statistical modeling and graphics, and it provided some early inspiration for pandas features. R users will be pleased to find this library adopts some of the best concepts of R, like the foundational DataFrame (one user familiar with R has described pandas as “R data.frame on steroids”). But pandas also seeks to solve some frustrations common to R users:

  • R has barebones data alignment and indexing functionality, leaving much work to the user. pandas makes it easy and intuitive to work with messy, irregularly indexed data, like time series data. pandas also provides rich tools, like hierarchical indexing, not found in R;
  • R is not well-suited to general purpose programming and system development. pandas enables you to do large-scale data processing seamlessly when developing your production applications;
  • Hybrid systems connecting R to a low-productivity systems language like Java, C++, or C# suffer from significantly reduced agility and maintainability, and you’re still stuck developing the system components in a low-productivity language;
  • The “copyleft” GPL license of R can create concerns for commercial software vendors who want to distribute R with their software under another license. Python and pandas use more permissive licenses.

(3) datamatrix http://pypi.python.org/pypi/datamatrix/0.8

datamatrix 0.8

A Pythonic implementation of R’s data.frame structure.

Latest Version: 0.9

This module allows access to comma- or other delimiter separated files as if they were tables, using a dictionary-like syntax. DataMatrix objects can be manipulated, rows and columns added and removed, or even transposed

—————————————————————–

Modeling in Python

Continue reading “Data Frame in Python”

Using R from other Software

Bridge to R for WPS

http://www.minequest.com/Bridge2R.html

SAS/IML Interface to R

http://www.sas.com/technologies/analytics/statistics/iml/index.html

Official Screenshot-

RapidMiner Extension to R

https://rapid-i.com/content/view/202/206/lang,en/#r

(UN)Official Screenshot-

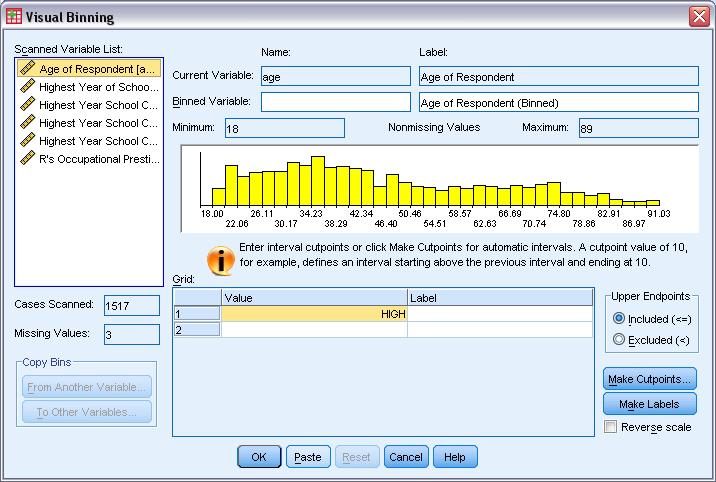
IBM SPSS plugin for R

https://www.spss.com/software/statistics/developer/

and

https://www.spss.com/devcentral/index.cfm?pg=rresources

Tutorial-

https://sites.google.com/site/r4statistics/running-r-from-spss

http://rwiki.sciviews.org/doku.php?id=tips:callingr:spss

(UN)official Screenshot

Knime

http://www.knime.org/downloads/extensions

Official Screenshot-

Oracle Data Miner

http://www.oracle.com/technetwork/database/options/odm/odm-r-integration-089013.html

Official Screenshot-

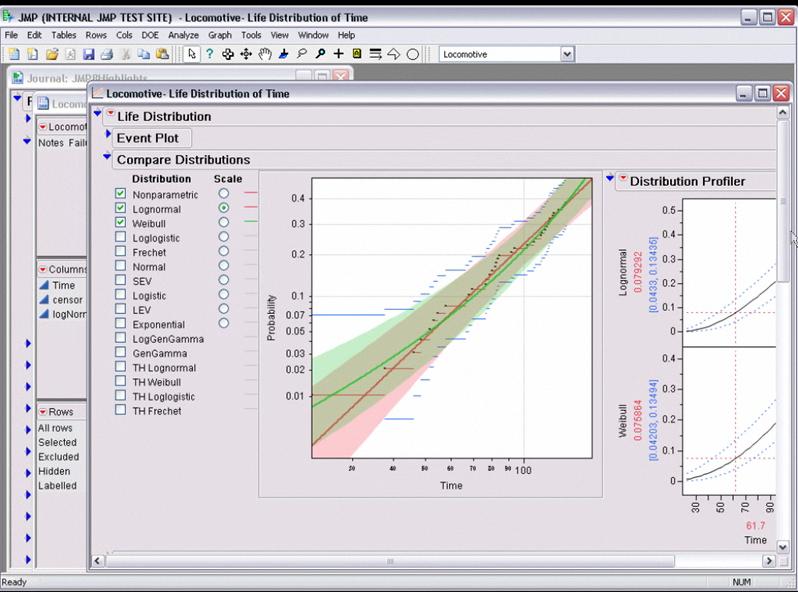
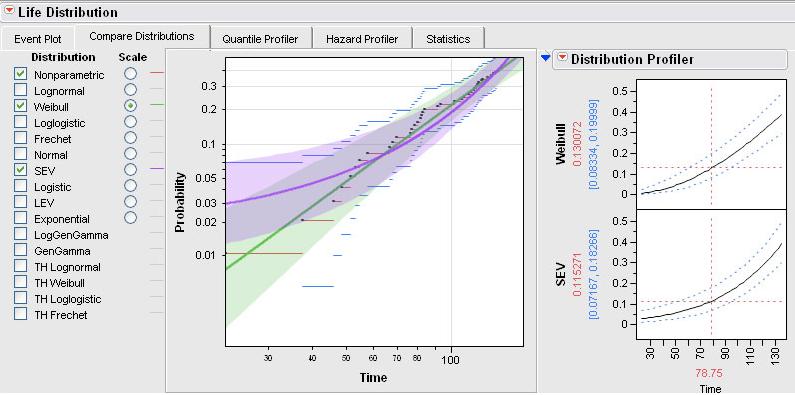
JMP

http://jmp.com/software/jmp9/keyfeatures.shtml

and

http://www.jmp.com/applications/analytical_apps/

Tutorial

http://blogs.sas.com/jmp/index.php?/archives/298-JMP-Into-R!.html

Screenshot-

Top R Interviews


Portrait of baron A.I.Vassiliev (later - count)
Image via Wikipedia


Here is a list of the Top R Related Interviews I have done (in random order)-

1) John Fox , Creator of R Commander

https://decisionstats.com/2009/09/14/interview-professor-john-fox-creator-r-commander/

2) Dr Graham Williams, Creator of Rattle

https://decisionstats.com/2009/01/13/interview-dr-graham-williams/

3) David Smith, back when he was community Director of then Revolution Computing.

https://decisionstats.com/2009/05/29/interview-david-smith-revolution-computing/

and his second interview

https://decisionstats.com/2010/08/03/q-a-with-david-smith-revolution-analytics/

4) Robert Schultz, the first CEO of Revolution Computing (now Analytics)

https://decisionstats.com/2009/01/31/interviewrichard-schultz-ceo-revolution-computing/

5) Bob  Muenchen, author of R for SAS and SPSS users AND R for Stata users

https://decisionstats.com/2010/06/29/interview-r-for-stata-users/

https://decisionstats.com/2008/10/16/r-for-sas-and-spss-users/

6) Karim Chine, creator Biocep, Cloud Computing for R

https://decisionstats.com/2009/06/21/interview-karim-chine-biocep-cloud-computing-with-r/

7) Paul van Eikeran, Inference for R,the first enterprise package to use R from within MS Office.

https://decisionstats.com/2009/06/04/inference-for-r/

8) Hadley Wickham, creator GGPlot and R Author

https://decisionstats.com/2010/01/12/interview-hadley-wickham-r-project-data-visualization-guru/

Thats a lot of R interviews- I need to balance them out a bit I guess.

Top 10 Graphical User Interfaces in Statistical Software

Here is a list of top 10 GUIs in Statistical Software. The overall criterion is based on-

  • User Friendly Nature for a New User to begin click and point and learn.
  • Cleanliness of Automated Code or Log generated.
  • Practical application in consulting and corporate world.
  • Cost and Ease of Ownership (including purchase,install,training,maintainability,renewal)
  • Aesthetics (or just plain pretty)

However this list is not in order of ranking- ( as beauty (of GUI) lies in eyes of the beholder). For a list of top 10 GUI in R language only please see –

https://rforanalytics.wordpress.com/graphical-user-interfaces-for-r/

This is only a GUI based list so it excludes notable command line or text editor submit commands based softwares which are also very powerful and user friendly.

  1. JMP –

While critics of SAS Institute often complain on the premium pricing of the basic model (especially AFTER the entry of another SAS language software WPS from http://www.teamwpc.co.uk/products/wps – they should try out JMP from http://jmp.com – it has a 1 month free evaluation, is much less expensive and the GUI makes it very very easy to do basic statistical analysis and testing. The learning curve is surprisingly fast to pick it up (as it should be for well designed interfaces) and it allows for very good quality output graphics as well.

2.SPSS

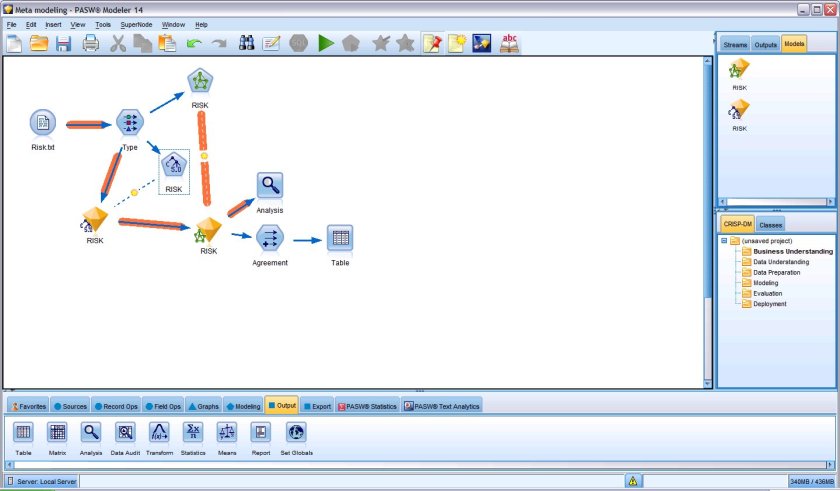
The original GUI in this class of softwares- it has now expanded to a big portfolio of products. However SPSS 18 is nice with the increasing focus on Python and an early adoptee of R compatible interfaces, SPSS does offer a much affordable solution as well with a free evaluation. See especially http://www.spss.com/statistics/ and http://www.spss.com/software/modeling/modeler-pro/

the screenshot here is of SPSS Modeler

3. WPS

While it offers an alternative to Base SAS and SAS /Access software , I really like the affordability (1 Month Free Evaluation and overall lower cost especially for multiple CPU servers ), speed (on the desktop but not on the IBM OS version ) and the intuitive design as well as extensibility of the Workbench. It may look like an integrated development environment and not a proper GUI, but with all the menu features it does qualify as a GUI in my opinion. Continue reading “Top 10 Graphical User Interfaces in Statistical Software”

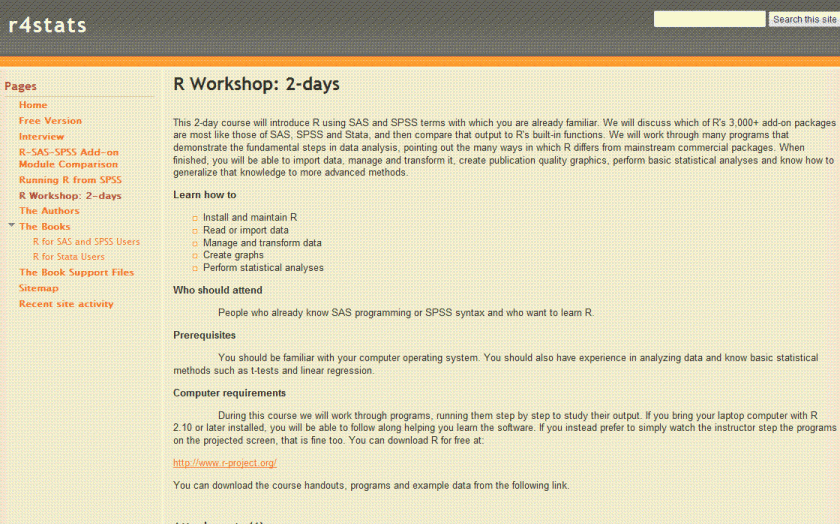
R for Stats : Updated

Here is the new website for statistical analysis using the free analytical software called R (which is enabled for cloud computing as well : see here http://bit.ly/OhriCloud

or http://rgrossman.com/2009/05/17/running-r-on-amazons-ec2/

for the R tutorial on running it on Amazon’s EC2 pay per demand RAM.

It is called R 4 stats or simply http://www.r4stats.com/

Hosted on Google’s Updated Google Sites Platform- it offers a preview to Bob’s earlier run away hit R for SAS and SPSS users updation as well as his upcoming work R for Stata Users.

In Bob’s words himself –

I have substantially expanded the table that compares SAS and SPSS
add-on modules to somewhat equivalent R packages. This new version is
at:
http://r4stats.com/add-on-modules
and I would very much appreciate any feedback you might have on it.

The site http://r4stats.com is the replacement to
http://RforSASandSPSSusers.com and includes the support files for both
“R for SAS and SPSS Users” and the new “R for Stata Users”, due out in
March from Springer.

Topic SAS Product SPSS Product R Package
Advanced Models
SAS/STAT IBM SPSS Advanced Statistics
R, MASS, many others
Association Analysis
Enterprise Miner
IBM SPSS Association
arules, arulesNBMiner, arulesSequences
Basics Base SAS
IBM SPSS Statistics Base
R
Bootstrapping
SAS/STAT
IBM SPSS Bootstrapping
BootCL, BootPR, boot, bootRes, BootStepAIC, bootspecdens, bootstrap, FRB, gPdtest, meboot, multtest, pvclust, rqmcmb2, scaleboot, simpleboot
Classification Analysis
Enterprise Miner
IBM SPSS Classification
rattle, see the neural networks and trees entries in this table.
Conjoint Analysis
SAS/STAT: PROC TRANSREG
IBM SPSS Conjoint
homals, psychoR, bayesm
Correspondence Analysis
SAS/STAT: PROC CORRESP
IBM SPSS Categories
ade4, cocorresp, FactoMineR, homals, made4, MASS, psychoR, PTAk, vegan
Custom Tables
Base SAS, PROC REPORT, PROC SQL, PROC TABULATE, Enterprise Reporter
IBM SPSS Custom Tables
reshape
Data Access
SAS/ACCESS
SPSS Data Access Pack
DBI, foreign, Hmisc: sas.get, sasxport.get, RODBC
Data Collection
SAS/FSP
IBM SPSS Data Collection Family
RSQLite, and the other open source programs MySQL or PostgreSQL are popular among R users for this purpose.
Data Mining
Enterprise Miner
IBM SPSS Modeler
(formerly Clementine)
arules, FactoMineR, rattle, various functions
Data Mining, In-database Processing
SAS In-Database Initiative with Teradata
IBM SPSS Modeler
PL/R
Data Preparation
Various procedures
IBM SPSS Data Preparation, various commands
dprep, plyr, reshape, sqldf, various functions
Developer Tools
SAS/AF, SAS/FSP, SAS Integration Technologies, SAS/TOOLKIT IBM SPSS Statistics Developer, IBM SPSS Statistics Programmability Extension
StatET, R links to most popular compilers, scripting languages, and databases.
Direct Marketing
Nothing quite like it
IBM SPSS Direct Marketing
Nothing quite like it
Exact Tests
SAS/STAT various
IBM SPSS Exact Tests
coin, elrm, exactLoglinTest, exactmaxsel, and options in many others
Excel Integration
SAS Enterprise BI Server IBM SPSS Advantage for Excel 2007
RExcel
Forecasting
SAS/ETS
IBM SPSS Forecasting
Over 40 packages that do time series are described at the Task View link above under Time Series.
Forecasting, Automated
Forecast Server IBM SPSS Forecasting
forecast
Genetics JMP Genomics
None http://www.bioconductor.org
Geographic Information Systems
SAS/GIS, SAS/GRAPH
None (Maps is defunct)
maps, mapdata, mapproj, GRASS via spgrass6, RColorBrewer, see Spatial in Task Views at link at top
Graphical user interfaces
Enterprise Guide, IML Studio, SAS/ASSIST, Analyst, Insight
IBM SPSS Statistics Base Deducer, JGR, R Commander, pmg, rattle, many others at http://www.sciviews.org/_rgui/
Graphics, Interactive
SAS/IML Studio, SAS/INSIGHT, JMP
None
GGobi via rggobi, iPlots, latticist, playwith
Graphics, Static
SAS/GRAPH
SPSS Base, Graphics Production Language
ggplot2, gplots, graphics, grid, gridBase, hexbin, lattice, plotrix, scatterplot3d, vcd, vioplot, geneplotter, Rgraphics
Graphics, Template Builder
Doesn’t use Grammar of Graphics model that forms the core of IBM SPSS Viz Designer or R’s ggplot2
IBM SPSS Viz Designer
Doesn’t use templates, but this GUI for ggplot2 http://www.stat.ucla.edu/~jeroen/ggplot2.html works similarly to IBM SPSS Viz Designer.
Guided Analytics
SAS/LAB
None
None
Matrix/linear Algebra
SAS/IML Studio
IBM SPSS Matrix
R, matlab, Matrix, sparseM
Missing Values Imputation
SAS/STAT: PROC MI
IBM SPSS Missing Values
amelia, Hmisc: aregImpute, EMV, rms (replaces Design): fit.mult.impute, mice, mitools, mvnmle, VIM
Neural Networks
Enterprise Miner
IBM SPSS Neural Networks
AMORE, grnnR, neuralnet, nnet, rattle
Operations Research
SAS/OR
None
glpk, linprog, LowRankQP, TSP
Power Analysis
SAS Power and Sample Size Application, SAS/STAT:
PROC POWER,
PROC GLMPOWER
SamplePower
asypow, powerpkg, pwr, MBESS
Quality Control
SAS/QC
IBM SPSS Statistics Base qcc, spc
Regression Models
SAS/STAT
IBM SPSS Regression
R, Hmisc, lasso, VGAM, pda, rms (replaces Design)
Sampling, Complex
SAS/STAT: PROC SURVEY SELECT, SURVEYMEANS, etc.
IBM SPSS Complex Samples
pps, sampfling, sampling, spsurvey, survey
Segmentation Analysis
Enterprise Miner
IBM Modeler Segmentation
cluster, rattle, som, see CRAN Task Views under Cluster for over 70 packages
Server Version
SAS for your particular server IBM SPSS Statistics Server,
IBM SPSS Modeler Server
rapache, R(D)COM Server, Rserve, StatET
Structural Equation Modeling
SAS/STAT: PROC CALIS
Amos OpenMX, sem
Text Analysis/Mining
Text Miner
IBM SPSS Text Analytics,
IBM SPSS Text Analysis for Surveys
Rstem, las, tm
Trees, Decision, Classification or Regression
Enterprise Miner
IBM SPSS Decision Trees, IBM SPSS AnswerTree, IBM SPSS Modeler (formerly Clementine)
ada, adabag, BayesTree, boost, GAMboost, gbev, gbm, maptree, mboost, mvpart, party, pinktoe,
quantregForest, rpart,rpart.permutation, randomForest, rattle, tree

All SAS and SPSS product names are registered trademarks of their respective companies.

Disclaimer- Bob Muenchen and I work for the same University. While we do have interesting conflicts often, his interview was one of the earliest where this blog began.

See- http://sites.google.com/site/r4statistics/interview

Christmas Carol: The Best Software (BI-Stats-Analytics)

There is no best software- they are just optimized for various constraints and tangible as well as intangible needs as defined for users.

  1. There is no best software- they are just optimized for various constraints and tangible as well as intangible needs as defined for users.  ( Image below Citation- support.sas.com )
  2. Price in products is defined as Demand divided by Supply. Sometimes this is Expected Demand over Expected Supply ( see Oil Prices) Everyone grumbles over prices but we pay what we think is fair. ( citation http://bm2.genes.nig.ac.jp/RGM2/index.php?ctv=Survival
  3. Prices in services are defined by value creation as well- Value= Benefit Divided by Cost  Benefits are tangible as in how much money it saves in fraud as well as intangible – how easy it is to start using JMP versus R Commander  Costs are Tangible- How much do we have to pay using our cheque book for this annual license or perpetual license or one time license or maintain contract or application support.Intangible costs are how long I have to hold the phone while talking to customer support and how much time it takes me to find the best solution using the website on my own without a sales person bothering me with frequent calls. (citation- http://academic.udayton.edu/gregelvers/psy216/spss/graphs.htm#tukey
  4. All sales people ( especially in the software industry) spam you with frequent calls, email reminders and how their company is the best company ever with the best software in the history of mankind. That is their job and they are pushed by sales quotas and pulled by their own enthusiasm to sell more to same customer. If you ever bought three licences and found out you just needed two at the end of the year- forgive the salesman. As Arthur Miller said’ All Salesmen are Dreamers  (Citation of STATA graph below http://www.ats.ucla.edu/stat/Stata/library/GraphExamples/code/grbartall.htm)
  5. Technology moves faster than you can say Jackie Robinson. and it is getting faster. Research and Development ( R and D) will always move slower than the speed at which Marketing thinks they can move. See http://www.dilbert.com for more insights on this. You either build a Billion Dollar in house lab ( like Palo Alto – remember) or you go for total outsourcing (like semi conductors and open source do). Or you go for a mix and match. ( Citation- http://people.sc.fsu.edu/~burkardt/html/matlab_graphics/matlab_graphics.html )

Based on the above parameters the best statistical software for 2009 continues to be the software that uses a mixture of Genetic Algorithms, Time Series Based Regression and Sampling – it is the software that runs in the head of the statistical /mathematical / customer BRAIN

Thats the best Software ever.

(Citation – Hugh of http://gapingvoid.com/ )

Happy Hols