Here is an announcement from Predictive Analytics World, the worlds largest vendor neutral conference dedicated to Predictive Analytics alone. Decisionstats has been a blog partner of PAWCON since inception. This is cool stuff!
|
||||||||||||||||||






Here is an announcement from Predictive Analytics World, the worlds largest vendor neutral conference dedicated to Predictive Analytics alone. Decisionstats has been a blog partner of PAWCON since inception. This is cool stuff!
|
||||||||||||||||||
What is Cassandra? Why is this relevant to analytics?
It is the next generation Database that you want your analytics software to be compatible with. Also it is quite easy to learn. Did I mention that if you say “I know how to Hadoop/Big Data” on your resume, you just raised your market price by an extra 30 K$. I mean there is a big demand for analysts and statisticians who can think/slice data from a business perspective AND write that HADOOP/Big Data code.
How do I learn more?
http://www.datastax.com/events/cassandrasf2011
Whats in it for you?
Well, I shifted my poetry to https://poemsforkush.wordpress.com/
On Decisionstats.com This is what I love to write about! I find it cool.
——————————————————–

It’s been almost a year since the first Apache Cassandra Summit in San Francisco. Once again we’ve reserved the beautiful Mission Bay Conference Center. Because the Cassandra community has grown so much in the last year, we’re taking the entire venue. This year’s event will not only include Cassandra, but also Brisk, Apache Hadoop, and more.
We have two rooms set aside for presentations.This year we also have multiple rooms set aside for Birds of a Feather talks, committer meetups, and other small discussions.
We’ve sent out surveys to all the attendees of last year’s conference, as well as a few hundred other members of the community. Below are some of the topics people have requested so far.
If you have topics you’d like to see covered, or you would like to submit a presentation, send a note to lynnbender@datastax.com.
We’ll be providing lunch as well as continuous beverage service — so that you won’t have to take your mind outside the information windtunnel.
We’ll also be hosting a post event party. Details coming shortly.
Submissions and suggestions: If you wish to propose a talk or presentation, or have a suggestion on a topic you’d like to see covered, send a note to Lynn Bender at lynnbender@datastax.com
Sponsorship opportunities: Contact Michael Weir at DataStax: mweir@datastax.com
Apache Cassandra, Cassandra, Apache Hadoop, Hadoop, and Apache are either registered trademarks or trademarks of the Apache Software Foundation in the United States and/or other countries, and are used with permission as of 2011. The Apache Software Foundation has no affiliation with and does not endorse, or review the materials provided at this event, which is managed by DataStax.
The Apache Cassandra Project develops a highly scalable second-generation distributed database, bringing together Dynamo’s fully distributed design and Bigtable’s ColumnFamily-based data model.
Cassandra was open sourced by Facebook in 2008, and is now developed by Apache committers and contributors from many companies.
Here is an announcement from Predictive Analytics World, the worlds largest vendor neutral conference dedicated to Predictive Analytics alone. Decisionstats has been a blog partner of PAWCON since inception. This is cool stuff!
|
||||||||||||||||||
|
||||||||||||||||||

I just saw the Bollywood Movie , Ready (2011) starring Salman Khan and Asin. Salman Khan has been the Charlie Sheen of Indian Cinema for some time now, and the movie plays up to his charm, slapstick humor and slap full action.
Asin is a great actor, and this is not art for the sake of art- it is art to make the people laugh.
Enjoy it but with tempered expectations that you are in for some stupendous Bollywoodish humor.


How to make a bomb search activity using Google CoRelate
First we search for how to make a bomb, it seems this has annual spikes.
http://correlate.googlelabs.com/search?e=how+to+make+a+bomb&t=weekly
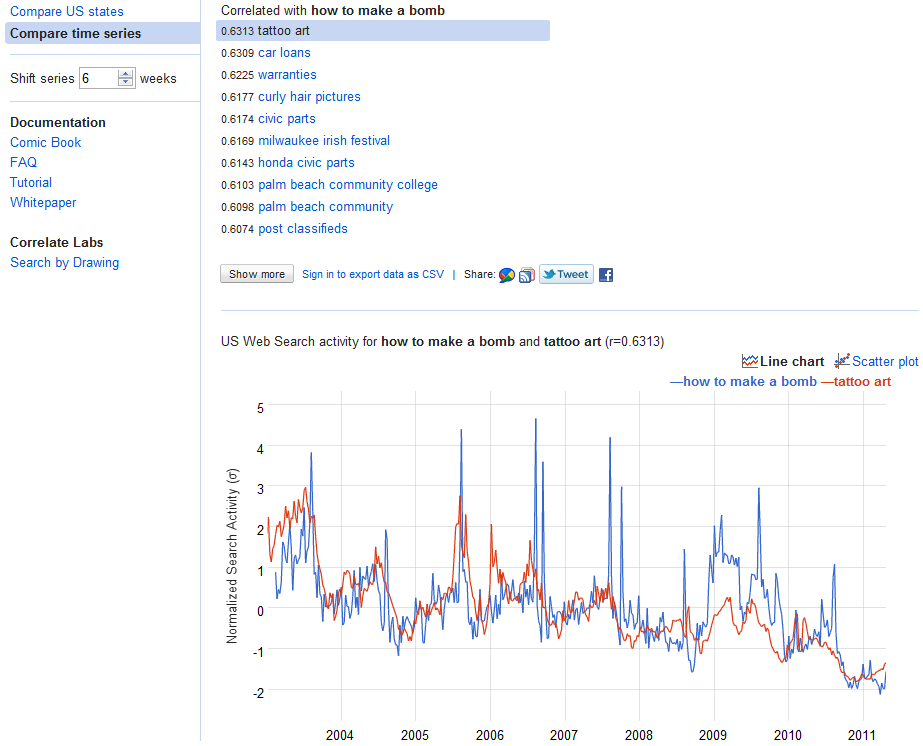
Then we shift series by 6 weeks, assuming the dumbass takes 6 weeks to actually make the bomb.
http://correlate.googlelabs.com/search?e=how+to+make+a+bomb&t=weekly&shift=6
Note -corelation between making pipe bombs and tattoo art is not the same as causation. corelation is not causation unless google comes out with http://causation.google.com
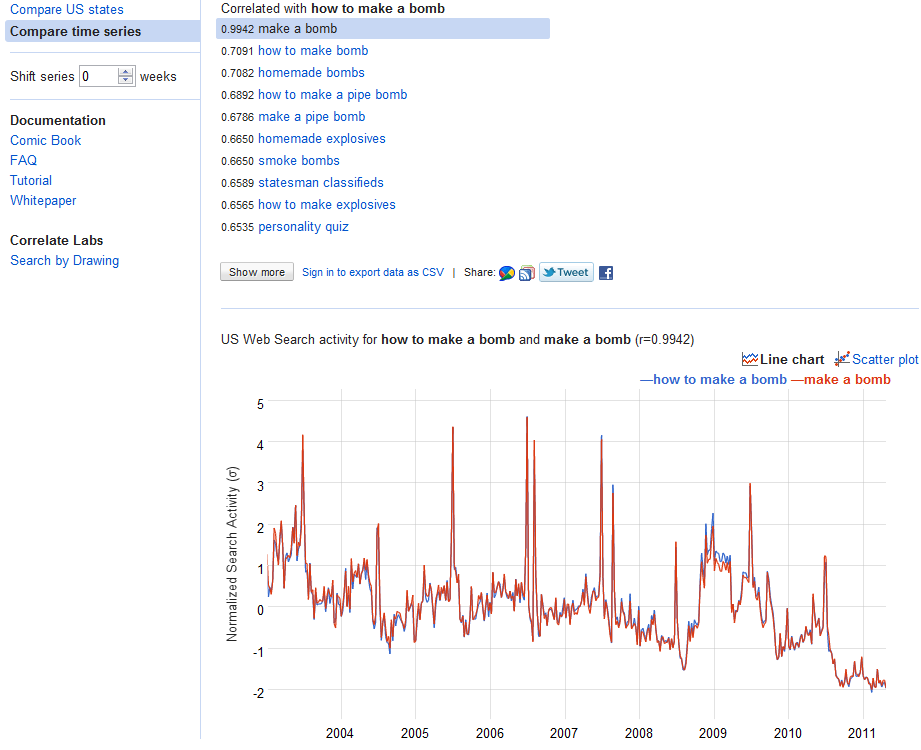
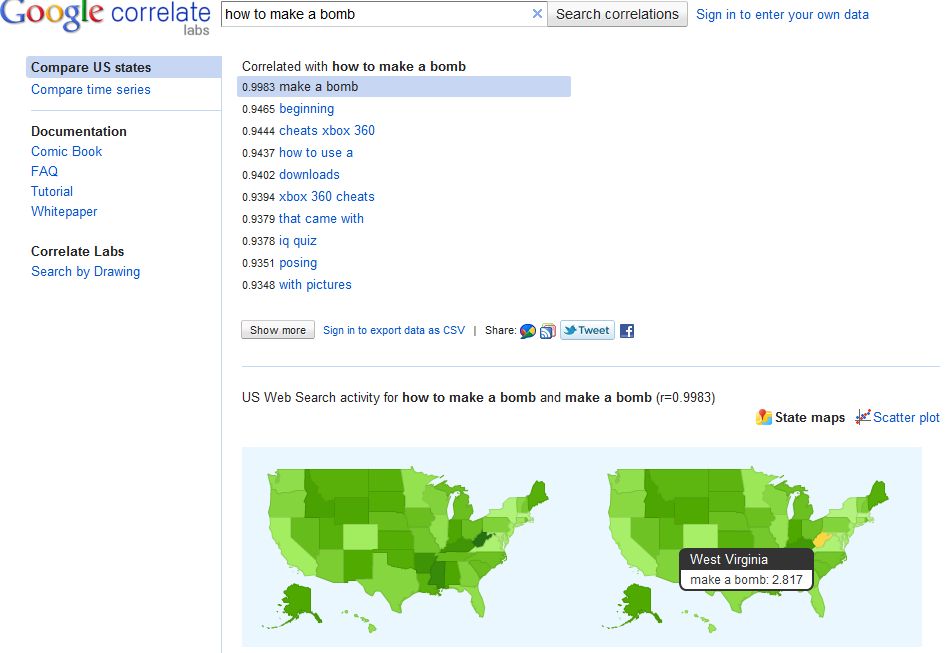
and we see West Virginia likes to search for “how to make a bomb ” 🙂 yeah, right 😉
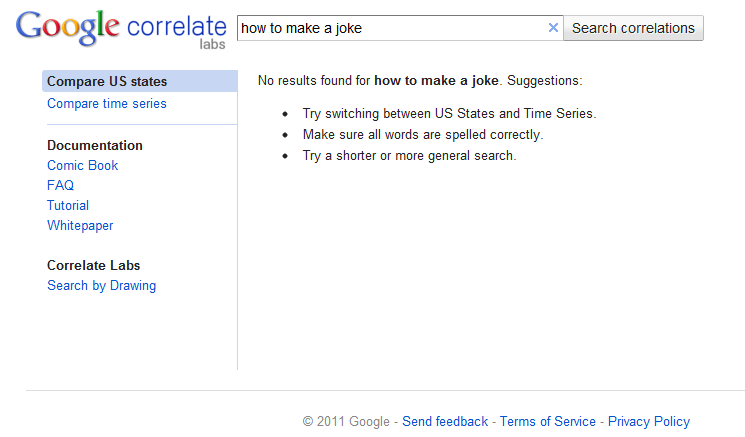
but heres the big oops.
http://correlate.googlelabs.com/search?e=how+to+make+a+joke&t=all
For some time now, I had been hoping for a place where new package or algorithm developers get at least a fraction of the money that iPad or iPhone application developers get. Rapid Miner has taken the lead in establishing a marketplace for extensions. Is there going to be paid extensions as well- I hope so!!
This probably makes it the first “app” marketplace in open source and the second app marketplace in analytics after salesforce.com
It is hard work to think of new algols, and some of them can really be usefull.
Can we hope for #rstats marketplace where people downloading say ggplot3.0 atleast get a prompt to donate 99 cents per download to Hadley Wickham’s Amazon wishlist. http://www.amazon.com/gp/registry/1Y65N3VFA613B
Do you think it is okay to pay 99 cents per iTunes song, but not pay a cent for open source software.
I dont know- but I am just a capitalist born in a country that was socialist for the first 13 years of my life. Congratulations once again to Rapid Miner for innovating and leading the way.
http://rapid-i.com/component/option,com_myblog/show,Rapid-I-Marketplace-Launched.html/Itemid,172
| RapidMiner, Marketplace, Extensions | 30 May 2011 |
| Rapid-I Marketplace Launched by Simon Fischer |
Over the years, many of you have been developing new RapidMiner Extensions dedicated to a broad set of topics. Whereas these extensions are easy to install in RapidMiner – just download and place them in the plugins folder – the hard part is to find them in the vastness that is the Internet. Extensions made by ourselves at Rapid-I, on the other hand, are distributed by the update server making them searchable and installable directly inside RapidMiner.
We thought that this was a bit unfair, so we decieded to open up the update server to the public, and not only this, we even gave it a new look and name. The Rapid-I Marketplace is available in beta mode at http://rapidupdate.de:8180/ . You can use the Web interface to browse, comment, and rate the extensions, and you can use the update functionality in RapidMiner by going to the preferences and entering http://rapidupdate.de:8180/UpdateServer/ as the update server URL. (Once the beta test is complete, we will change the port back to 80 so we won’t have any firewall problems.)
As an Extension developer, just register with the Marketplace and drop me an email (fischer at rapid-i dot com) so I can give you permissions to upload your own extension. Upload is simple provided you use the standard RapidMiner Extension build process and will boost visibility of your extension.
Looking forward to see many new extensions there soon!
Disclaimer- Decisionstats is a partner of Rapid Miner. I have been liking the software for a long long time, and recently agreed to partner with them just like I did with KXEN some years back, and with Predictive AnalyticsConference, and Aster Data until last year.
I still think Rapid Miner is a very very good software,and a globally created software after SAP.
Here is the actual marketplace
http://rapidupdate.de:8180/UpdateServer/faces/index.xhtml
The Rapid-I Marketplace will soon replace the RapidMiner update server. Using this marketplace, you can share your RapidMiner extensions and make them available for download by the community of RapidMiner users. Currently, we are beta testing this server. If you want to use this server in RapidMiner, you must go to the preferences and enter http://rapidupdate.de:8180/UpdateServer for the update url. After the beta test, we will change the port back to 80, which is currently occupied by the old update server. You can test the marketplace as a user (downloading extensions) and as an Extension developer. If you want to publish your extension here, please let us know via the contact form.

| 5/30/11 12:39 PM | User burgetrm has uploaded version 1.1.0 of Imageprocessing. |
| 5/30/11 12:34 PM | User burgetrm has uploaded version 1.0.0 of Imageprocessing. |
| 5/30/11 11:55 AM | User burgetrm has created the new product Imageprocessing. |
| 5/30/11 11:12 AM | User Rapid-I has uploaded version 5.0.7 of RapidMiner. |
| 5/30/11 11:12 AM | User Rapid-I has uploaded version 5.0.2 of RapidMiner. |
This is a short list of several known as well as lesser known R ( #rstats) language codes, packages and tricks to build a business intelligence application. It will be slightly Messy (and not Messi) but I hope to refine it someday when the cows come home.
It assumes that BI is basically-
a Database, a Document Database, a Report creation/Dashboard pulling software as well unique R packages for business intelligence.
What is business intelligence?
Seamless dissemination of data in the organization. In short let it flow- from raw transactional data to aggregate dashboards, to control and test experiments, to new and legacy data mining models- a business intelligence enabled organization allows information to flow easily AND capture insights and feedback for further action.
BI software has lately meant to be just reporting software- and Business Analytics has meant to be primarily predictive analytics. the terms are interchangeable in my opinion -as BI reports can also be called descriptive aggregated statistics or descriptive analytics, and predictive analytics is useless and incomplete unless you measure the effect in dashboards and summary reports.
Data Mining- is a bit more than predictive analytics- it includes pattern recognizability as well as black box machine learning algorithms. To further aggravate these divides, students mostly learn data mining in computer science, predictive analytics (if at all) in business departments and statistics, and no one teaches metrics , dashboards, reporting in mainstream academia even though a large number of graduates will end up fiddling with spreadsheets or dashboards in real careers.
Using R with
1) Databases-
I created a short list of database connectivity with R here at https://rforanalytics.wordpress.com/odbc-databases-for-r/ but R has released 3 new versions since then.
The RODBC package remains the package of choice for connecting to SQL Databases.
http://cran.r-project.org/web/packages/RODBC/RODBC.pdf
Details on creating DSN and connecting to Databases are given at https://rforanalytics.wordpress.com/odbc-databases-for-r/
For document databases like MongoDB and CouchDB
( what is the difference between traditional RDBMS and NoSQL if you ever need to explain it in a cocktail conversation http://dba.stackexchange.com/questions/5/what-are-the-differences-between-nosql-and-a-traditional-rdbms
Basically dispensing with the relational setup, with primary and foreign keys, and with the additional overhead involved in keeping transactional safety, often gives you extreme increases in performance
NoSQL is a kind of database that doesn’t have a fixed schema like a traditional RDBMS does. With the NoSQL databases the schema is defined by the developer at run time. They don’t write normal SQL statements against the database, but instead use an API to get the data that they need.
instead relating data in one table to another you store things as key value pairs and there is no database schema, it is handled instead in code.)
I believe any corporation with data driven decision making would need to both have atleast one RDBMS and one NoSQL for unstructured data-Ajay. This is a sweeping generic statement 😉 , and is an opinion on future technologies.
From- http://tommy.chheng.com/2010/11/03/rmongo-accessing-mongodb-in-r/
http://plindenbaum.blogspot.com/2010/09/connecting-to-mongodb-database-from-r.html
Connecting to a MongoDB database from R using Java
http://nsaunders.wordpress.com/2010/09/24/connecting-to-a-mongodb-database-from-r-using-java/
Also see a nice basic analysis using R Mongo from
http://pseudofish.com/blog/2011/05/25/analysis-of-data-with-mongodb-and-r/
For CouchDB
please see https://github.com/wactbprot/R4CouchDB and
http://digitheadslabnotebook.blogspot.com/2010/10/couchdb-and-r.html
2) External Report Creating Software-
Jaspersoft- It has good integration with R and is a certified Revolution Analytics partner (who seem to be the only ones with a coherent #Rstats go to market strategy- which begs the question – why is the freest and finest stats software having only ONE vendor- if it was so great lots of companies would make exclusive products for it – (and some do -see https://rforanalytics.wordpress.com/r-business-solutions/ and https://rforanalytics.wordpress.com/using-r-from-other-software/)
From
http://www.jaspersoft.com/sites/default/files/downloads/events/Analytics%20-Jaspersoft-SEP2010.pdf
we see
http://jasperforge.org/projects/rrevodeployrbyrevolutionanalytics
RevoConnectR for JasperReports Server
RevoConnectR for JasperReports Server RevoConnectR for JasperReports Server is a Java library interface between JasperReports Server and Revolution R Enterprise’s RevoDeployR, a standardized collection of web services that integrates security, APIs, scripts and libraries for R into a single server. JasperReports Server dashboards can retrieve R charts and result sets from RevoDeployR.
http://jasperforge.org/plugins/esp_frs/optional_download.php?group_id=409
R and BI – Integrating R with Open Source Business
Intelligence Platforms Pentaho and Jaspersoft
David Reinke, Steve Miller
Keywords: business intelligence
Increasingly, R is becoming the tool of choice for statistical analysis, optimization, machine learning and
visualization in the business world. This trend will only escalate as more R analysts transition to business
from academia. But whereas in academia R is often the central tool for analytics, in business R must coexist
with and enhance mainstream business intelligence (BI) technologies. A modern BI portfolio already includes
relational databeses, data integration (extract, transform, load – ETL), query and reporting, online analytical
processing (OLAP), dashboards, and advanced visualization. The opportunity to extend traditional BI with
R analytics revolves on the introduction of advanced statistical modeling and visualizations native to R. The
challenge is to seamlessly integrate R capabilities within the existing BI space. This presentation will explain
and demo an initial approach to integrating R with two comprehensive open source BI (OSBI) platforms –
Pentaho and Jaspersoft. Our efforts will be successful if we stimulate additional progress, transparency and
innovation by combining the R and BI worlds.
The demonstration will show how we integrated the OSBI platforms with R through use of RServe and
its Java API. The BI platforms provide an end user web application which include application security,
data provisioning and BI functionality. Our integration will demonstrate a process by which BI components
can be created that prompt the user for parameters, acquire data from a relational database and pass into
RServer, invoke R commands for processing, and display the resulting R generated statistics and/or graphs
within the BI platform. Discussion will include concepts related to creating a reusable java class library of
commonly used processes to speed additional development.
If you know Java- try http://ramanareddyg.blog.com/2010/07/03/integrating-r-and-pentaho-data-integration/
and I like this list by two venerable powerhouses of the BI Open Source Movement
http://www.openbi.com/demosarticles.html
Open Source BI as disruptive technology
http://www.openbi.biz/articles/osbi_disruption_openbi.pdf
Open Source Punditry
| TITLE | AUTHOR | COMMENTS |
|---|---|---|
| Commercial Open Source BI Redux | Dave Reinke & Steve Miller | An review and update on the predictions made in our 2007 article focused on the current state of the commercial open source BI market. Also included is a brief analysis of potential options for commercial open source business models and our take on their applicability. |
| Open Source BI as Disruptive Technology | Dave Reinke & Steve Miller | Reprint of May 2007 DM Review article explaining how and why Commercial Open Source BI (COSBI) will disrupt the traditional proprietary market. |
| TITLE | AUTHOR | COMMENTS |
|---|---|---|
| R You Ready for Open Source Statistics? | Steve Miller | R has become the “lingua franca” for academic statistical analysis and modeling, and is now rapidly gaining exposure in the commercial world. Steve examines the R technology and community and its relevancy to mainstream BI. |
| R and BI (Part 1): Data Analysis with R | Steve Miller | An introduction to R and its myriad statistical graphing techniques. |
| R and BI (Part 2): A Statistical Look at Detail Data | Steve Miller | The usage of R’s graphical building blocks – dotplots, stripplots and xyplots – to create dashboards which require little ink yet tell a big story. |
| R and BI (Part 3): The Grooming of Box and Whiskers | Steve Miller | Boxplots and variants (e.g. Violin Plot) are explored as an essential graphical technique to summarize data distributions by categories and dimensions of other attributes. |
| R and BI (Part 4): Embellishing Graphs | Steve Miller | Lattices and logarithmic data transformations are used to illuminate data density and distribution and find patterns otherwise missed using classic charting techniques. |
| R and BI (Part 5): Predictive Modelling | Steve Miller | An introduction to basic predictive modelling terminology and techniques with graphical examples created using R. |
| R and BI (Part 6) : Re-expressing Data |
Steve Miller | How do you deal with highly skewed data distributions? Standard charting techniques on this “deviant” data often fail to illuminate relationships. This article explains techniques to re-express skewed data so that it is more understandable. |
| The Stock Market, 2007 | Steve Miller | R-based dashboards are presented to demonstrate the return performance of various asset classes during 2007. |
| Bootstrapping for Portfolio Returns: The Practice of Statistical Analysis | Steve Miller | Steve uses the R open source stats package and Monte Carlo simulations to examine alternative investment portfolio returns…a good example of applied statistics using R. |
| Statistical Graphs for Portfolio Returns | Steve Miller | Steve uses the R open source stats package to analyze market returns by asset class with some very provocative embedded trellis charts. |
| Frank Harrell, Iowa State and useR!2007 | Steve Miller | In August, Steve attended the 2007 Internation R User conference (useR!2007). This article details his experiences, including his meeting with long-time R community expert, Frank Harrell. |
| An Open Source Statistical “Dashboard” for Investment Performance | Steve Miller | The newly launched Dashboard Insight web site is focused on the most useful of BI tools: dashboards. With this article discussing the use of R and trellis graphics, OpenBI brings the realm of open source to this forum. |
| Unsexy Graphics for Business Intelligence | Steve Miller | Utilizing Tufte’s philosophy of maximizing the data to ink ratio of graphics, Steve demonstrates the value in dot plot diagramming. The R open source statistical/analytics software is showcased. |
 brew: Templating Framework for Report Generation

brew implements a templating framework for mixing text and R code for report generation. brew template syntax is similar to PHP, Ruby's erb module, Java Server Pages, and Python's psp module. http://bit.ly/jINmaI
http://dirk.eddelbuettel.com/blog/2011/01/16/#overbought_oversold_plot