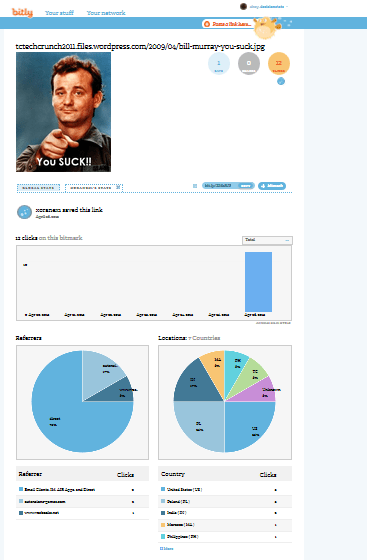
Adding a + to the bit.ly link you get to get analytics on your spammers

Just add a + sign to any bit.ly link and you get to see associated analytics for that link.

you can get information (traffic, referrers, locations, conversations) about any Bit.ly link simply by taking the short URL and adding a “+” at the end (minus the quotes)

Click on the image below and notice the + sign in the URL.

Read more here this can be useful than just fun-

Using Bit.ly for Spying, Link Building and Happiness

Unrelated- I interview Hilary Mason, Analytics legend and Bit.ly Chief Scientist here –

Interview Hilary Mason Chief Scientist bitly
nah

Using R for Cricket Analysis #rstats #IPL

#Downloading the Data for batting across all formats of cricket
library(XML)
url="http://stats.espncricinfo.com/ci/engine/stats/index.html?class=11;template=results;type=batting"
tables=readHTMLTable(url,stringsAsFactors = F)
#Note we wrote stringsAsFactors=F in this to avoid getting factor variables, 
#since we will need to convert these variables to numeric variables
table2=tables$"Overall figures"
rm(tables)
#Creating new variables from Span
table2$Debut=as.numeric(substr(table2$Span,1,4))
table2$LastYr=as.numeric(substr(table2$Span,6,10))
table2$YrsPlayed=table2$LastYr-table2$Debut
#Creating New Variables. In cricket a not out score is denoted by * which can cause data quality error. 
#This is treated by grepl for finding and gsub for removing the *. 
#Note the double \ to escape regex charachter
table2$HSNotOut=grepl("\\*",table2$HS)
table2$HS2=gsub("\\*","",table2$HS)
#Creating a FOR Loop (!) to convert variables to numeric variables
for (i in 3:17) {
+     table2[, i] <- as.numeric(table2[, i])
+ }

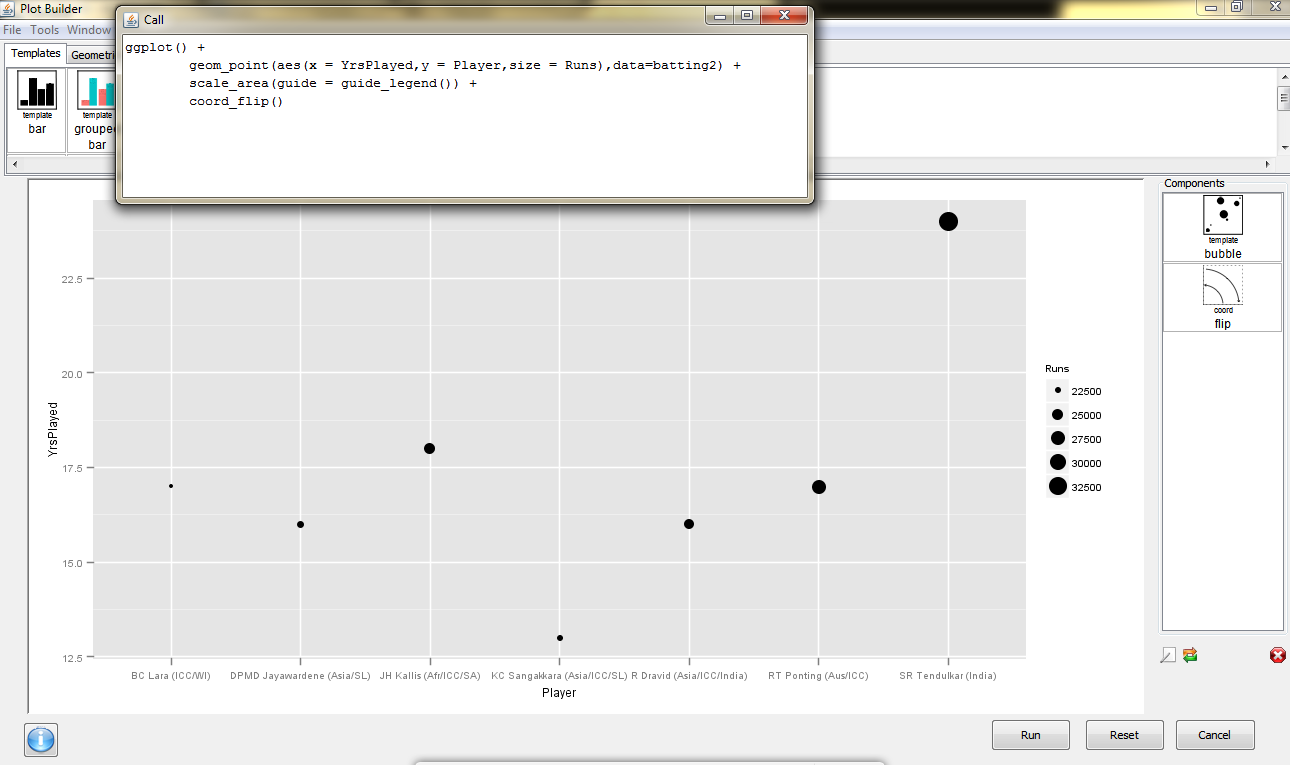
and we see why Sachin Tendulkar is the best (by using ggplot via Deducer)

dmancasestudy5

Also see 

  • Freaknomics Challenge-
    1. Prove match fixing does not and cannot exist in IPL
    2. Create an ideal fantasy team


Run Programs in Windows 7

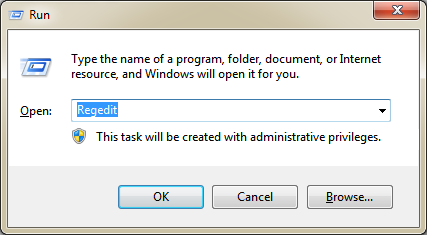
Click Windows Button +R . The Windows Button is the one with the logo.

You will see this.

Now write the name of program you want to edit and go.

Regedit

Using R for Cricket Analysis #rstats

ESPN Crincinfo is the best site for cricket data (you can see an earlier detailed post on the database  here https://decisionstats.com/2012/04/07/cricinfo-statsguru-database-for-statistical-and-graphical-analysis/  ), and using the XML package in R we can easily scrape and manipulate data

Here is the code.

library(XML)
url="http://stats.espncricinfo.com/ci/engine/stats/index.html?class=1;team=6;template=results;type=batting"
#Note I can also break the url string and use paste command to modify this url with parameters
tables=readHTMLTable(url)
tables$"Overall figures"

#Now see this- since I only got 50 results in each page, I look at the url of next page

table1=tables$"Overall figures"
url="http://stats.espncricinfo.com/ci/engine/stats/index.html?class=1;page=2;team=6;template=results;type=batting"
tables=readHTMLTable(url)
table2=tables$"Overall figures"

#Now I need to join these two tables vertically

table3=rbind(table1,table2)

Note-I can also automate the web scraping .
Now the data is within R, we can use something like Deducer to visualize.
Created by Pretty R at inside-R.org

Jetstrap for builiding websites with Twitter Bootstrap

Twitter Bootstrap is a free collection of tools for creating websites and web applications. It contains HTML and CSS-based design templates for typography, forms, buttons, charts, navigation and other interface components, as well as optional JavaScript extensions.

It is the most popular project in GitHub[2] and is used by NASA and MSNBC among others.

———————-

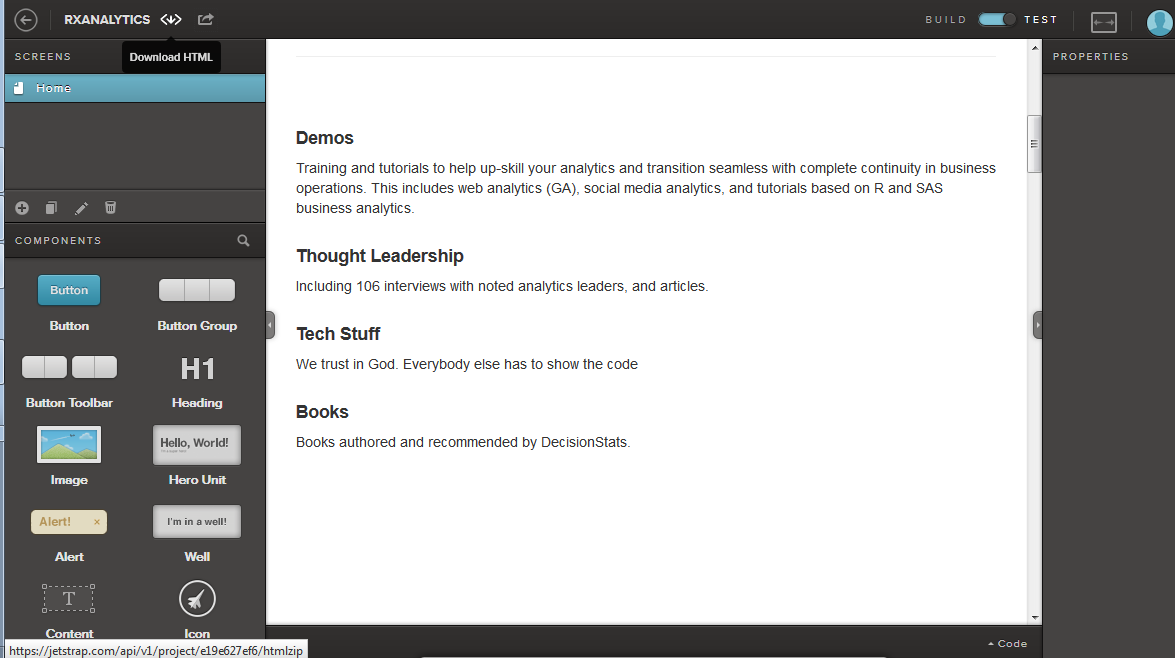
If you like me, hate to get down and dirty in HTML, CSS , JQuery ( not mentioning the excellent Code Academy HTML/CSS tutorials and  JQuery Track ) and want to create a pretty simple website for yourself- Jetstrap helps you build the popular Twitter Bootstrap design (very minimalistic) for websites.

And it’s free! And click and point and paste your content- and awesome CSS, HTML. Allows you to download the HTML to paste in your existing site!

2

Here is one I created in 5 minutes!

123

So lose your old website! Because not every website needs WordPress!

Try Jetstrap for Bootstrap!

Visual Guides to CRISP-DM ,KDD and SEMMA

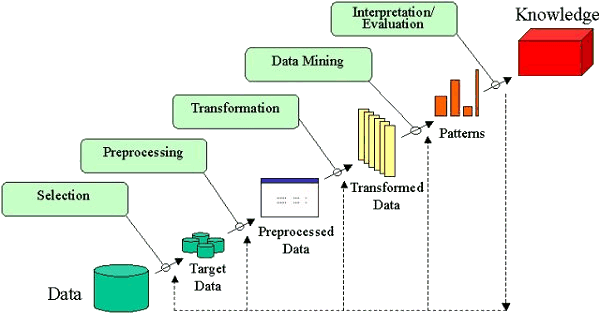
UPDATED- Here are three great examples of a visualization making a process easy to understand. Please click on the images to read them clearly.

1) It visualizes CRISP-DM and is made by Nicole Leaper (http://exde.wordpress.com/2009/03/13/a-visual-guide-to-crisp-dm-methodology/)

12345

2) KDD -Knowledge Discovery in Databases -visualization by Fayyad whom I have interviewed here at http://www.decisionstats.com/interview-dr-usama-fayyad-founder-open-insights-llc/

and work By Gregory Piatetsky Shapiro interviewed by this website here

https://decisionstats.com/2009/08/13/interview-gregory-piatetsky-kdnuggets-com/

kdd

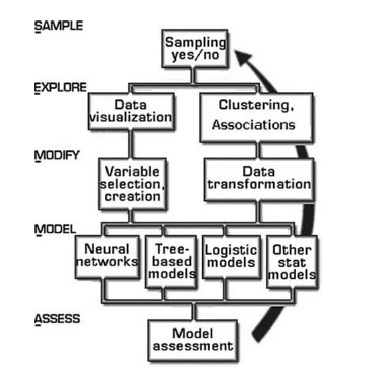
3) I am also attaching a visual representation of SEMMA from http://www.dataprix.net/en/blogs/respinosamilla/theory-data-mining

metodo-semma


Top 10 Regrets on Learning the SAS Language

  1. I didn’t learn the SAS Macro Language enough. SAS Macros are cool, and fast. Ditto for arrays. or ODS.
  2. Not keeping up with the changes in Version 9+. Especially the hash method.(Why name a technique after a recreational drug,  most unfair)
  3. Not studying more statistics theory.
  4. Flunking SAS Certification Twice.
  5. Not making enough money because customers need a solution not a p value.
  6. There is no Proc common sense. There is no Proc Clean the Data.
  7. No Macros to automate the model. Here is dirty data. There is clean model.  Wait till version 16.
  8. Not getting selected by SAS R & D.Not applying to SAS R & D.
  9. Google has better voice recognition for typing notes. No Voice Recognition in SAS langvuage to type syntax.
  10. Enhanced Editor and EG are both idiotic junk pushed by Marketing!

Inspired by true events at

http://www.sascommunity.org/wiki/Category:Bricolage