Using R for Cricket Analysis #rstats

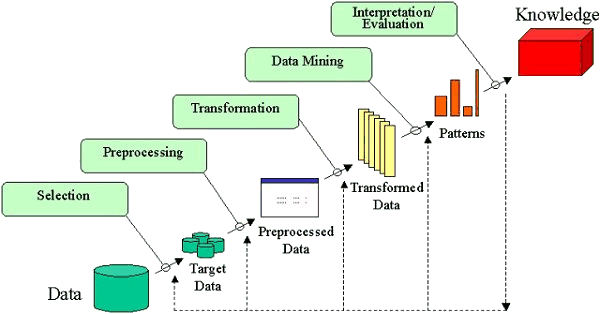
ESPN Crincinfo is the best site for cricket data (you can see an earlier detailed post on the database  here https://decisionstats.com/2012/04/07/cricinfo-statsguru-database-for-statistical-and-graphical-analysis/  ), and using the XML package in R we can easily scrape and manipulate data

Here is the code.

library(XML)
url="http://stats.espncricinfo.com/ci/engine/stats/index.html?class=1;team=6;template=results;type=batting"
#Note I can also break the url string and use paste command to modify this url with parameters
tables=readHTMLTable(url)
tables$"Overall figures"

#Now see this- since I only got 50 results in each page, I look at the url of next page

table1=tables$"Overall figures"
url="http://stats.espncricinfo.com/ci/engine/stats/index.html?class=1;page=2;team=6;template=results;type=batting"
tables=readHTMLTable(url)
table2=tables$"Overall figures"

#Now I need to join these two tables vertically

table3=rbind(table1,table2)

Note-I can also automate the web scraping .
Now the data is within R, we can use something like Deducer to visualize.
Created by Pretty R at inside-R.org

Visual Guides to CRISP-DM ,KDD and SEMMA

UPDATED- Here are three great examples of a visualization making a process easy to understand. Please click on the images to read them clearly.

1) It visualizes CRISP-DM and is made by Nicole Leaper (http://exde.wordpress.com/2009/03/13/a-visual-guide-to-crisp-dm-methodology/)

12345

2) KDD -Knowledge Discovery in Databases -visualization by Fayyad whom I have interviewed here at http://www.decisionstats.com/interview-dr-usama-fayyad-founder-open-insights-llc/

and work By Gregory Piatetsky Shapiro interviewed by this website here

https://decisionstats.com/2009/08/13/interview-gregory-piatetsky-kdnuggets-com/

kdd

3) I am also attaching a visual representation of SEMMA from http://www.dataprix.net/en/blogs/respinosamilla/theory-data-mining

metodo-semma


Top 10 Regrets on Learning the SAS Language

  1. I didn’t learn the SAS Macro Language enough. SAS Macros are cool, and fast. Ditto for arrays. or ODS.
  2. Not keeping up with the changes in Version 9+. Especially the hash method.(Why name a technique after a recreational drug,  most unfair)
  3. Not studying more statistics theory.
  4. Flunking SAS Certification Twice.
  5. Not making enough money because customers need a solution not a p value.
  6. There is no Proc common sense. There is no Proc Clean the Data.
  7. No Macros to automate the model. Here is dirty data. There is clean model.  Wait till version 16.
  8. Not getting selected by SAS R & D.Not applying to SAS R & D.
  9. Google has better voice recognition for typing notes. No Voice Recognition in SAS langvuage to type syntax.
  10. Enhanced Editor and EG are both idiotic junk pushed by Marketing!

Inspired by true events at

http://www.sascommunity.org/wiki/Category:Bricolage

R 3.0 launched #rstats

The 3.0 Era for R starts today! Changes include  better Big Data support.

Read the NEWS here

  • install.packages() has a new argument quiet to reduce the amount of output shown.
  • New functions cite() and citeNatbib() have been added, to allow generation of in-text citations from "bibentry" objects. A cite() function may be added to bibstyle() environments.
  • merge() works in more cases where the data frames include matrices. (Wish of PR#14974.)
  • sample.int() has some support for n >= 2^31: see its help for the limitations.A different algorithm is used for (n, size, replace = FALSE, prob = NULL) for n > 1e7 and size <= n/2. This is much faster and uses less memory, but does give different results.
  • list.files() (aka dir()) gains a new optional argument no.. which allows to exclude "." and ".." from listings.
  • Profiling via Rprof() now optionally records information at the statement level, not just the function level.
  • available.packages() gains a "license/restricts_use" filter which retains only packages for which installation can proceed solely based on packages which are guaranteed not to restrict use.
  • File ‘share/licenses/licenses.db’ has some clarifications, especially as to which variants of ‘BSD’ and ‘MIT’ is intended and how to apply them to packages. The problematic licence ‘Artistic-1.0’ has been removed.
  • The breaks argument in hist.default() can now be a function that returns the breakpoints to be used (previously it could only return the suggested number of breakpoints).

LONG VECTORS

This section applies only to 64-bit platforms.

  • There is support for vectors longer than 2^31 – 1 elements. This applies to raw, logical, integer, double, complex and character vectors, as well as lists. (Elements of character vectors remain limited to 2^31 – 1 bytes.)
  • Most operations which can sensibly be done with long vectors work: others may return the error ‘long vectors not supported yet’. Most of these are because they explicitly work with integer indices (e.g. anyDuplicated() and match()) or because other limits (e.g. of character strings or matrix dimensions) would be exceeded or the operations would be extremely slow.
  • length() returns a double for long vectors, and lengths can be set to 2^31 or more by the replacement function with a double value.
  • Most aspects of indexing are available. Generally double-valued indices can be used to access elements beyond 2^31 – 1.
  • There is some support for matrices and arrays with each dimension less than 2^31 but total number of elements more than that. Only some aspects of matrix algebra work for such matrices, often taking a very long time. In other cases the underlying Fortran code has an unstated restriction (as was found for complex svd()).
  • dist() can produce dissimilarity objects for more than 65536 rows (but for example hclust() cannot process such objects).
  • serialize() to a raw vector is unlimited in size (except by resources).
  • The C-level function R_alloc can now allocate 2^35 or more bytes.
  • agrep() and grep() will return double vectors of indices for long vector inputs.
  • Many calls to .C() have been replaced by .Call() to allow long vectors to be supported (now or in the future). Regrettably several packages had copied the non-API .C() calls and so failed.
  • .C() and .Fortran() do not accept long vector inputs. This is a precaution as it is very unlikely that existing code will have been written to handle long vectors (and the R wrappers often assume that length(x) is an integer).
  • Most of the methods for sort() work for long vectors.
  • rank(), sort.list() and order() support long vectors (slowly except for radix sorting).
  • sample() can do uniform sampling from a long vector.

PERFORMANCE IMPROVEMENTS

  • More use has been made of R objects representing registered entry points, which is more efficient as the address is provided by the loader once only when the package is loaded.

    This has been done for packages base, methods, splines and tcltk: it was already in place for the other standard packages.

    Since these entry points are always accessed by the R entry points they do not need to be in the load table which can be substantially smaller and hence searched faster. This does mean that .C / .Fortran / .Call calls copied from earlier versions of R may no longer work – but they were never part of the API.

  • Many .Call() calls in package base have been migrated to .Internal() calls.
  • solve() makes fewer copies, especially when b is a vector rather than a matrix.
  • eigen() makes fewer copies if the input has dimnames.
  • Most of the linear algebra functions make fewer copies when the input(s) are not double (e.g. integer or logical).
  • A foreign function call (.C() etc) in a package without a PACKAGE argument will only look in the first DLL specified in the ‘NAMESPACE’ file of the package rather than searching all loaded DLLs. A few packages needed PACKAGE arguments added.
  • The @<- operator is now implemented as a primitive, which should reduce some copying of objects when used. Note that the operator object must now be in package base: do not try to import it explicitly from package methods.

SIGNIFICANT USER-VISIBLE CHANGES

  • Packages need to be (re-)installed under this version (3.0.0) of R.
  • There is a subtle change in behaviour for numeric index values 2^31 and larger. These never used to be legitimate and so were treated as NA, sometimes with a warning. They are now legal for long vectors so there is no longer a warning, and x[2^31] <- y will now extend the vector on a 64-bit platform and give an error on a 32-bit one.
  • It is now possible for 64-bit builds to allocate amounts of memory limited only by the OS. It may be wise to use OS facilities (e.g. ulimit in a bash shell, limit in csh), to set limits on overall memory consumption of an R process, particularly in a multi-user environment. A number of packages need a limit of at least 4GB of virtual memory to load.

    64-bit Windows builds of R are by default limited in memory usage to the amount of RAM installed: this limit can be changed by command-line option –max-mem-size or setting environment variable R_MAX_MEM_SIZE.


Book Promotion- Click, Buy, Lie , Die

To build awareness of Eric Siegel’s new, acclaimed book, Predictive Analytics: The Power to Predict Who Will Click, Buy, Lie, or Die (published by Wiley Feb. 19),  an offer ya can’t refuse.
Order the book on April 3 via Amazon ($15) for:

1. Free access to the first of 4 modules of the author’s online training program, Predictive Analytics Applied

2. A 35% discount off the full training ($495), or its in-person version, Predictive Analytics for Business, Marketing & Web ($1,495 – Apr 25-26 in NYC)

3. Automatic entrance into a drawing to receive a pass for any Predictive Analytics World this year (San Francisco, Chicago, DC, Boston, London, or Berlin).

Ajay- at $15 a pop, and quite a nice book, it’s a steal! See book review here–

https://decisionstats.com/2013/02/25/book-review-predictive-analytics-the-power-to-predict-who-will-click-buy-lie-or-die/


New Delhi UseRs March 2013 MeetUp #rstats

The fifth New Delhi UseRs Meet Up happened at Mimir Tech’s premises in Green Park, New Delhi. I presented on using GUIs for easier transitioning to R from other software but limited it to Deducer (for data visualization -specifically templates and facets in GGPLOT) and Rattle (for Data Mining). We also discussed a couple of things including how to apply R in other business domains, and open source alternatives to Meetup.com .

Running R and RStudio Server on Red Hat Linux RHEL #rstats

Installing R

  • sudo rpm -ivh http://dl.fedoraproject.org/pub/epel/6/i386/epel-release-6-8.noarch.rpm

(OR sudo rpm -ivh http://dl.fedoraproject.org/pub/epel/6/x86_64/epel-release-6-8.noarch.rpm )

THEN

  • sudo yum install R

THEN

  • sudo R

(and to paste in Linux Window- just use Shift + Insert)

To Install RStudio (from http://www.rstudio.com/ide/download/server)

32-bit

  •  wget http://download2.rstudio.org/rstudio-server-0.97.320-i686.rpm
  •  sudo yum install --nogpgcheck rstudio-server-0.97.320-i686.rpm

OR 64-bit

  •  wget http://download2.rstudio.org/rstudio-server-0.97.320-x86_64.rpm
  •  sudo yum install --nogpgcheck rstudio-server-0.97.320-x86_64.rpm

Then

  • sudo rstudio-server verify-installation

Changing Firewalls in your RHEL

-Change to Root

  • sudo bash 

-Change directory

  • cd etc/sysconfig

-Read Iptables ( or firewalls file)

  • vi iptables

( to quite vi , press escape, then colon :  then q )

-Change Iptables to open port 8787

  • /sbin/iptables -A INPUT -p tcp --dport 8787 -j ACCEPT

Add new user name (here newuser1)

  • sudo useradd newuser1

Change password in new user name

  • sudo passwd newuser1

Now just login to IPADDRESS:8787 with user name and password above

(credit- IBM SmartCloud Support ,http://www.youtube.com/watch?v=woVjq83gJkg&feature=player_embedded, Rstudio help, David Walker http://datamgmt.com/installing-r-and-rstudio-on-redhat-or-centos-linux/, www.google.com ,Michael Grieb)