R Oracle Data Mining

Here is a new package called R ODM and it is an interface to do Data Mining via Oracle Tables through R. You can read more here http://www.oracle.com/technetwork/database/options/odm/odm-r-integration-089013.html and here http://cran.fhcrc.org/web/packages/RODM/RODM.pdf . Also there is a contest for creative use of R and ODM.

R Interface to Oracle Data Mining

The R Interface to Oracle Data Mining ( R-ODM) allows R users to access the power of Oracle Data Mining’s in-database functions using the familiar R syntax. R-ODM provides a powerful environment for prototyping data analysis and data mining methodologies.

R-ODM is especially useful for:

  • Quick prototyping of vertical or domain-based applications where the Oracle Database supports the application
  • Scripting of “production” data mining methodologies
  • Customizing graphics of ODM data mining results (examples: classificationregressionanomaly detection)

The R-ODM interface allows R users to mine data using Oracle Data Mining from the R programming environment. It consists of a set of function wrappers written in source R language that pass data and parameters from the R environment to the Oracle RDBMS enterprise edition as standard user PL/SQL queries via an ODBC interface. The R-ODM interface code is a thin layer of logic and SQL that calls through an ODBC interface. R-ODM does not use or expose any Oracle product code as it is completely an external interface and not part of any Oracle product. R-ODM is similar to the example scripts (e.g., the PL/SQL demo code) that illustrates the use of Oracle Data Mining, for example, how to create Data Mining models, pass arguments, retrieve results etc.

R-ODM is packaged as a standard R source package and is distributed freely as part of the R environment’s Comprehensive R Archive Network ( CRAN). For information about the R environment, R packages and CRAN, see www.r-project.org.

and

Present and win an Apple iPod Touch!
The BI, Warehousing and Analytics (BIWA) SIG is giving an Apple iPOD Touch to the best new presenter. Be part of the TechCast series and get a chance to win!

Consider highlighting a creative use of R and ODM.

BIWA invites all Oracle professionals (experts, end users, managers, DBAs, developers, data analysts, ISVs, partners, etc.) to submit abstracts for 45 minute technical webcasts to our Oracle BIWA (IOUG SIG) Community in our Wednesday TechCast series. Note that the contest is limited to new presenters to encourage fresh participation by the BIWA community.

Also an interview with Oracle Data Mining head, Charlie Berger https://decisionstats.wordpress.com/2009/09/02/oracle/

R Graphics

A great book for R graphics is here. Its especially useful for people who are new into R and or using graphical function primarily.

http://www.stat.auckland.ac.nz/~paul/RGraphics/chapter2.html

image

This is a good textbook till the new edition November 2008 release of Bob Munchien’s R for SAS and SPSS Users (http://www.springer.com/statistics/computational/book/978-0-387-09417-5 )

The existing free copy is at http://oit.utk.edu/scc/RforSAS&SPSSusers.pdf


image

Dude , Wheres my software ?

Here is the reason why .

It would take an average Indian 26 months to buy a software worth 6000 USD (Assuming he didnot spend any money on anything else) while it takes the average UK  citizen only 2 months.

But why Sweden ……see post here on a Swedish Website

Here is a list of countries by per capita GDP in terms of purchasing power parity

(or how much they make on an year).


http://en.wikipedia.org/wiki/List_of_countries_by_GDP_(PPP)_per_capita

Country Analysis Graphics:Many Eyes

The site www.many-eyes.com has an interesting way to share data sets, and offer free visualization options to researchers world wide. Have a look and visit the site if you are doing any country analysis research.

ROC Curve

ROC Curve is a nice modeling concept to know as it will used practically in nearly all models

irrespective of spoefic technique and irrespective of statistical software.

We use the Wikipedia for referring to easy to implement statistics rather than crusty

thick books which seem prohibitely dense and opaque to outsiders

-This is how you define the ROC Curve.

actual value
p n total
prediction
outcome
p’ True
Positive
False
Positive
P’
n’ False
Negative
True
Negative
N’
total P N

true positive (TP)

eqv. with hit
true negative (TN)
eqv. with correct rejection
false positive (FP)
eqv. with false alarm, Type I error
false negative (FN)
eqv. with miss, Type II error
true positive rate (TPR)
eqv. with hit rate, recall, sensitivity
TPR = TP / P = TP / (TP + FN)
false positive rate (FPR)
eqv. with false alarm rate, fall-out
FPR = FP / N = FP / (FP + TN)
accuracy (ACC)
ACC = (TP + TN) / (P + N)
specificity (SPC)
SPC = TN / (FP + TN) = 1 ? FPR
positive predictive value (PPV)
eqv. with precision
PPV = TP / (TP + FP)

Here is a good java enabled page to calculate the ROC Curve.

http://www.rad.jhmi.edu/jeng/javarad/roc/JROCFITi.html

And in case any one asks, ROC stands for Receiver Operating Characteristic. ……

Fast R Graphics

So you don’t know R  because you were always working on office projects and did not have time to learn. The R list looked down on you and told you to read the documentation first. And then you needed to create some fast R graphics and some R code.

Help is here-

Download R from http://www.r-project.org,install it

open it-go to packages> set CRAN Mirror > to your country from drop down

type following in the R GUI near the ‘ >’ prompt-

“install.packages(“rattle”, dependencies=TRUE)”

so it should loook like

>install.packages(“rattle”, dependencies=TRUE)

Wait 15 minutes while downloads happen

Then packages>load package>rattle

Type rattle() at the command prompt

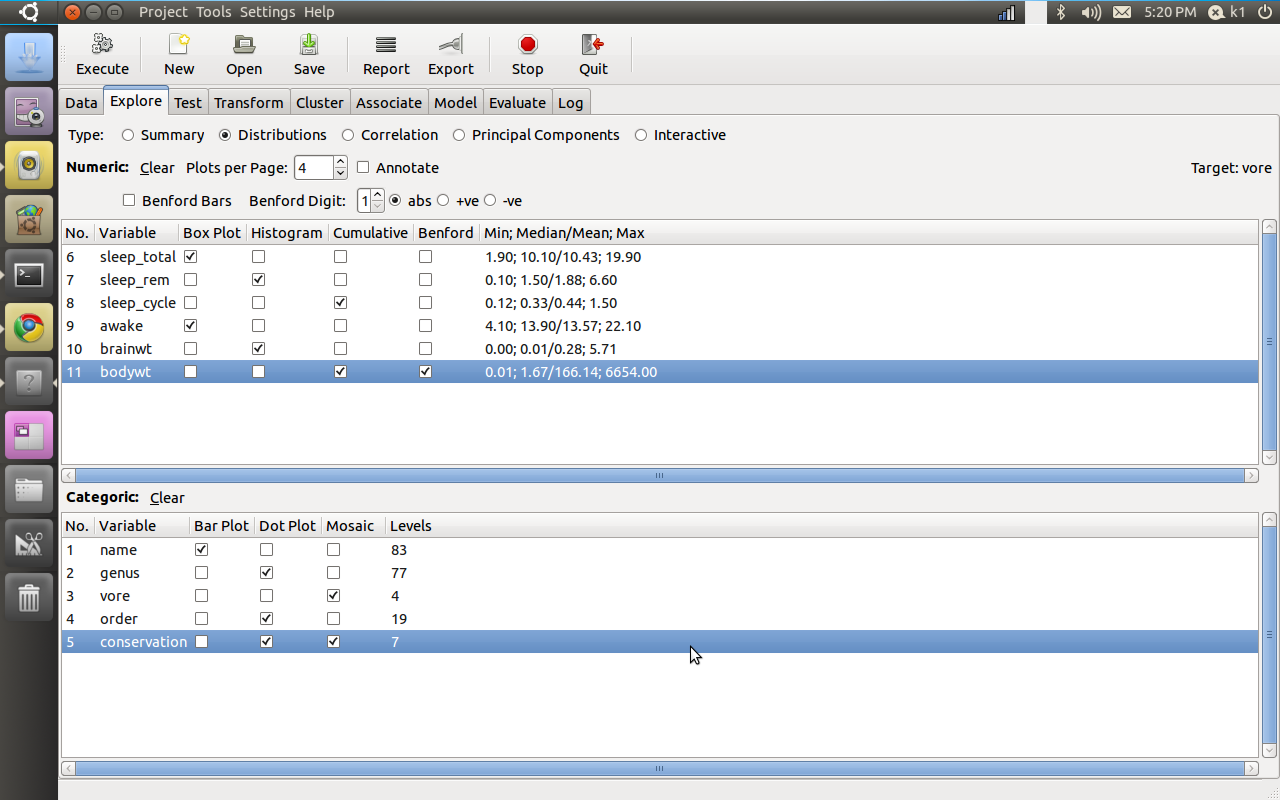
Now – in the new window called Rattle

load data from a .csv file using the browse options

click execute

Go straight to Explore-and click on distibutions.

Note you can also download rattle from www.rattle.togaware.com , these guys are the best.

Here are the graphs


But what about the code (note some variable names disguised).The code may be intimidating to a novice R user but it is auto generated , its like jumping straight to SAS Enterprise without learning SAS Editor-

Go to the last tab -log and

see the auto generated code.