CommeRcial R- Integration in software

Some updates to R on the commercial side.

Revolution Computing is apparently now renamed Revolution Analytics. Hopefully this and the GUI development will help pay more focused attention on working in R in a mainstream office situation. I am still waiting for David Smith’s cheery hey-guys-we-changed-again blog post though at a new site called inside-r.org/ or his old blog site at blog.revolution-computing.com

They probably need to hire more people now – Curt Monash, noted all-things-data software guru has the inside dope here

Techworld writes more here at http://www.techworld.com.au/article/345288/startup_wants_r_alternative_ibm_sas

The company’s software is priced “aggressively” versus IBM and SAS. A single supported workstation costs $2,000 for an annual subscription. Pricing for server-based licenses varies depending on the implementation.

But Revolution Analytics faces a tough challenge from those larger vendors, as well as the likes of XLSolutions, which offers R training and a competing software package, R-Plus.

SPSS though continues to integrate R solidly and also march ahead with Python (which is likely to be the next gen in statistical programming if it keeps up) http://insideout.spss.com/

With the release of Version 18 of IBM SPSS Statistics and the Developer product, easy-to-install versions of the Python and R materials are posted.  In particular, look for the R Essentials link on the main page or from the Plugins page.  It installs the R Plugin, the correct version of R, and a bunch of example R integrations as bundles.  It’s much easier to get going with this now.

Netezza , a business intelligence vendor promises more integration and even a training in R based analytics here

R Modeling for TwinFin i-Class

Objective
Learn how to use TwinFin i-Class for scaling up the R language.

Description
In this class, you’ll learn how to use R to create models using huge data and how to create R algorithms that exploit our asymmetric massively parallel (AMPP®) architecture. Netezza has seamlessly integrated with R to offload the heavy lifting of the computational processing on TwinFin i-Class. This results in higher performance and increased scalability for R. Sign up for this class to learn how to take advantage of TwinFin i-Class for your R modeling. Topics include:

  1. R CRAN package installation on TwinFin i-Class
  2. Creating models using R on TwinFin i-Class
  3. Creating R algorithms for TwinFin i-Class

Format
Hands-on classroom lecture, lab exercises, tour

Audience
Knowledgeable R users – modelers, analytic developers, data miners

Course Length
0.5 day: 12pm-4pm Wednesday, June 23 OR 8am-12pm Thursday, June 24 OR 1pm-5pm Thursday, June 24, 2010

Delivery
Enzee Universe 2010, Boston, MA

Student Prerequisites

  • Working knowledge of R and parallel computing
  • Have analytic, compute-intensive challenges
  • Understanding of data mining and analytics”

My favourite GUI in stats , JMP (also from SAS Institute) is going to deploy R integration as soon as this September – Read more here- http://www.sas.com/news/preleases/JMP-to-R-integrationSGF10.html

Also SAS-IML studio is not lagging behind

The next release of SAS/IML will extend R integration to the server environment – enabling users to deploy results in batch mode and access R from SAS on additional platforms, such as UNIX and Linux.

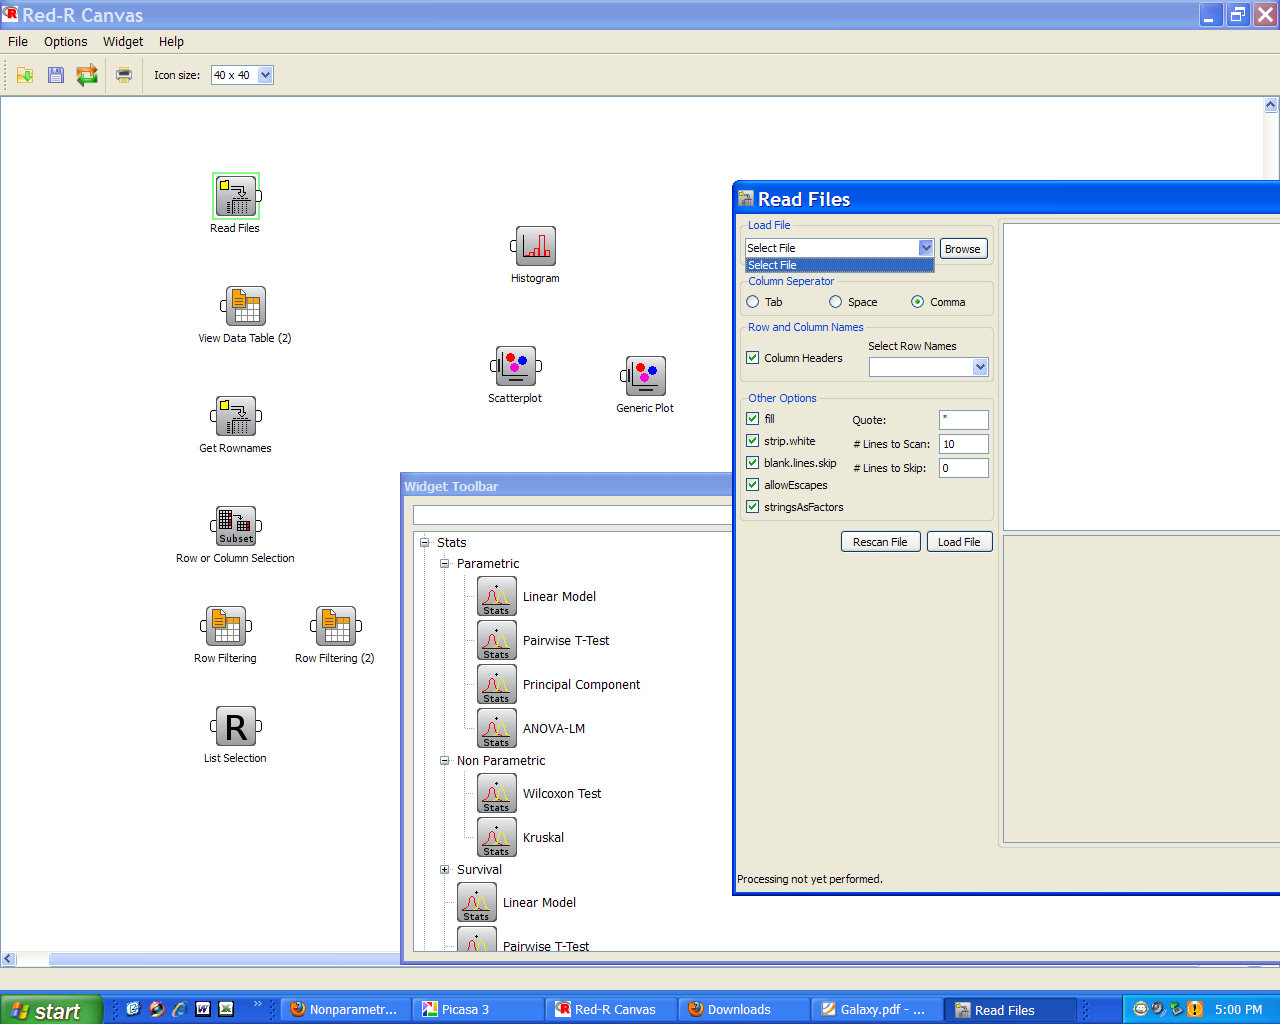
I am kind of happy at one of the best GUI’s integrating with one of the most innovative stats softwares. It’s like two of your best friends getting married. (see screenshots of the softwares)

All in all- R as a platform making good overall progress from all sides of the corporate software spectrum which can only be good for R developers as well as users/students.

Top 10 Graphical User Interfaces in Statistical Software

Here is a list of top 10 GUIs in Statistical Software. The overall criterion is based on-

  • User Friendly Nature for a New User to begin click and point and learn.
  • Cleanliness of Automated Code or Log generated.
  • Practical application in consulting and corporate world.
  • Cost and Ease of Ownership (including purchase,install,training,maintainability,renewal)
  • Aesthetics (or just plain pretty)

However this list is not in order of ranking- ( as beauty (of GUI) lies in eyes of the beholder). For a list of top 10 GUI in R language only please see –

https://rforanalytics.wordpress.com/graphical-user-interfaces-for-r/

This is only a GUI based list so it excludes notable command line or text editor submit commands based softwares which are also very powerful and user friendly.

  1. JMP –

While critics of SAS Institute often complain on the premium pricing of the basic model (especially AFTER the entry of another SAS language software WPS from http://www.teamwpc.co.uk/products/wps – they should try out JMP from http://jmp.com – it has a 1 month free evaluation, is much less expensive and the GUI makes it very very easy to do basic statistical analysis and testing. The learning curve is surprisingly fast to pick it up (as it should be for well designed interfaces) and it allows for very good quality output graphics as well.

2.SPSS

The original GUI in this class of softwares- it has now expanded to a big portfolio of products. However SPSS 18 is nice with the increasing focus on Python and an early adoptee of R compatible interfaces, SPSS does offer a much affordable solution as well with a free evaluation. See especially http://www.spss.com/statistics/ and http://www.spss.com/software/modeling/modeler-pro/

the screenshot here is of SPSS Modeler

3. WPS

While it offers an alternative to Base SAS and SAS /Access software , I really like the affordability (1 Month Free Evaluation and overall lower cost especially for multiple CPU servers ), speed (on the desktop but not on the IBM OS version ) and the intuitive design as well as extensibility of the Workbench. It may look like an integrated development environment and not a proper GUI, but with all the menu features it does qualify as a GUI in my opinion. Continue reading “Top 10 Graphical User Interfaces in Statistical Software”

Norman Nie: R GUI and More

Here is an interview from Norman Nie, SPSS Founder and CEO, REvolution Computing (R Platform).

Some notable thoughts

For example, SPSS was really among the first to deliver rich GUIs that make it easier to use by more people. This is why one of the first things you’ll see from REvolution is a GUI for R – to make R more accessible and hereby further accelerate adoption.

This is good news if executed- I have often written (in agony actually because I use it) for the need for GUIs for R. My last post on that was here. Indeed the one reason SPSS was easily adopted by business school students (like me) in India in 2001-3 was the much better GUI over SAS ‘s GUIs.

However some self delusion/ PR / cognitive dissonance seems at play at Dr Nie’s words

If you look at the last 40 years of university curriculum, SPSS – the product I helped build – has been the dominant player, even becoming the common thread uniting a diverse range of disciplines, which have in turn been applied to business. Data is ubiquitous: tools and data warehouses allow you to query a given set of data repeatedly. R does these things better than the alternatives out there; it is indeed the wave of the future.

SPSS has been a strong number 2- but it has never overtaken SAS. Part of that is SAS handles much bigger datasets much more easily than SPSS did ( and that is where R’s RAM only size can be a concern). Given the decreasing prices of RAM memory, the BIG-LM like packages, and the shift for cloud based computing(with rampable memory on demand) this can be less of an issue- but analysts generally like to have a straight way of handling bigger datasets. Indeed SAS with vertical focus and the recent social media analytics continues to innovate both itself as well as through its alliance partnerships in the Enterprise software world- and REvolution Computing would further need to tie up or sew these analytical partners especially data warehousing or BI providers to ensure R’s analytical functions can be used where there is maximum value for their usage to the corporate customer as well as the academic customer.

Part 2 of Nie’s interview should be interesting .

2010-2011 would likely see

Round 2 : Red Corner ( Nie)                             Gray Corner (Goodnight)

if

Norman Nie can truly deliver a REvolution in Computing

or else

he becomes number two again the second time around to Jim Goodnight’s software giant.

Towards better Statistical Interfaces

I was just walking about the U Tenn campus thinking about my next month departure from the school back to India when I ran into Bob Muenchen , head of the Stats consulting centre and more famously the author of ” R for SAS and SPSS users” . Bob mentioned that the edition for R for Stata should be ready for next month. It was also his idea for the article on Red R.

In fact what perplexes users of statistical software like me is why complex softwares like R or SAS choose interfaces that are clearly not as well designed in simplicity as they are in statistical rigor. I think SPSS to some extent and JMP to a much greater extent represent well designed user interfaces. While Rattle , R Commander , R Analytical Flow and Red R are examples for R interfaces SAS also invested in the Enterprise class interfaces.

On all these I belive there is a much greater need for say a Pro UI designer and clean it up. I was reading Prof Maeda’s laws of simplicity ( see http://lawsofsimplicity.com ) and just comparing and contrasting that with some of the softwares I end up using.

The Principles of Reduce ( Shrink, Hide , Embody ) and Organize ( Sort , Label , Integrate and Priortize ) need to be looked into by the Chief Software Interface designers for analytics and BI. While attempts to create more and more robust and faster algorithms and prettier dashboards are important is it not important to simplify the process and procedures to do so . The software which is easier to learn and pick up will tend to have an edge over less visually designed softwares. Keeping it simple helped Apple in the retail electronics and software , it needs to be seen who or which enterprise BI or BA software will make attempts to do the same. An ideal stats or BI interface should be simple and powerful enough to be used by decision makers directly on occasion rather rely on the middleware of analysts and consultants solely.

Using Red R- R with a Visual Interface

For people complaining about the GUI on R, here is the ah Enterprise Version of R called Red R.

It is available at the website at http://www.red-r.org/


You can read more there or just go through the short video created by them at

Basically it is a click and point method of using R with the ability to store schemas and thus very good for repeatable operations as well.


Not bad for epic software, huh?

R is an epic fail or is it just overhyped

I came across this nice post from someone who is both knowledgeable and experienced in data. I mean I totally agree that data visualization , user interfaces and unstructured data mining are the trends of the future.

What caught my attention were the words from http://www.thejuliagroup.com/blog/?p=433

However, for me personally and for most users, both individual and organizational, the much greater cost of software is the time it takes to install it, maintain it, learn it and document it. On that, R is an epic fail. It does NOT fit with the way the vast majority of people in the world use computers. The vast majority of people are NOT programmers. They are used to looking at things and clicking on things.

Let me analyze this scientifically and dispassionately

R Documentation

I believe that the SAS Online Doc and the SPSS Documentation are both good examples of structured documentation. I do belive that despite the many corporate R products floating- the quality of R documentation is both very extensive and perhaps too big to be put in a neat document something like the ” The Little R Book” or “R Online Doc” would really help.

Entering ? or ?? to search for documentation seems like too difficult work and complex for corporate users it seems. However the documentation for R is not really enterprise software quality is a valid enough point.

Maintaining R

It takes a single line of code or even a single click to update and maintain R.

Apparently the author of the fore mentioned post that existing corporate users are too STUPID OR LAZY to do this.

I like to think most corporate users of statistical software are actually way smarter ( One Hint : They earn money doing that stuff)

Installing R

Anyone who mentions installation costs of software as a reason for enhanced software costs and then mentions R is either biased against R or has not worked with R. Or Both

Learn R

I think anyone cannot learn all R packages just as you cannot learn all the modules of SAS ( like ETS, Stat, etc etc)

R does have more time to learn than Base SAS and this is a valid enough point.

However two R GUI like Rattle and R Commander can help the execution time for this learning.

And increasingly R is taught in universities which is where the battle for future developers or users for platforms like SAS , SPSS , Stata or R would ultimately be decided while the short term monetization of other softwares dazzles people R has too many passionate developers or users to allow it to fail.

However,

R is not perfect. It does need a better corporate version than is currently offered especially to people who are simple users not developers , and it could also to well to better the marketability and visibility of R.

Regarding software costs, ironically while it is easier to estimate how much SAS will cost you in terms of licenses and training time. A similar comparitive document between R and SAS in terms of costs and estimated training costs etc should settle this debate more rationally and more dispassionately than is currently the norm in comparing softwares

Oracle for possible takeover of REvolution Computing

Updated – Mr Smith gave an update in the comments section confirming the post.

From the press release –

Palo Alto, California – April 1, 2010 – REvolution Computing, the leading commercial provider of software and support for the open source “R” statistical computing language, announced that its CEO, Norman Nie, and Vice President of Community and Product Marketing, David Smith, will join Larry Ellison and other senior executives  of Oracle  at the 2010 Oracle  Business Conference at the Palace Hotel in San Francisco on April 17-18.

This meeting is to discuss exciting embedded analytical opportunities and will closely relate to an exciting announcement of recent breakthroughs by their product teams on in-database analytics.

Nie, Smith and Ellison will be available to meet with analysts, reporters and prospective business partners and clients interested in learning more about REvolution’s enterprise software and solutions for predictive analytics based on open source “R,” including new developments in REvolution’s products and recent deployments at leading pharmaceutical and financial services companies.

REvolution Computing is a featured portfolio company of North Bridge Venture Partners, a leading investor in open source companies.