Interview : R For Stata Users

Here is an interview with Bob Muenchen , author of ” R For SAS and SPSS Users” and co-author with Joe Hilbe of ” R for Stata Users”.

Describe your new book R for Stata Users and how it is helpful to users.

Stata is a marvelous software package. Its syntax is well designed, concise and easy to learn. However R offers Stata users advantages in two key areas: education and analysis.

Regarding education, R is quickly becoming the universal language of data analysis. Books, journal articles and conference talks often include R code because it’s a powerful language and everyone can run it. So R has become an essential part of the education of data analysts, statisticians and data miners.

Regarding analysis, R offers a vast array of methods that R users have written. Next to R, Stata probably has more useful user-written add-ons than any other analytic software. The Statistical Software Components collection at Boston College’s Department of Economics is quite impressive (http://ideas.repec.org/s/boc/bocode.html), containing hundreds of useful additions to Stata. However, R’s collection of add-ons currently contains 3,680 packages, and more are being added every week.  Stata users can access these fairly easily by doing their data management in Stata, saving a Stata format data set, importing it into R and running what they need. Working this way, the R program may only be a few lines long.

In our book, the section “Getting Started Quickly” outlines the most essential 50 pages for Stata users to read to work in this way. Of course the book covers all the basics of R, should the reader wish to learn more. Being enthusiastic programmers, we’ll be surprised if they don’t want to read it all.

There are many good books on R, but as I learned the language I found myself constantly wondering how each concept related to the packages I already knew. So in this book we describe R first using Stata terminology and then using R terminology. For example, when introducing the R data frame, we start out saying that it’s just like a Stata data set: a rectangular set of variables that are usually numeric with perhaps one or two character variables. Then we move on to say that R also considers it a special type of “list” which constrains all its “components” to be equal in length. That then leads into entirely new territory.

The entire book is laid out to make learning easy for Stata users. The names used in the table of contents are Stata-based. The reader may look up how to “collapse” a data set by a grouping variable to find that one way R can do that is with the mysteriously named “tapply” function. A Stata user would never have guessed to look for that name

. When reading from cover-to-cover that may not be that big of a deal, but as you go back to look things up it’s a huge time saver. The index is similar in that you can look every subject up by its Stata name to find the R function or vice versa. People see me with both my books near my desk and chuckle that they’re there for advertising. Not true! I look details up in them all the time.

I didn’t have enough in-depth knowledge of Stata to pull this off by myself, so I was pleased to get Joe Hilbe as a co-author. Joe is a giant in the world of Stata. He wrote several of the Stata commands that ship with the product including glm, logistic and manova. He was also the first editor of the Stata Technical Bulletin, which later turned into the Stata Journal. I have followed his work from his days as editor of the statistical software reviews section in the journal The American Statistician. There he not only edited but also wrote many of the reviews which I thoroughly enjoyed reading over the years. If you don’t already know Stata, his review of Stata 9.0 is still good reading (November 1, 2005, 59(4): 335-348).

Describe the relationship between Stata and R and how it is the same or different from SAS / SPSS and R.

This is a very interesting question. I pointed out in R for SAS and SPSS Users that SAS and SPSS are structured very similarly while R is totally different. Stata, on the other hand, has many similarities to R. Here I’ll quote directly from the book:

• Both include rich programming languages designed for writing new analytic methods, not just a set of prewritten commands.

• Both contain extensive sets of analytic commands written in their own languages.

• The pre-written commands in R, and most in Stata, are visible and open for you to change as you please.

• Both save command or function output in a form you can easily use as input to further analysis.

• Both do modeling in a way that allows you to readily apply your models for tasks such as making predictions on new data sets. Stata calls these postestimation commands and R calls them extractor functions.

• In both, when you write a new command, it is on an equal footing with commands written by the developers. There are no additional “Developer’s Kits” to purchase.

• Both have legions of devoted users who have written numerous extensions and who continue to add the latest methods many years before their competitors.

• Both can search the Internet for user-written commands and download them automatically to extend their capabilities quickly and easily.

• Both hold their data in the computer’s main memory, offering speed but limiting the amount of data they can handle.

Can the book be used by a R user for learning Stata

That’s certainly not ideal. The sections that describe the relationship between the two languages would be good to know and all the example programs are presented in both R and Stata form. However, we spend very little time explaining the Stata programs while going into the R ones step by step. That said, I continue to receive e-mails from R experts who learned SAS or SPSS from R for SAS and SPSS Users, so it is possible.

Describe the response to your earlier work R for SAS and SPSS users and if any new editions is forthcoming.

I am very pleased with the reviews for R for SAS and SPSS Users. You can read them all, even the one really bad one, at http://r4stats.com. We incorporated all the advice from those reviews into R for Stata Users, so we hope that this book will be well received too.

In the first book, Appendix B: A Comparison of SAS and SPSS Products with R Packages and Functions has been particularly popular for helping people find the R packages they need. As it expanded, I moved it to the web site: http://r4stats.com/add-on-modules. All three packages are changing so fast that I sometimes edit that table several times per week!
The second edition to R for SAS and SPSS Users is due to the publisher by the end of February, so it will be in the bookstores by sometime in April 2011, if all goes as planned. I have a list of thirty new topics to add, and those won’t all fit. I have some tough decisions to make!
On a personal note, Ajay, it was a pleasure getting to meet you when you came to UT, especially our chats on the current state of the analytics market and where it might be headed. I love the fact that the Internet allows people to meet across thousands of miles. I look forward to reading more on DecisionStats!
About –

Bob Muenchen has twenty-eight years of experience consulting, managing and teaching in a variety of complex, research oriented computing environments. You can read about him here http://web.utk.edu/~muenchen/RobertMuenchenResume.html

The Popularity of Data Analysis Software

Here is a nice page by Bob Muenchen (author of “R for SAS and SPSS” and “R for Stata” books)

It is available at http://r4stats.com/popularity and uses a variety of methods, including Google Insights, Page Rank, Link analysis, as well as information from Rexer Analytics and KDNuggets.

I believe the following two graphs sum it all up:

1 Number of Jobs at Monster.com using keywords

2 Google Scholar’s analysis of academic papers

Despite R’s Rapid Growth which is clearly evident, in terms of jobs as well as publications, it lags behind SAS and SPSS. So if you are a corporate user or an academic user, it makes sense to have more than one skill just to be sure.  What do you think? Is learning R mutually exclusive and completely exhaustive from learning SAS or SPSS. See http://r4stats.com/popularity for the complete analysis by Bob Muenchen

Also it shows the tremendous opportunity for companies like Revolution Analytics and XL Solutions ( http://www.experience-rplus.com/ ) as the potential for growth is clearly evident.

Browser Based Model Creation

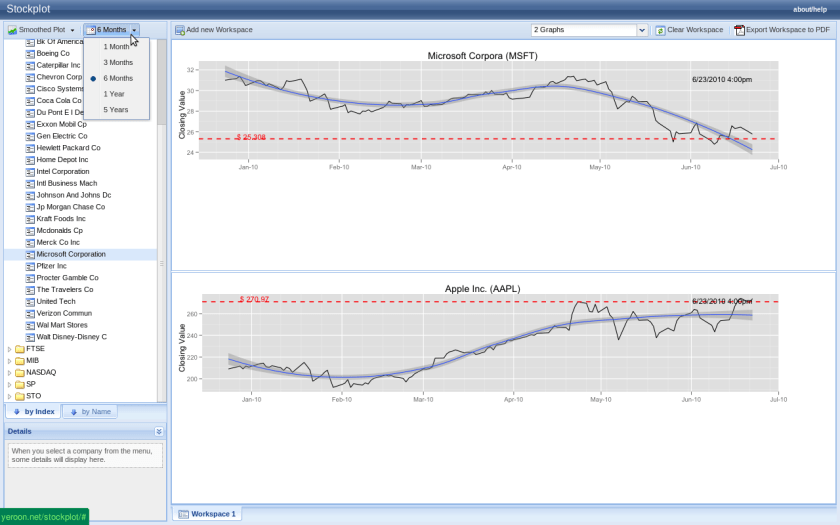
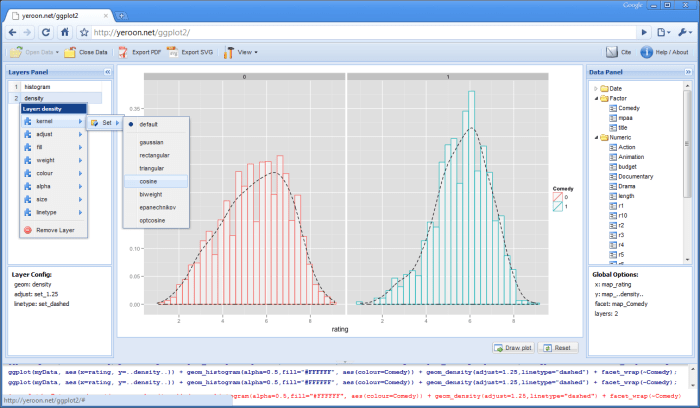
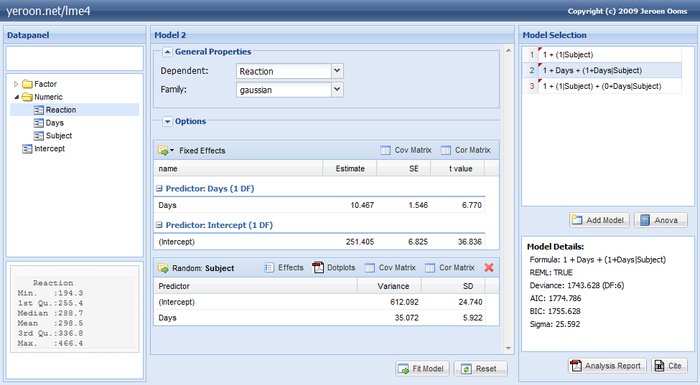
Here are some fabulous applications at http://yeroon.net – if you are in the field of data and / or analytics you should try and dekko this site- it is created by UCLA’s department of statistics.

You can create stockplots ( something similar to based to Yahoo and Google finance which I have covered earlier)

or create ggplot visualizations

or create a linear model

Just using a browser to upload the dataset and thats all the hard/soft ware you need .

Note the background uses R. It would be interesting if companies like Revolution R, SAS and SPSS can do in this browser based computing ( maybe charge like Amazon Ec2 apis)

Kudos and credits to http://www.stat.ucla.edu/~jeroen/

Certifications in Analytics and Business Intelligence

I sometimes get a chat message on Twitter/ Facebook asking for help on some specific data issue. More often than not it is something like – How do I get started in BI/BA /Data stuff. So here is a list of certifications which I think are quite nice as beginning points or even CV multipliers.

[tweetmeme=”Decisionstats”]

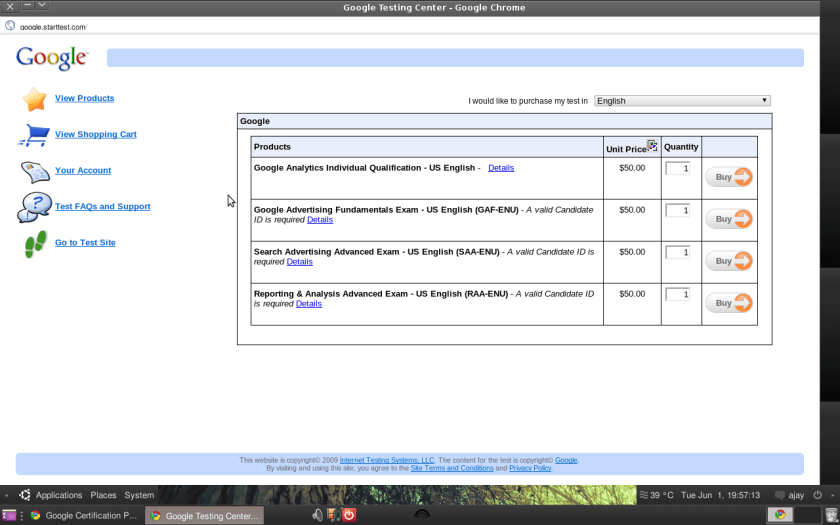
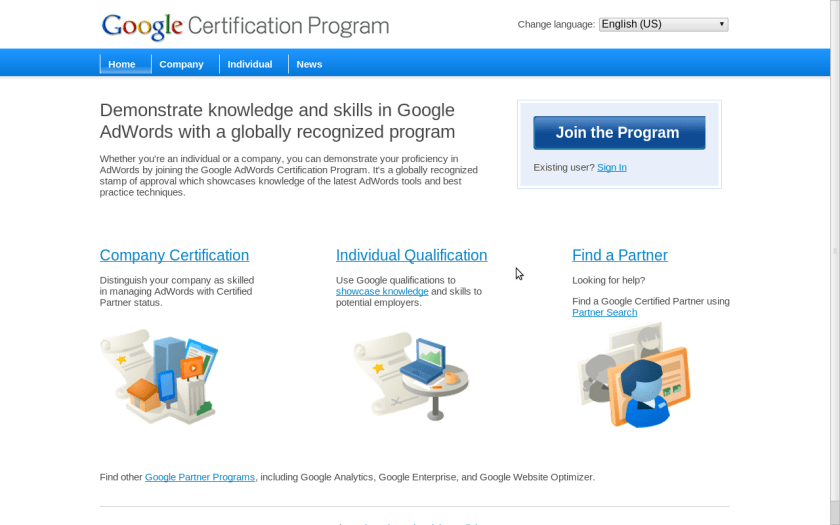
1) Google’s Certifications

http://www.google.com/intl/en/adwords/professionals/

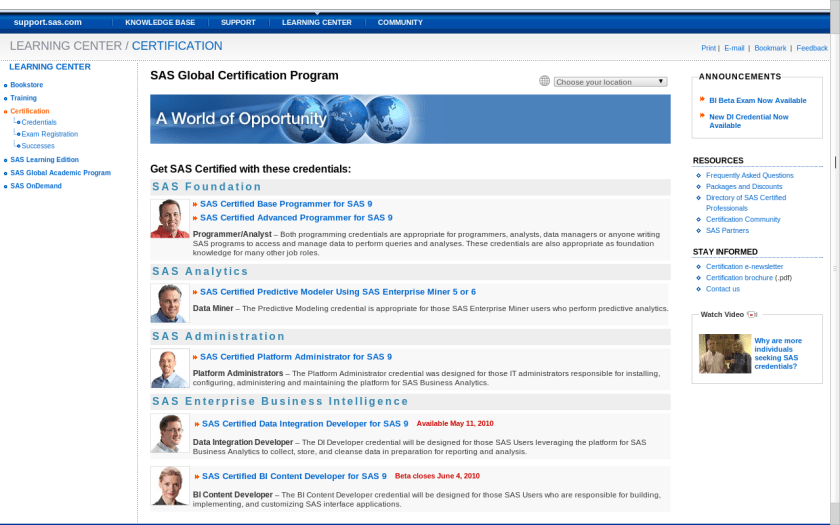
2) SAS Certifications

Quite well established and easily one of the best structured certification programs in the industry.

http://support.sas.com/certify/index.html

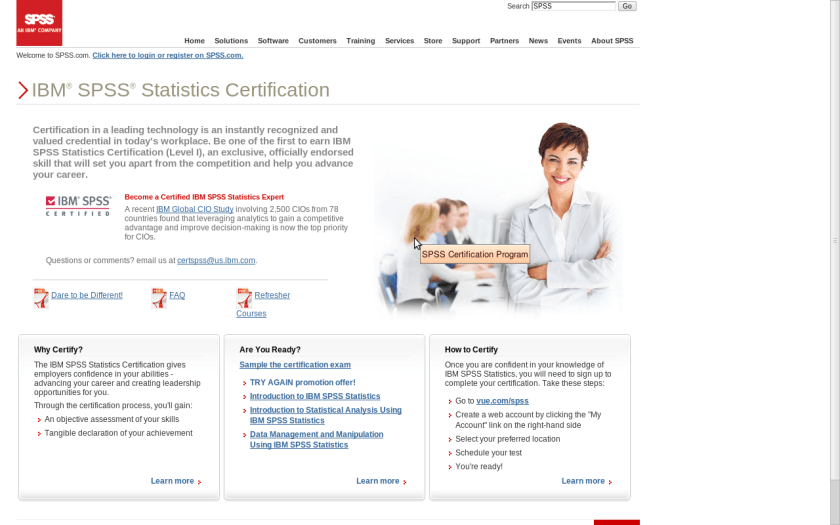
3) SPSS

The SPSS certification began last year and it helps provide a valuable skill set for both your practice as well as your resume. Also useful to have a second skill set apart from SAS in terms of statistical software.

http://www.spss.com/certification/

At this point I would like you to pause and think if the above certifications are useful or cost  effective for you as they are broadly general qualifications in statistical platforms as well as in applying them for the web analytics ( a key area for business analytics).

For more specialized certifications here are some more-

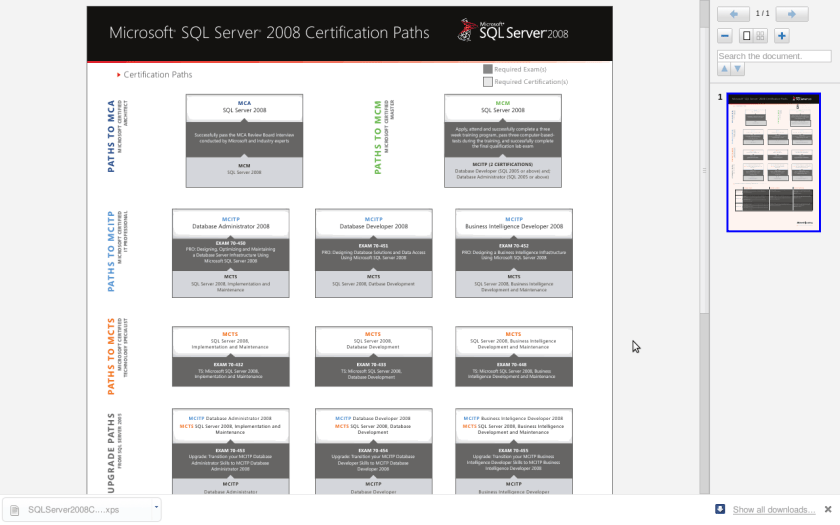
1) Microsoft SQL Server

http://www.microsoft.com/learning/en/us/certification/cert-sql-server.aspx

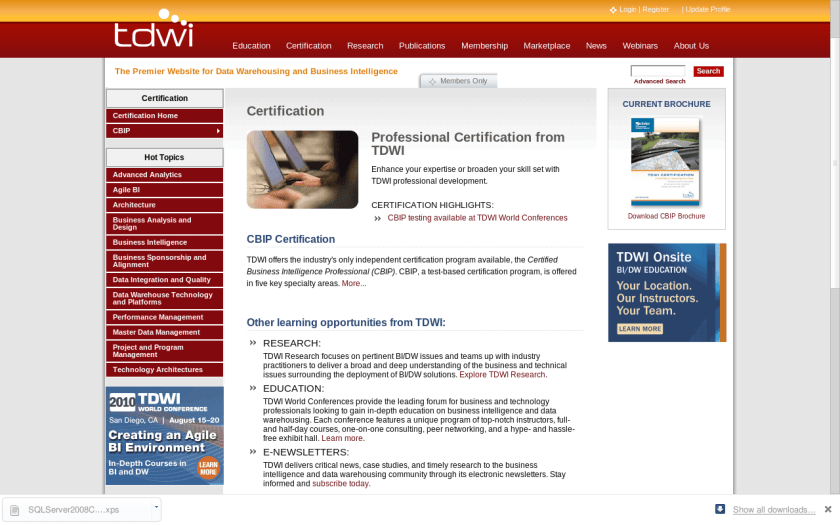
2) TDWI Certification

http://tdwi.org/pages/certification/index.aspx

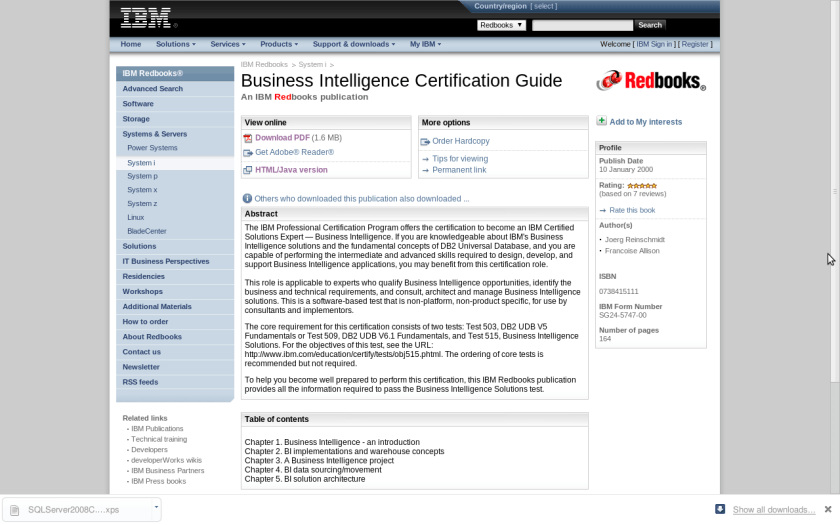
3) IBM

Not sure how updated these are so caveat emptor!

http://www.redbooks.ibm.com/abstracts/sg245747.html

If you are knowledgeable about IBM’s Business Intelligence solutions and the fundamental concepts of DB2 Universal Database, and you are capable of performing the intermediate and advanced skills required to design, develop, and support Business Intelligence applications

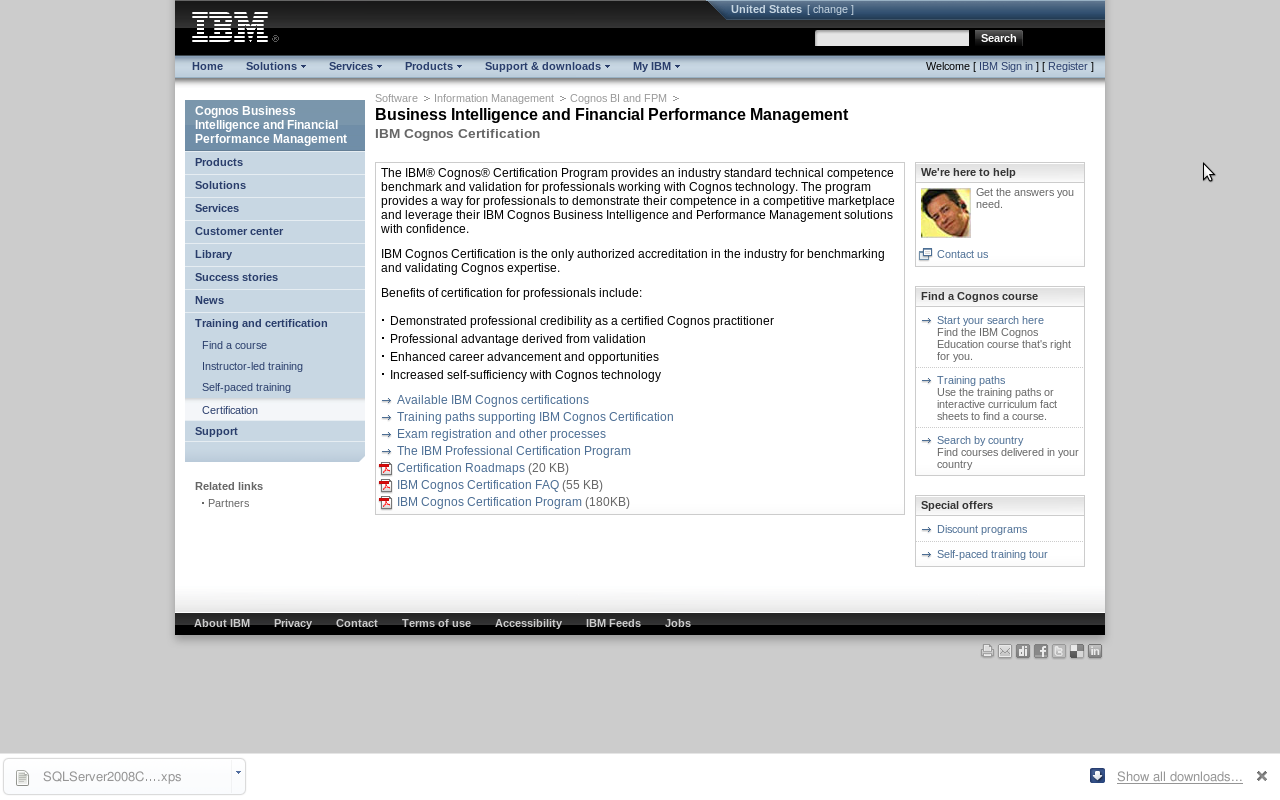
Also IBM Cognos Certifications

http://www-01.ibm.com/software/data/education/cognos-cert.html

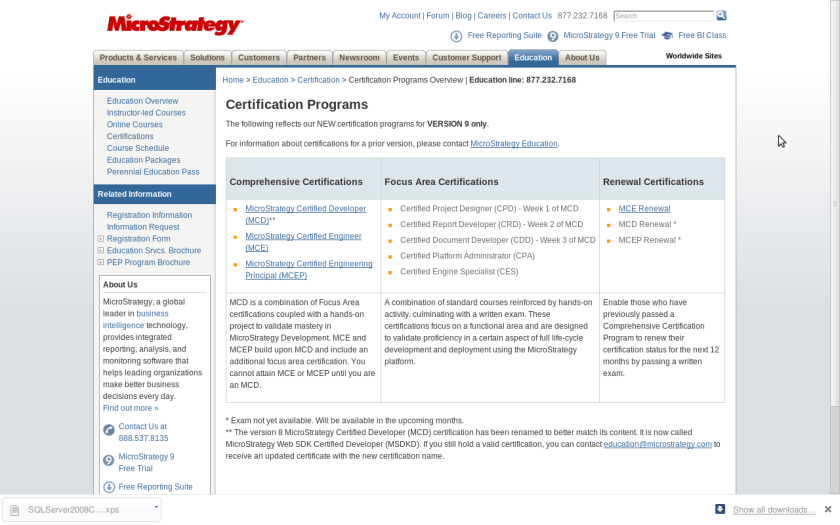
4) MicroStrategy

http://www.microstrategy.com/education/Certification/

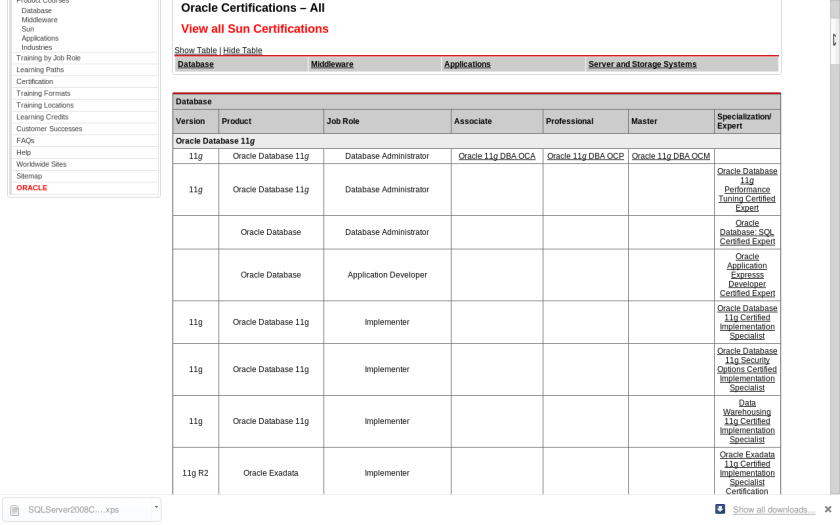
5) Oracle

Included the all new Sun Certifications as well.

http://certification.oracle.com/

and http://blogs.oracle.com/certification/

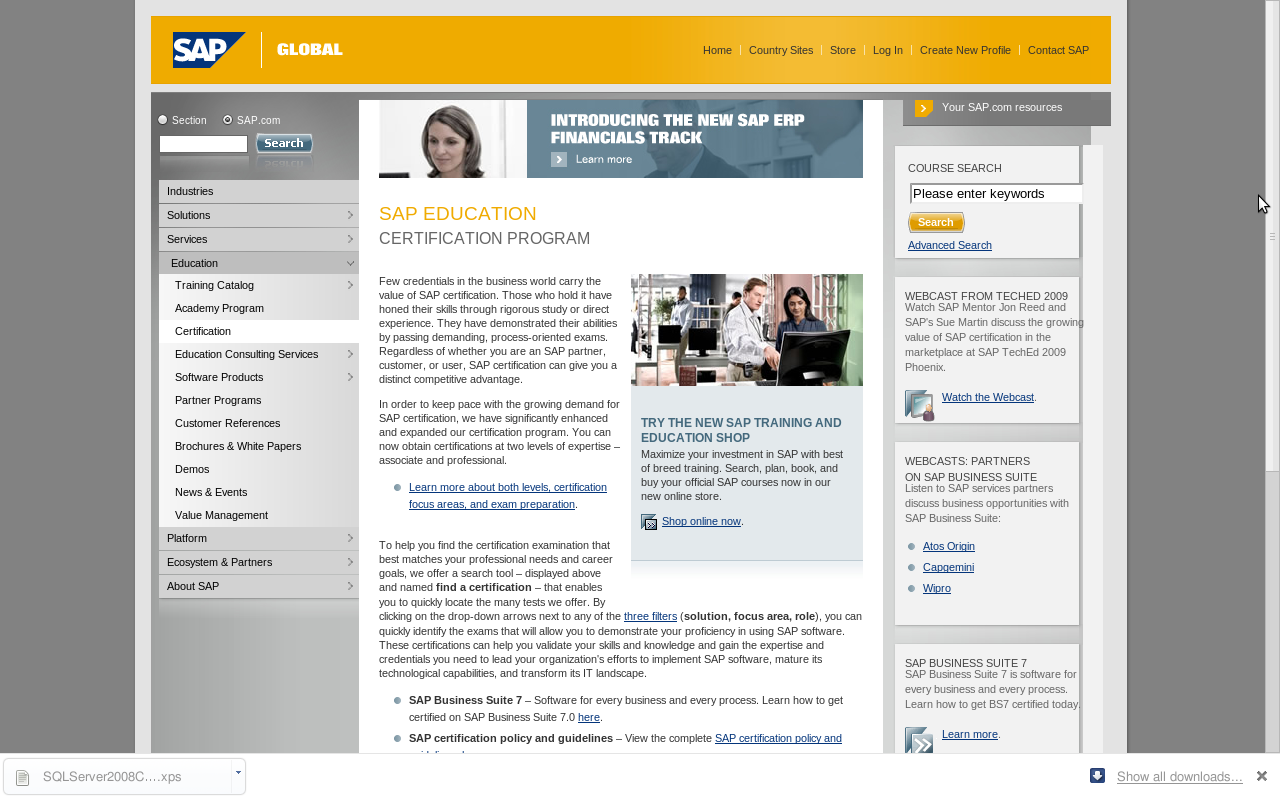
6) SAP Certifications

http://www.sap.com/services/education/certification/index.epx

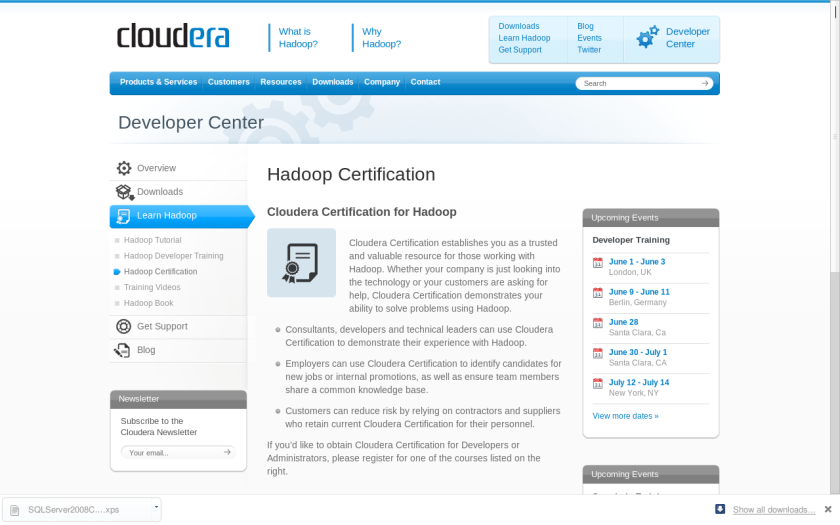
7) Cloudera’s Hadoop Certification

http://www.cloudera.com/developers/learn-hadoop/hadoop-certification/

These are some Business Intelligence and Business Analytics related certifications that I assembled in a list. Many other programs were either too software development specific or did not have a certification for general usage (like many R trainings or company tool specific trainings). Please feel free to add in any suggestions.

Data Mining through the Android

Here is something interesting (I probably have to ask someone or wait for Android to come to India to do this personally0.

It uses the Android App Development ( which is quite easy if you have a Linux) and basically runs R from the cloud using a GUI Rattle. Fire away the data while watching a movie or just on the go !

See this-

http://analyticdroid.togaware.com/

Question- How useful do you think it will be to do this?  Would you like to run R on your mobile?

Interesting R and BI Web Event

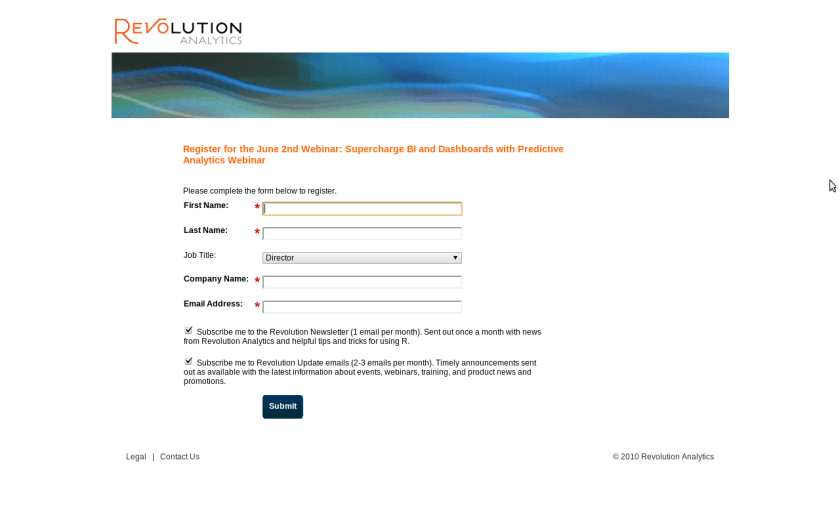
An interesting webinar from Revolution, the vanguard of corporate R things- mixing R analytics and BI Dashboards. Me thinks – an alliance with BI dashboard maker could also help the Revo guys as BI and Analytics are two similar yet different markets. Also could help if you are a newbie to BI  but know enough analytics/stats.

Click on the screenshot below if interested.

SUPERCHARGE BI AND DASHBOARDS WITH PREDICTIVE ANALYTICS

FREE WEBINAR WEDNESDAY, JUNE 2

Presenters:
David Smith, vice president of Marketing, Revolution Analytics
Steve Miller, president, OpenBI, LLC
Andrew Lampitt, senior director, Technology Alliances, Jaspersoft

Audience:
BI implementors seeking to integrate predictive analytics into BI dashboards;
R users and developers seeking to distribute advanced analytics to business users;
Business users seeking to improve their BI outcomes.

R Modeling with huge data

Here is a training course by BI Vendor, Netezza which uses R analytical capabilties. Its using R in the customized appliances of Netezza.

Source-

http://www.netezza.com/userconference/pce.html#rmftfic

R Modeling for TwinFin i-Class

Objective
Learn how to use TwinFin i-Class for scaling up the R language.

Description
In this class, you’ll learn how to use R to create models using huge data and how to create R algorithms that exploit our asymmetric massively parallel (AMPP®) architecture. Netezza has seamlessly integrated with R to offload the heavy lifting of the computational processing on TwinFin i-Class. This results in higher performance and increased scalability for R. Sign up for this class to learn how to take advantage of TwinFin i-Class for your R modeling. Topics include:

  1. R CRAN package installation on TwinFin i-Class
  2. Creating models using R on TwinFin i-Class
  3. Creating R algorithms for TwinFin i-Class

Format
Hands-on classroom lecture, lab exercises, tour

Audience
Knowledgeable R users – modelers, analytic developers, data miners

Course Length
0.5 day: 12pm-4pm Wednesday, June 23 OR 8am-12pm Thursday, June 24 OR 1pm-5pm Thursday, June 24, 2010

Delivery
Enzee Universe 2010, Boston, MA

Student Prerequisites

  • Working knowledge of R and parallel computing
  • Have analytic, compute-intensive challenges
  • Understanding of data mining and analytics