Wealth = function (numeracy, memory recall)

As per a recent paper by the National Bureau of Economic Research

It has been postulated that wealth is simply a function of your ability to handle numbers as well as recall memory.

That is – answering just three numerical questions for Retirement/ people with age above 50 years. This alone should serve as a wake up call for greater investment in Education (than just banks and corporations).

Citation- NBER

Cognition and Economic Outcomes

Household wealth is strongly associated with numeracy and memory recall.

In Cognition and Economic Outcomes in the Health and Retirement Survey, (NBER Working Paper No. 15266), co-authors John McArdle, James Smith, and Robert Willis show that the ability to answer three simple mathematical questions is a significant predictor of wealth, wealth growth, and wealth composition for people over 50 years of age.

Using data from the Health and Retirement Survey (HRS) — a nationally representative longitudinal survey for the United States, which combines comprehensive information on household wealth with “cognition variables” designed to measure memory, intactness of mental status, numerical reasoning, broad numeracy, and vocabulary — these authors find that household wealth is strongly associated with numeracy and memory recall.

To test memory recall, respondents listened to a list of ten simple nouns, answered other questions for five minutes, and then were asked to recall as many of the nouns as possible. Two-thirds of the HRS survey respondents were able to recall between three and seven of the words. Most respondents answered just one of the three numeric questions correctly.

Answering a numeric question correctly in the three-question sequence was associated with a $20,000 increase in total household wealth and about a $7,000 increase in total financial wealth. Wealth also tended to increase with a higher numeracy score for either spouse in a married couple—when neither spouse answered any numeric questions correctly, which was about 10 percent of the cases, household wealth was about $200,000. When both spouses answered all questions correctly, household wealth was about $1,700,000.

In households where one spouse, the financial respondent, was in charge of finances, household financial wealth was larger if the financial respondent had the higher numeracy score. Answering a question correctly was associated with a $30,000 increase in household wealth if the financial respondent answered correctly and only a $10,000 increase if the non-financial respondent answered correctly. Households with higher numeracy scores were also more likely to have higher fractions of their portfolios in stock.

In this sample, wealth was higher for couples than for single-person households, and lower for minorities than non-minorities. Wealth increased with age and family income, and rose steeply with education. In the HRS, median household wealth was $198,000, and 9 percent of that was held in stocks. Median total income was $37,000, and the typical sample member was a high school graduate.

The authors point out that their exploratory analysis has only established that specific cognitive measures are useful predictors of accumulated wealth and that they have not established causal pathways. It is possible, for example, that a lifetime interest in investments and the stock market can improve numerical ability. However, they note that the fact that numeracy seems to predict total and financial wealth at lower wealth quartiles where people are less likely to be active investors does seem to weigh against a purely reverse pathway from investments to cognitive ability.

— Linda Gorman

Speaking of Educational Programs I came across a good example on education in numeracy –

SAS Institute has been working in the field in the following  manner- directly as provider of SAS® Curriculum Pathways®

Fully funded by SAS and offered at no cost to US educators and students, SAS Curriculum Pathways is designed to enhance student achievement and teacher effectiveness by providing Web-based curriculum resources in all the core disciplines: English, math, science, social studies/history and Spanish, to educators and students in grades 8-14 in virtual schools, home schools, high schools and community colleges.

I believe other statistical softwares (like RE Computing, IBM SPSS , etc ) can also donate a small part of their product portfolio to K12 education (not just college education) as well. Education is an area where software companies especially in the field of statistics and analytics, co-operation and co-mpetition can co-exist to enhance the pool of potential developers , users and enhance life skills in numeracy as well .

Data Mining Survey Results :Tools and Offshoring

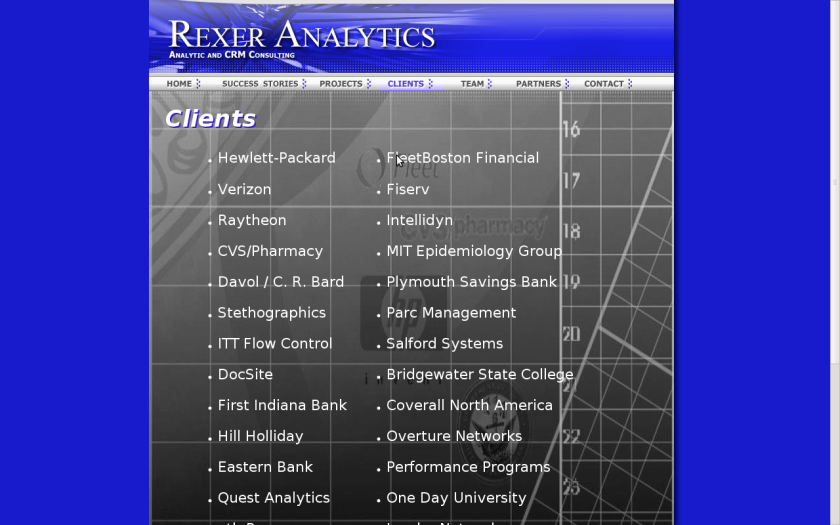
Here are some survey results from  Rexer Analytics

The Graphics seem self explanatory: terrific Data Visualization

1) The field of Data Mining seems ripe for either more offshoring to cut down costs or

there will be price pressures to cut costs on software ( read More R and SaaS) and Hardware ( more cloud /time sharing  ?)

2) Satisfaction with both R and SAS seems similar but R seems to score higher than other flavors.

3) An added dimension of  utility ( or say

(satisfaction in terms of analyst comfort + functionality in terms of business benefit) divided by (License + Training + Installation + Transition costs)

would have even extra analysis.

But these are not final results- for that you need to see Dr Karl at Rexer Analytics

Holiday Season Offer

Here is a great offer from the Predictive Analytics Conference. Basically a 15 % discount to visit PAWS in San Fransisco AND a chance to win a free pass as well.

pawsf10_bp_125

discount code for the SF 2010 show: AJAY010
It gives your readers a discount of 15% off a Two Day Conference Pass (workshops not included). For every three people who register using your code, we will give you a free pass to the conference
.

Since I basically need just one pass for the conference- if I cross more than 1 free pass, I will simply give it back to the people who registered using my blog. Simple.

However if this had been NFL tickets the offer may not be repeated again  🙂 ( note to myself- I need to get into predictive analytics  for sports using the data mining and analytics softwares I have been reading or find a company that has a predictive analytics for SPORTS vertical).

Google Web Intelligence (Beta)

Here is a screenshot from the kind of insights that can be created by the new Intelligence features in the free Google Analytics.

It can be used in websites as well as technical support websites to help create customer segments based on Behavior of visitors.


Avg. Time on Site

00:03:23 81%
expected: 00:01:23-00:01:59
Total Traffic Significance:
00:06:29 180%
expected: 00:01:59-00:02:48
Landing Page: /
36 Visits (15.3% of total)
Significance:

Bounce Rate

51.49% 29%
expected: 71.50%-73.53%
Total Traffic Significance:
49.69% 30%
expected: 67.03%-73.71%
Visitor Type: New Visitor
163 Visits (69.4% of total)
Significance:
53.23% 27%
expected: 68.88%-76.93%
Country/Territory: United States
124 Visits (52.8% of total)
Significance:
55.56% 26%
expected: 70.66%-79.68%
Visitor Type: Returning Visitor
72 Visits (30.6% of total)
Significance:

Pageviews

578 162%
expected: 199-221
Total Traffic Significance:
333 233%
expected: 95-108
Country/Territory: United States
124 Visits (52.8% of total)
Significance:
428 178%
expected: 136-170
Visitor Type: New Visitor
163 Visits (69.4% of total)
Significance:
213 168%
expected: 70-84
Medium: referral
93 Visits (39.6% of total)
Significance:
116 86%
expected: 61-87
Source: google
56 Visits (23.8% of total)
Significance:
150 122%
expected: 62-76
Visitor Type: Returning Visitor
72 Visits (30.6% of total)
Significance:

Visitors

201 74%
expected: 111-120
Total Traffic Significance:

Visits

235 97%
expected: 112-124
Total Traffic Significance:
124 112%
expected: 0-58
Country/Territory: United States
124 Visits (52.8% of total)
Significance:
75 115%
expected: 0-41
Source: (direct)
75 Visits (31.9% of total)
Significance:
163 95%
expected: 0-85
Visitor Type: New Visitor
163 Visits (69.4% of total)
Significance:
93 144%
expected: 0-41
Medium: referral
93 Visits (39.6% of total)
Significance:
72 76%
expected: 0-43
Visitor Type: Returning Visitor
72 Visits (30.6% of total)
Significance:
51 107%
expected: 0-25
Source: linkedin.com
51 Visits (21.7% of total)
Significance:
48 98%
expected: 0-26
Referral Path: linkedin.com/news
48 Visits (20.4% of total)
Significance:

New Version of R released: R 2.10.1

Note from  Denmark on the R _Project Build, ( currently Copen Hagen is seeing more excitement since Shakespeare mentioned it in Hamlet -thanks to the hot air in Global Warming Marathon)

Peter Dalgaard P.Dalgaard at biostat.ku.dk
Mon Dec 14 11:20:20 CET 2009


R-2.10.1.tar.gz was built a short while ago.

This is a maintenance release and fixes a number of mostly minor issues.

See the full list of changes below.

You can get it from

http://cran.r-project.org/src/base/R-2/R-2.10.1.tar.gz

or wait for it to be mirrored at a CRAN site nearer to you. Binaries
for various platforms will appear in due course.

        For the R Core Team

        Peter Dalgaard

SPSS Directions : Rexer Survey Results

Here are some results shared by Dr Karl Rexer of Rexer Analytics- they were presented at SPSS Directions. Clementine was #1 in customer satisfaction — everyone (N=78) who identified it as their primary tool were satisfied or very satisfied. It’s pretty amazing that not even one person was neutral (it was a 5-point scale).

For a detailed poster on the results contact http://www.RexerAnalytics.com More than 710 data mining professionals had completed the survey.

Here are some results shared by Dr Karl Rexer of Rexer Analytics- they were presented at SPSS Directions

When asked to select all of the software packages they use for data mining, each person selected an average of 5 tools.  More data miners reported using SPSS Statistics than any other tool.  And when we asked people to indicate their primary data mining tool, the tool selected by the most data miners was SPSS Modeler (Clementine).  The SPSS people were also thrilled to see that Clementine was #1 in customer satisfaction — everyone (N=78) who identified it as their primary tool were satisfied or very satisfied.  It’s pretty amazing that not even one person was neutral (it was a 5-point scale).

For a  detailed poster on the results contact www.RexerAnalytics.com More than 710 data mining professionals had completed the survey.

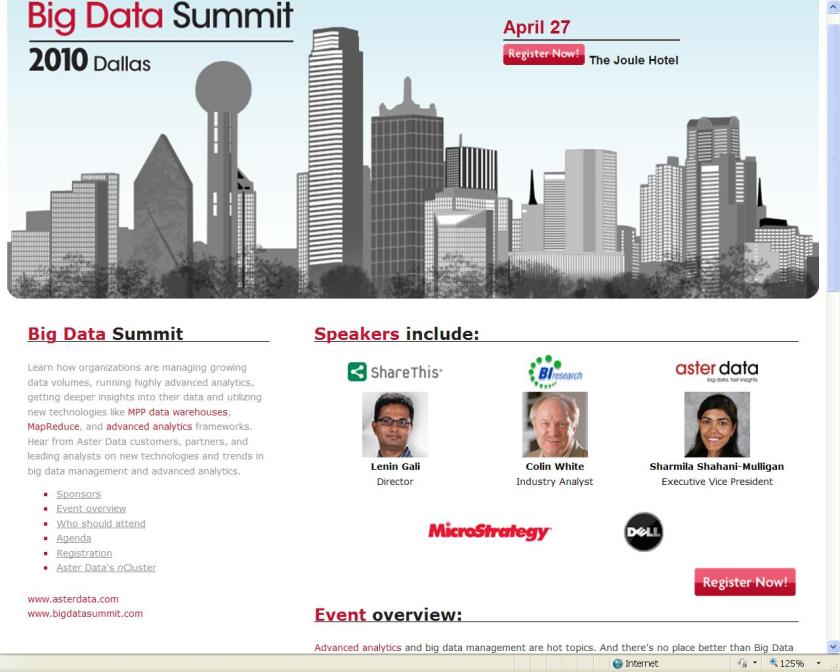
Time for the PAWS Conference

I just got an email from the great Dr Eric Siegel, one of my many mentors in this field of learning analytics and data. There are just three more days left for the Early Bird Price- so if you are doing your Media Planning Budget – it is a good time to register here. You can click on the screenshot itself to go to Registration Page.