Amazon drops prices of Linux AMIs by ~20%

Amazon cloud gets more exciting. We are still waiting for the Oracle and Google public clouds (compute) to open up out of beta! See their (rather cluttered) blog

http://aws.typepad.com/aws/2012/10/new-ec2-second-generation-standard-instances-and-price-reductions-1.html

Today, we are excited to announce a new generation of the original Amazon EC2 instance family. Second generation Standard instances (M3 instances) provide customers with the same balanced set of CPU and memory resources as first generation Standard instances (M1 instances) while providing customers with 50% more computational capability/core.

M3 instances are currently available in two instance types; extra-large (m3.xlarge) and double extra-large (m3.2xlarge). Examples of applications that can benefit from the additional CPU horsepower of these new instances include media encoding, batch processing, web servers, caching fleets, and many others. Currently, M3 instances are available in the US East (N. Virginia) Region starting at a Linux On-Demand price of $0.58/hr for extra-large instances. Customers can also purchase M3 instances as Reserved Instances or as Spot instances. We will introduce M3 instances in additional regions in the coming months.

To learn more about Amazon EC2 instance types and to find out which instance type might be useful for you, please visit the Amazon EC2 Instance type page.

Pricing Change for M1 Standard Instances
Along with the introduction of the M3 Standard instance family, we are announcing a reduction in Linux On-Demand pricing for M1 Standard instances in the US East (N. Virginia) and US West (Oregon) Regions by almost 19%. The new pricing is effective from November 1 and is described in the following table

Instance Type Previous Price New Price
m1.small $0.080 $0.065
m1.medium $0.160 $0.130
m1.large $0.320 $0.260
m1.xlarge $0.640 $0.520

You can find out more about pricing for all Amazon EC2 instances by visiting the Amazon EC2 pricing page.
 

Online Education- MongoDB and Oracle R Enterprise

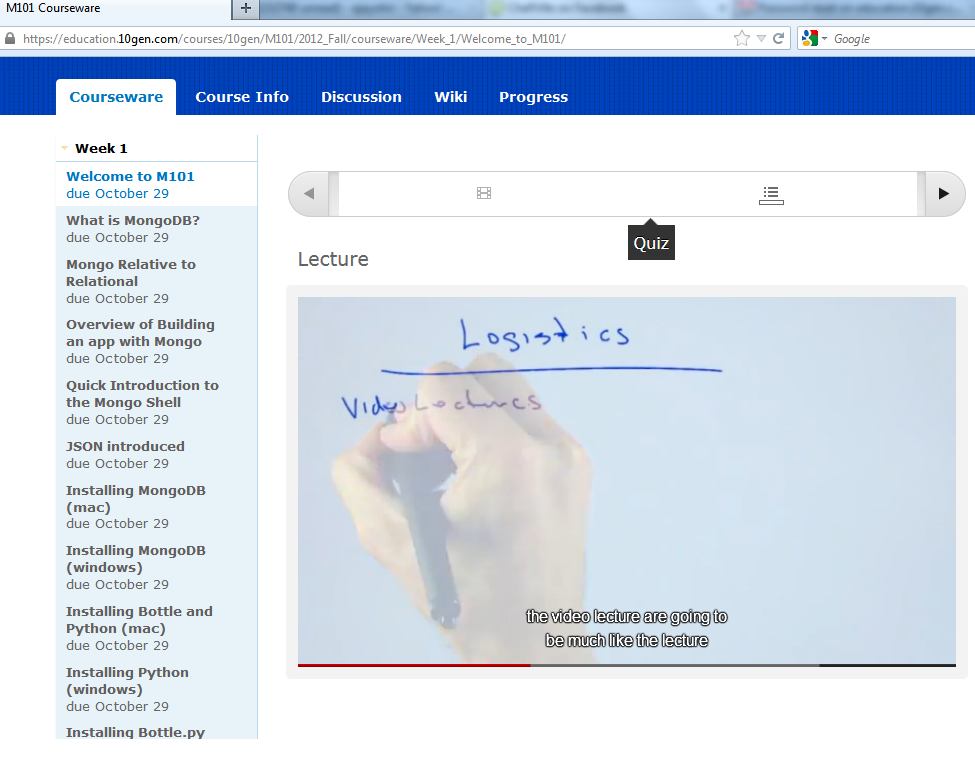
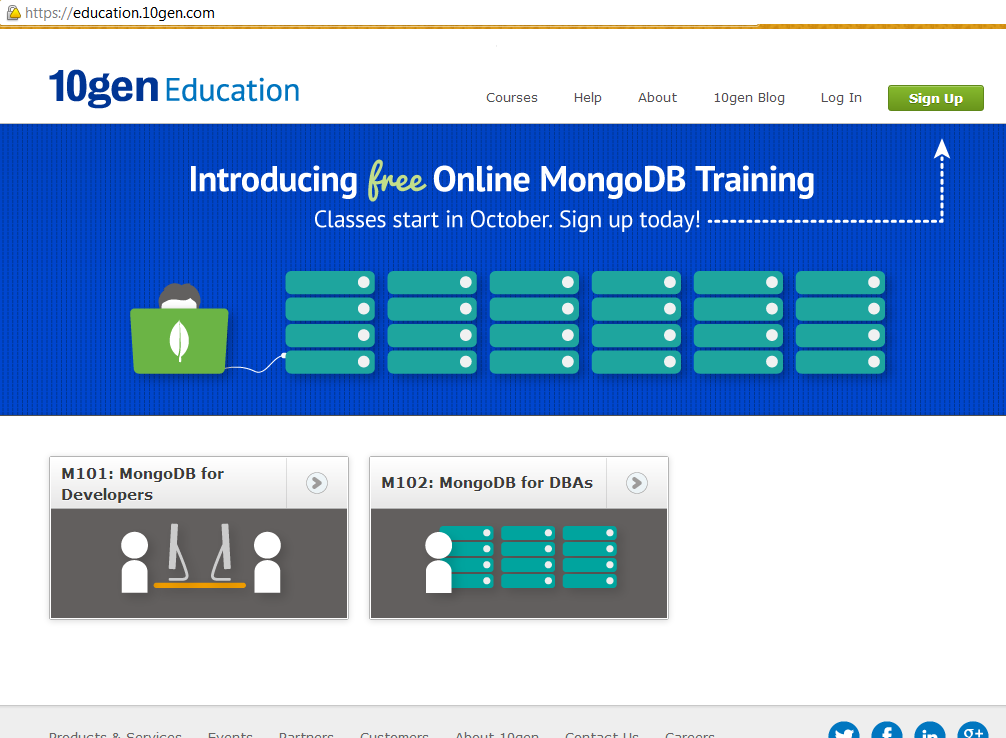
I really liked the course developed by 10 gen for MongoDB (there are two tracks for Developers and DBAs at https://education.10gen.com/)

The interface is very nice and is a step upwards from Coursera’s ( https://www.coursera.org/) pioneering work (and even http://www.codecademy.com/#!/exercises/0 )– each video has a small question, the videos are not cluttered, and the voice and transcription quality is impeccable. Lastly a certification for people who clear 65% acts as an academic incentive, they get a certificate.

yes it is free.


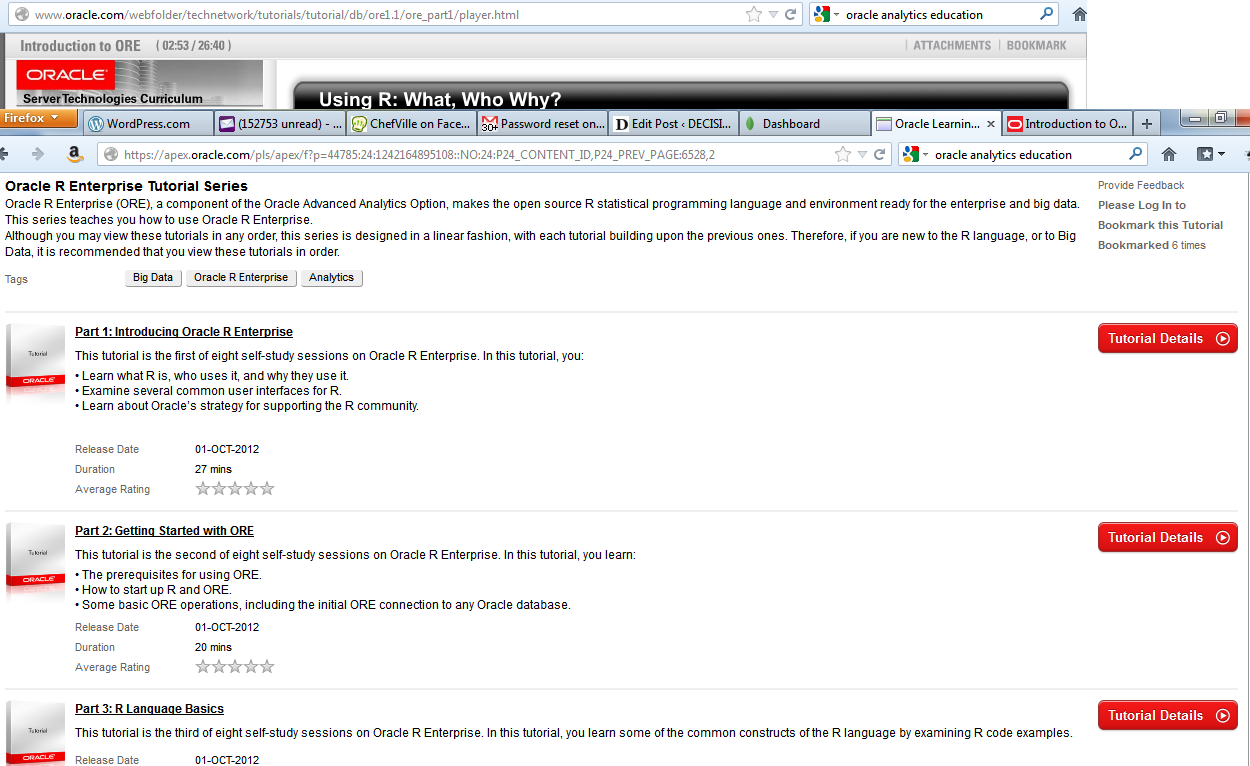
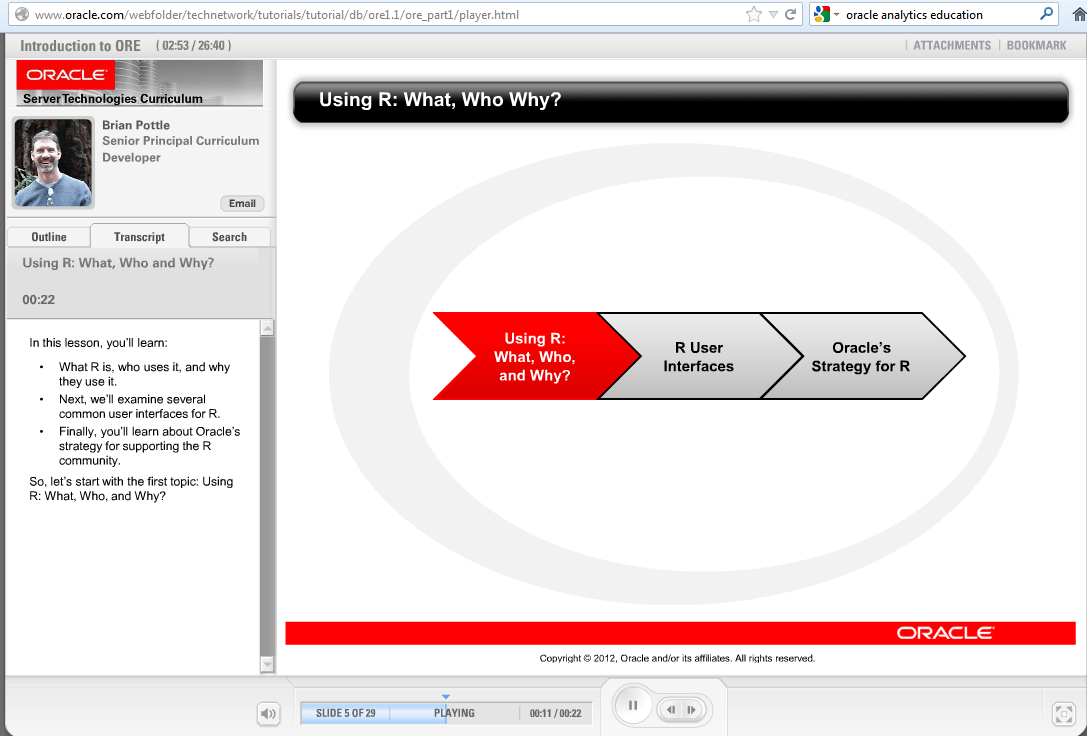
Oracle recently launched a series of nicely made R tutorials at https://apex.oracle.com/pls/apex/f?p=44785:24:0::NO::P24_CONTENT_ID,P24_PREV_PAGE:6528,1but I wish Oracle R had some certifications too!

If only more techie companies like SAS Institute (expensive SAS training), IBM (cluttered website), Revolution Analytics (expensive partners in Certification), Google (unpolished Python lectures)

put an effort with polished e-learning interfaces than be dependent on external partners…..or internal gurus…interfaces matter especially in education.

\Well Anyways!!

Happy Mongo DBing/ Oracle R!


Running R on Windows Azure #rstats #cloud

Here is a brief tutorial for people to run R on Windows Azure Cloud (OS=Windows in this case , but there are 4 kinds of Linux also available)

There is a free 90 day trial so you can run R for free on the cloud for free (since Google Cloud Compute is still in closed hush hush beta)

Go to https://www.windowsazure.com/en-us/pricing/free-trial/

WordPress.com Analytics

The Analytics (or stats) dashboard at WordPress.com continues to disappoint, and is a major reason for people to move out of WordPress.com hosting (since they need better analytics like that by Google Analytics which cant be enabled on the default mode)

Its not really beautiful unlike the rest of WordPress Universe!

It can be made better if people try harder! Analytics matters

Here are some points

1) Bar charts and Histograms are not really the best way to visualize trends across time

2) Location Analytics is limited to just country level analysis and the heatmap (?) is aweful in terms of distinguishing gradients 

3) Referrers Tab needs to do a better job on distinguishing between mobile and non mobile traffic, social and non social traffic (and there are better ways to visualize than just a simple list)!

4)  I cant even export my traffic stats (and forget an api !) so I am stuck with the bad data viz here

Scribd Analytics

I really liked Scribd Analytics feature (and that we have racked up 3200 reads in 11 months for Poets and Hackers). I think Google Docs /Drive should really incorporate more Scribd like document sharing features including social (now that Slideshare is off the market for a relatively cheap $119m) and turn on analytics by default

I really liked the heatmap on the document feature in the second screenshot.

Anyways nice to see someone out there cares for Poets &….


Different kinds of Clouds

Some slides I liked on cloud computing infrastructure as offered by Amazon, IBM, Google , Windows and Oracle