Misconceptions and Fallacies in Analytics Education in India

  1.  Teaching a software and labeling it as analytics education- Some examples are Teaching Analytics with MS Excel (a spreadsheet software) , or Teaching a Statistics or Optimization syllabus and tagging it as Business Analytics.
  2. Promise to teach language X but use cheaper software Y– Examples can be offering to teach SPSS language but using the open source equivalent PSPP
  3. Overcharge for a day or two’s workshop- Albert Einstein could not learn a computer language in 3 days he could just get the basics. Anything priced above 500 $ and less than 4 days training is a simple effort to fool you you are getting your much more than your money’s worth.
  4. Extend training to more than 2 months and then overcharge– This is a failure unless done by an accredited college
  5. Freebies– There is no free lunch. Overcharging and giving a discount is a standard marketing malpractice.
  6. Brand Associations– Brand X is well known but has no credentials in Analytics. So it ties up with a couple of analytics consultants and launches a certificate or certification or diploma program in analytics. Unfortunately this extends to the very very best of Indian education.
  7. Hidden costs also known as We are cheap because we are in India-  Analytics software costs almost the same through out the world ( I did propose a PPP method for pricing software differently). Anyone offering discount because of geography is selling you a bridge in Nigeria or a million dollars in Iraq.
  8. Self Paced Learning-Learn Online for Fee- or Free- No, learning needs interaction and instructors- otherwise all universities in the worlds would have moved the professors to research (?) and offered videos to the students for self learning
  9. Better Much Better Support- Some analytics providers aim to distinguish themselves by saying we give better support. Yet their support team is hidden and mostly the instructor giving support. The best solution is to publish members of support team names as is done in support services industry.

These are personal observations and may or may not be true to every organization. All opinions are mine only.

Top 7 Business Strategy Models

UPDATED POST- Some Models I use for Business Strategy- to analyze the huge reams of qualitative and uncertain data that business generates. I have added a bonus the Business canvas Model (number 2)

  1. Porters 5 forces Model-To analyze industries
  2. Business Canvas
  3. BCG Matrix- To analyze Product Portfolios
  4. Porters Diamond Model- To analyze locations
  5. McKinsey 7 S Model-To analyze teams
  6. Gernier Theory- To analyze growth of organization
  7. Herzberg Hygiene Theory- To analyze soft aspects of individuals
  8. Marketing Mix Model- To analyze marketing mix.

Continue reading “Top 7 Business Strategy Models”

Readings Lots of CSV Files in #Rstats

Assign Names to Objects Based on Names of Files in a Directory using R for a large number of input csv files

getwd()

setwd(“C:/Users/KUs/Desktop/delhi crimes”)

a=dir()

for(i in 1:length(a)){

assign(paste(a[i]),(read.csv(a[i],header=T,sep=“,”)))

}

ls()

#Rstats continues its march in data mining

From the famous KARL REXER ANNUAL DATA MINING SURVEY

HIGHLIGHTS from the 2013 Data Miner Survey:
  • SURVEY & PARTICIPANTS:  68-item survey conducted online in 2013.  Participants: 1,259 analytic professionals from 75 countries.  This is the 6th Data Miner Survey.
  • FOCUS ON CRM:  In the past few years, there has been an increase among data miners in the already substantial area of customer-focused analytics.  Respondents are looking for a better understanding of customers and seeking to improve the customer experience.  This can be seen in their goals, analyses, big data endeavors, and in the focus of their text mining.
  • BIG DATA:  Many in the field are talking about the phenomena of Big Data.  There are clearly some areas in which the volume and sources of data have grown.  However it is unclear how much Big Data has impacted the typical data miner.  While data miners believe that the size of their datasets have increased over the past year, data from previous surveys indicate that the size of datasets have been fairly consistent over time.
  • THE ASCENDANCE OF R:  The proportion of data miners using R is rapidly growing, and since 2010, R has been the most-used data mining tool.  While R is frequently used along with other tools, an increasing number of data miners also select R as their primary tool.
  • CHALLENGES IN THE USE OF ANALYTICS:  Data miners continue to report challenges at each level of the analytic process.  Companies often are not using analytics to their fullest and have continuing issues in the areas of deployment and performance measurement.
  • ENGAGEMENT & JOB SATISFACTION:  The Data Miners in our survey are highly engaged with the analytic community: consuming and producing content, entering competitions and searching for education and growth within their jobs.  All of these activities lead to high job satisfaction, which has been increasing over time.
  • ANALYTIC SOFTWARE:  Data miners are a diverse group who are looking for different things from their data mining tools.  Ease-of-use and cost are two distinguishing dimensions.  Software packages vary in their strengths and features.  STATISTICA, KNIME, SAS JMP and IBM SPSS Modeler all receive high satisfaction ratings.
  • OTHER FINDINGS include the labels analytic professionals use to describe themselves (Data Scientist is #1), the algorithms being used (regression, decision trees, and cluster analysis continue to be the triad of core algorithms), and computing environments (cloud computing is increasing).

Teaching R in India #rstats $323 for 6 week course

I submitted a poster to User2013 that was accepted on Teaching R in India- but I could not attend since I was in Canada visiting family at that time

These were some of the experiences I wanted to talk about- but I think I will elaborate on them later

Anyways- I have been able to design a SECOND R course in Bangalore for Edureka-
What happened to the FIRST course I designed in India. Enough said!

But Edureka were different and they work mostly with open source like teaching Hadoop, Android, Cassandra and R- and they are truly world class in their ways (except video editing and websites and social media blogs )
Edureka has worked much more honestly with both students and instructors. I was also able to convince them of the value of limited open access by giving some slides and videos free .
here is the slides for the first class.

The landing page is at
By pricing a 6 week, 24 hour course using Go2Meeting at just $323 ———-
edr
What we are trying to do is disrupt the market for training in two ways-
1) Give better customization and instructor attention than the MOOCs
2) Avoid  obscenely expensive workshops priced above 900$ per 8 hours etc…. from corporates.
The youtube video has got almost 6338 views and the model works best for developing countries like India for spreading R (though we do have an occasional overseas student ). We are currently updating the quality of the video even more as we collect automated response at end of each 2 hour class.
 All slides  and all videos are made free to download forever to the student.
 Got 323$  to learn R in six weeks? Sign up here  http://www.edureka.in/r-for-analytics

New Delhi R Users Group- Noida Chapter Begins

I founded the New Delhi R Users group almost a year ago. It now has 183 members, and we recently held our first Noida Chapter meeting ( Delhi is a huge area, with Noida and Gurgaon as two adjoining suburban hubs). The response was terrific many people attended. ndr

The sessions were divided in two- for beginners and advanced users

This was the agenda

We invite you on the R learning session at Apsidata Solutions on 7th Dec 2013 from 2:30PM-5:00PM.

Our purpose is to cover up the basics of R and its current market and business scope.

We have divided the session in 2 parts-

(PART – I) Introduction and basics graphs of R (by Su  from 2:30PM – 3:30PM)

CAM00187

·         Basic Introduction

·         Introduction of Statistical Analysis

·         Installation of R

·         What is Package and how to install and use it.

·         R-commander

·         Importing Data in R

·         Hands-on inbuilt functions

·         Graphs

Half an hour break for discussion and queries (from 3:30PM -4:00PM)

(PART – II) – What’s new in R and its market (by Ajay Ohri from 4:00PM – 5:00PM)

CAM00186

·         Rattle-Data mining

·         R-Studio Sever

·         R-Fiddle

·         Statace


First part for beginners was taken by Su, my student from Edureka 

These were the slides

Part 1

Part 2


Overall, we trying hard to develop the R ecosystem in a Microsoft ruled country 🙂

Interview Dr. Jonathan Cornelissen, CEO Datamind #rstats

Here is an interview  with Dr Jonathan  Cornelissen, CEO of Datamind which also makes RDocumentation, and R-fiddle. I have written on them before here and here   jonathan

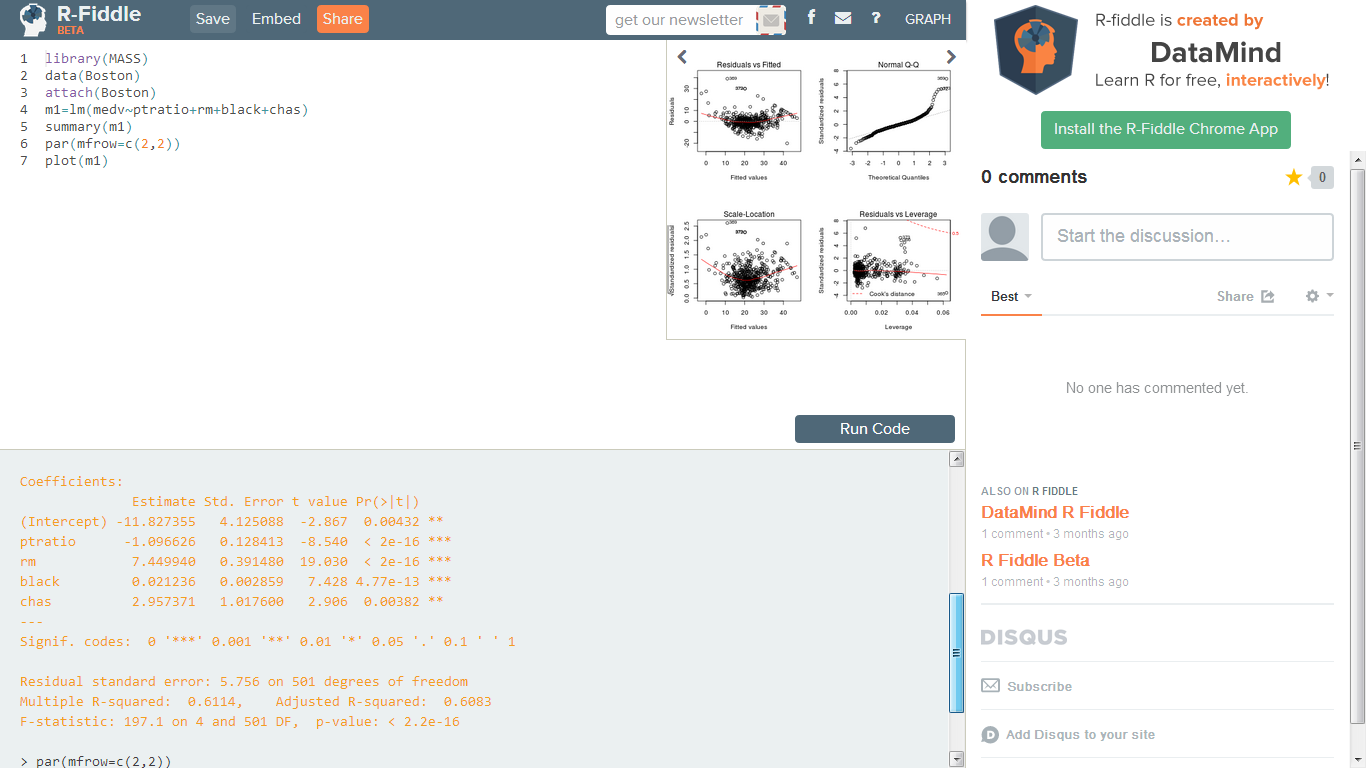
Ajay- Congrats for making on the first page of hacker news with R-Fiddle .What were your motivations for making http://www.r-fiddle.org/.

Jonathan- Thank you. I must admit it was very exciting to be mentioned on Hacker News, since a lot of people were exposed to the R-fiddle project immediately. In addition, it was a first good test on how our servers would perform!

The motivation for building R-fiddle was simple; our CTO Dieter frequently uses the popular sitehttp://jsfiddle.net/ to prototype webpages, and to share his coding ideas with us. We were looking for something similar for R but it turned out a website allowing you to quickly write, run and share R-code right inside your browser didn’t exist yet. Since we were convinced a fiddle like tool for R would be  useful, we just started building it. Based on the positive reactions and the fast adoption of R-fiddle, I think we were right. That being said, this is a first version of R-fiddle, and we’ll definitely improve it over the coming months. Check out our blog for updates. (http://blog.datamind.org/)

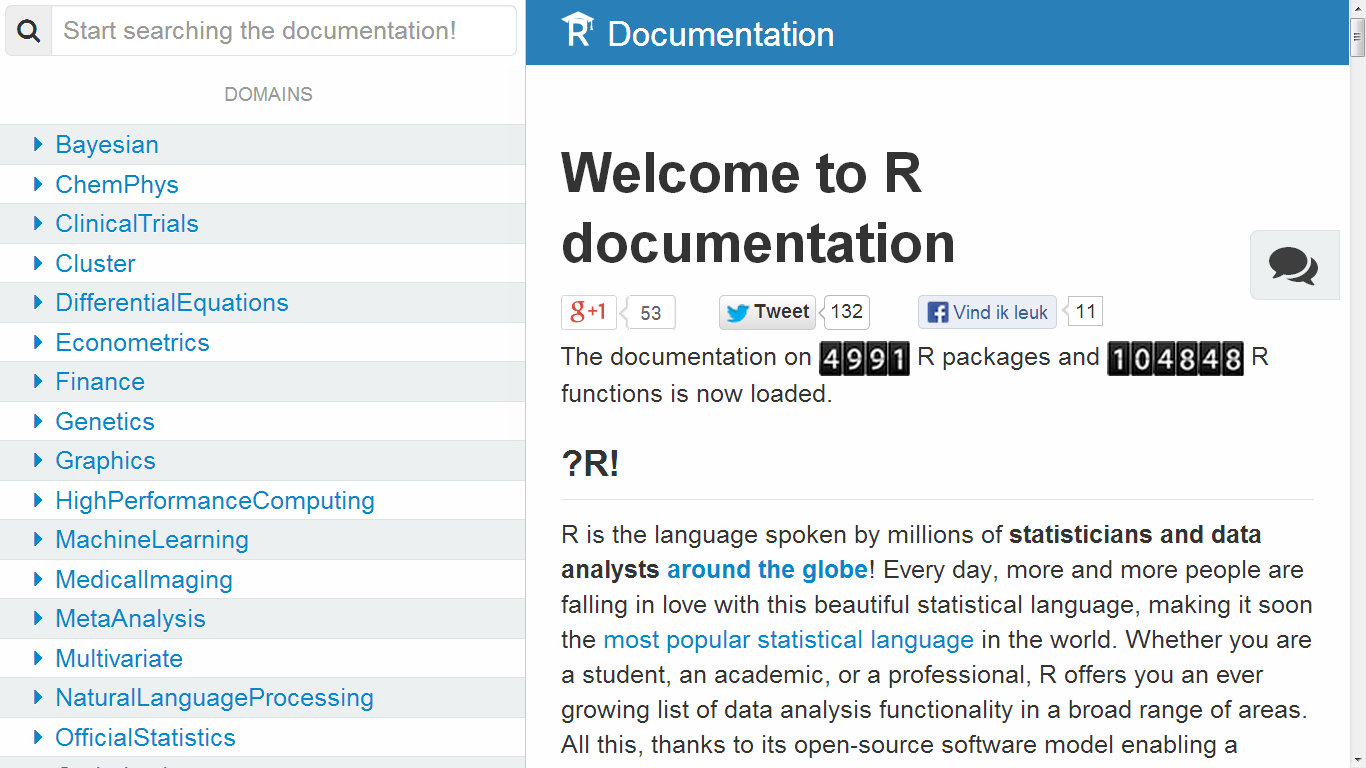
Ajay- Why did you make http://www.rdocumentation.org/ given that there is so much #Rstats documentation all around the internet including http://www.inside-r.org/ 

Jonathan- When we started working on the www.datamind.org platform, we did an online survey to find out whether there would be interest in an interactive learning platform for R and statistics. Although the survey was not on this topic, one of the most striking findings was that a large percentage of R users apparently is frustrated about the documentation of R and its packages. This is interesting since it not only frustrates current users, but it also increases the barrier to entry for new R users and hence puts a brake on the growth and adoption of R as a language. It is mainly for the latter reason we started building Rdocumentation. The whole focus is on usability and letting all users contribute to make the documentation stronger. By the end of next week, we’ll launch a new version of Rdocumentation, that introduces advanced search functionality for all R functions, shows the popularity of R packages and much more. So make sure to www.Rdocumentation.org for updates!

Ajay- What have been your responses to http://www.datamind.org/#/ . Any potential content creation partners or even corporate partners like statistics.com, Revolution , RStudio, Mango etc

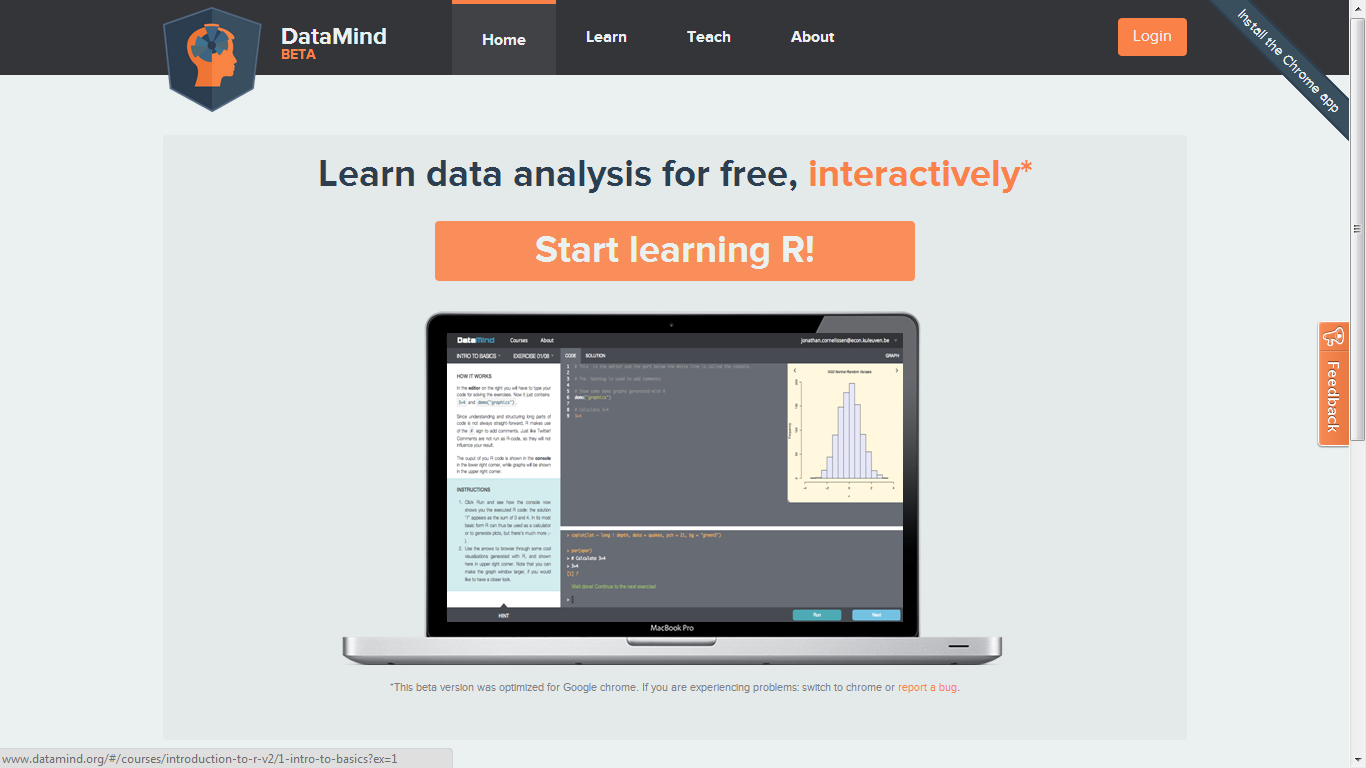
Jonathan- The response to the beta version of DataMind has been great, thousands of learners signed up and took the demo course. We are talking to some of the leading companies in the space and some very well-known professors to develop courses together. It is too soon to disclose details, but we will put regular updates on www.datamind.org! Corporates interested in what we do should definitely get in contact with Martijn@datamind.org.

Ajay- Would it be accurate to call http://www.r-fiddle.org/#/  a browser based GUI for R on the cloud . What enhancements can be we expect in the future?

Jonathan- R-fiddle is indeed a browser based GUI for R on the cloud. We have a lot of ideas to improve and extend it. Some of the ideas are: the ability for users to concurrently make changes to a fiddle (Google-docs-style), support for loading data sets, github integration, better security management, lists of popular fiddles or fiddles from popular people, etc. However, the strong point about R-fiddle is that it is really simple and there is absolutely no friction to start using it. In that respect, we want to differentiate R-fiddle from more advanced solutions such as StatAce or Rstudio Server, which focus on more advanced R users or R usage. rf1

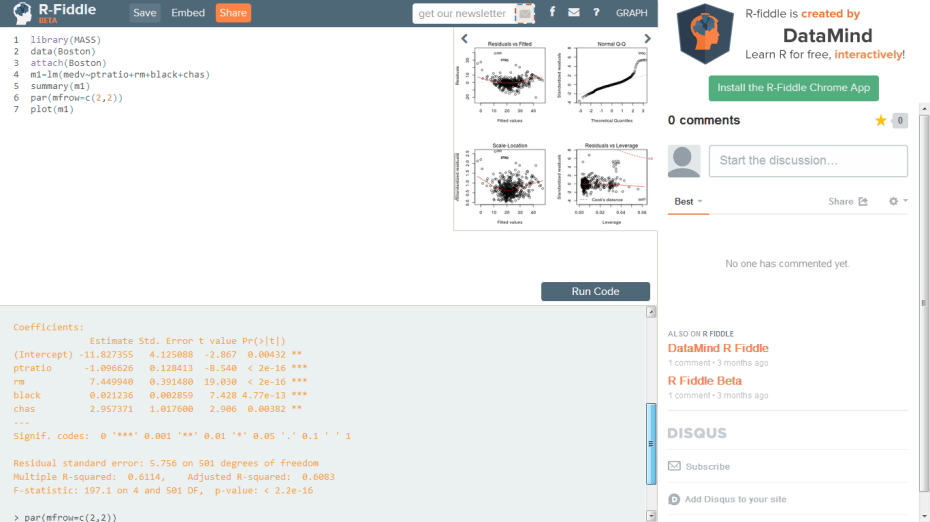
Ajay- You described your architecture for datamind.org  at http://blog.datamind.org/ which is very open and transparent of you.  What is the architecture for http://www.r-fiddle.org/#/ and what is it based out of?

Jonathan- That’s an easy one. Although some details differ obviously, from a high-level perspectiveDataMind.org and R-fiddle.org have exactly the same IT architecture.

Ajay-  http://www.datamind.org/#/dashboard describes course creation . How many courses are in the pipeline and how many users and corporate training clients do you foresee in the next 12 months

Jonathan- Since  we launched DataMind, we were inundated by requests from teachers and industry experts eager to contribute their own coursework on the site. But up until last week, it was only possible to take courses instead of creating them yourself. We decided to change this since we do not want to be solely a content company, but also a platform for others to create courses. 1

Furthermore, by expanding DataMind with a content creation tool, we go beyond our naturally limited in-house ability to create courses. Now DataMind is ready to become a full on ecosystem to facilitate education between our users.

Ajay- Are you self funded- any funding constraints based on being based in Europe?

Jonathan- We are a Belgian company, founded in November of this 2013 by Dieter De Mesmaeker, Martijn Theuwissen and myself. However, the DataMind team travelled to Santagio (Chile) last week to participate in the Start-up Chile incubator for the next 6 months (which offers $40k in equity-free funding and mentoring). Here in Santiago, a fourth team member Bram Jans joined us. Furthermore, we have raised $135k seed capital from the iMinds incubator in Belgium to market and further develop the technology. Next summer, we’d like to raise more capital to be able to execute faster on our strategy towards monetization. Tech savvy investors with an interest/network in the statistics and data science area, or in online education, can always send a mail to Jonathan@datamind.org to discuss potential collaboration.

Ajay- What do you think of R in the cloud for teaching ( http://blog.datamind.org/2013/07/23/how-to-run-r-in-the-cloud-for-teaching/

Jonathan- We are convinced that cloud solutions are the future of teaching and learning in general. The main problem with the first wave of online education solutions (such as Coursera, EdX, Udacity, etc.) is that they “only” make a copy of the classroom online instead of leveraging technology to create a more engaging and efficient learning experience and interface. Therefore, I don’t think the future is in generic learning solutions. Learning interfaces will differ from domain to domain. Good examples are:Duolingo.com to learn languages, or Codeschool.com to learn web development. We are on a mission to build the best learning solutions for statistics and data science.

Ajay- What are some of the other ways we can help make R more popular on the cloud?

Jonathan- I really like the vision behind StatAce.com, and I think something like it will definitely increase further adoption of R. It is somewhat surprising that Rstudio is not offering something like that, but my assumption is they are working on it. That being said, what would be really cool is a very easy-to-use graphical user interface with R under the hood. Whether you like it or not, R has quite a steep learning curve for most people, and allowing them to analyze data with R through a graphical user interface on the web as a first step, could start the adoption of R in less technical areas.

Ajay-  Any plans to make R (CRAN or Github) packages to help  with these solutions?

Jonathan-  We’ll put a first version of the very simple Rdocumentation R package on CRAN soon. This would allow people to integrate Rdocumentation in their standard R work-flow (See an early draft version on Github: https://github.com/jonathancornelissen/Rdocumentation_package)

rdoc1

For DataMind, we are working on an R package as well to make the creation of interactive courses easier: https://github.com/jonathancornelissen/datamind. A part of this R package is actually just a wrapper around the great Slidify package (http://slidify.org/).


Ajay- Describe your work life balance at a tech startup?

Jonathan- Hmm, work life balance J? 

About-

You can also connect with Dr Jonathan here http://www.linkedin.com/pub/jonathan-cornelissen/4/22/426

rfiddle_smalldatamind_small (1)
rdocs_small

(Standard Blogger Disclosure- they also support Decisionstats.com in case you didnt notice the banner ad)