Garbage In Garbage Out

Many people are like garbage trucks. They run around full of garbage, full of frustration, full of anger, and full of disappointment. As their garbage piles up, they need a place to dump it and sometimes they’ll dump it on you. NEVER take it personally. Just smile, wave, wish them well, and move on with the routine life.” Don’t take their garbage and spread it to other people at work, at home or on the streets.

Hat Tip – http://www.linkedin.com/pub/badri-s-evergreen-thoughts/51/461/209

Data Science Hype Bubble

k-bigpic

  1. People selling business analytics software claim business analytics will solve everything for your business (including world peace and hunger if the govt chooses)
  2. People selling business analytics training claim there is a big shortage of analysts/data scientists and getting those skills will give you job and eternal bliss ( but in obtuse language to prevent lawsuits)
  3. People selling consulting services claim software (see 1) is incredibly difficult to customize without their help
  4. Everyone is charging money which is expensive without any transparency on why it is priced so. What are your costs etc?
  5. Everyone has a few shiny testimonials on their website. This is very confusing. How can everyone be equally good.
  6. The credit rating agencies of Data science world are as corrupted and prone to influence as the credit rating agencies of the financial world (Enough said, Gideon!)
  7. Pricing in data science solutions, products and services is like this- my website is better than that competitor website /blog so if he charges X let me charge X +dx
  8. Even companies that began with grand visions of revolution and changing the world slowly upped their price  of both software and training
  9. White papers in data science is a declining but still robust industry. The latest thing in data science- SLICK BLOGS by smart looking people
  10. No one bothers to explain total cost of ownership or total return on investment on data science and analytics. Very surprising, since every one is a quantitative expert and these two metrics should bother the dear beloved end customer the most
  11. I have seen some hype bubbles ( yes I am 36 years old) Business Intelligence- Business Analytics- Data Science- Big Data… What is the next big buzzword
  12. Everyone is selling webinars for free. There is no free lunch. Why are there free webinars.
  13. How I can go from unpaid blogger to paid webinar guru— test my hypothesis (thinks a lot of people everyday)
  14. Somewhere in a West Coast college dormitory or an Eastern Eurpean garage, some geeks are plotting the next data revolution. You have been warned.
  15. How many bums must one guy kiss to get invited to conferences
  16. In the age of skype, and video conferencing- why do you need a conference. oH right- thats another side industry too.
  17. The more billions a software company makes in analytics, the more haters it gets!
  18. 123,000 bloggers think they can run Google better than Eric Schmidt. Includes two.

ps- Sarcasm was totally unintentional. Direct all malevolence here http://plus.google.com/+AjayOhri

50 functions to clear a basic interview for Business Analytics #rstats

Due respect to all cheat sheets and ref cards, but these are the functions that I use in a sequence to analyze a business data set. interview

  • Packages
  1. install.packages(“Hmisc”)  installs package Hmisc
  2. library(Hmisc) –loads package Hmisc
  3. update.packages() Updates all packages
  • Data Input
  1. getwd() – Gets you the current working directory
  2. setwd(“C:/Path”) -Sets the working directory to the new path , here C:/Path
  3. dir() – Lists all the files present in the current working directory
  4. a=read.csv(“1.csv”,header=T,sep=”,”,stringsAsFactors=T)

here

a= read.csv (assigns the object name a to whatever comes to the right side)

You can also explicitly assign a character name to a data object using assign)

read.csv is a type of input command derived from read.table to read in a rectangular object (rows and columns)

header specifies whether the first line has variable names or not

sep denotes seperator (generally a comma for CSV files but can be space or tab for text files)

stringsAsFactors=T reads in strings as character values and not factor levels

  • Object Inspection
  1. str(a) Gives the structure of object named  including class, dimensions, type of variables , names of variables and a few values of variables as well. Only drawback is can throw up a lot of information for a big data set
  2. names(a) Gives the names of variables of the object
  3. class(a) Gives the class of a object like data.frame, list,matrix, vector etc
  4. dim(a) Gives the dimension of object (rows column)
  5. nrow(a) Gives the number of rows of object a- useful when used as an input for another function
  6. ncol(a) Gives the number of columns of object a
  7. length(a) Gives the length of object- useful for vectors, for a data frame it is the same as ncol
  8. a[i,j] Gives the value in ith row and jth column
  9. a$var1 Gives the variable named var1 in object a . This can be treated as a seperate object on it’s own for inspection or analysis
  • Data Inspection
  1. head(a,10) gives the first ten rows of object a
  2. tail(a,20) gives the last twenty rows of object a
  3. b=ajay[sample(nrow(ajay),replace=F,size=0.05*nrow(ajay)),] 

Lets get a 5 % random sample of the object ajay

[] uses the subset to give value in the specified row

Sample is the command for sample

So out nrow(ajay) or total number to be sampled of ,size= Size of sample it is taking 5% numbers, and these are the row numbers that are being returned. replace =F means each number is selected only once

  • Math Functions

Basic-

  1. sum  -sum
  2. sqrt -square root
  3. sd  -standard deviation
  4. log –log
  5. mean -mean
  6. median– median

Additional

  1. cumsum – Cumulative Sum for a column
  2. diff –Differencing
  3. lag – Lag
  • Data Manipulation
  1. paste(a$Var) converts Var from Factor/Numeric variable to Charachter Variable
  2. as.numeric(a$Var2) Converts a character variable into a numeric variable
  3. is.na(a) retruns TRUE wheneve it encounters a Missing Value within the object
  4. na.omit(a) Deletes all missing values (denoted by NA within R)
  5. na.rm=T (this option enables you to calculate values Ignoring Missing Values)
  6. nchar(abc) gives the values of characters in a character value
  7. substr(“ajay”,1,3) gives the sub string from starting place 1 to ending place 3. Note in R index starts from 1 for first object
  • Date Manipulation  

library(lubridate)
> a=”20Mar1987″
> dmy(a)
[1] “1987-03-20 UTC”
> b=”20/7/89″
> dmy(b)
[1] “1989-07-20 UTC”
> c=”October 12 93″
> mdy(c)
[1] “1993-10-12 UTC”

  • Data Analysis
  1. summary(a) Gives summary of object including min,max,median,mean, 1st quartile, 3rd Quartile) for numeric objects and frequency analysis of Factor variables
  2. table(a) Gives Frequency Analysis of variable or obejct
  3. table(a$var1,a$var2) Gives cross tabs of Var1 with respect to Var 2 of object a

library(Hmisc) loads HMisc which enables use to use describe and summarize function

  1. describe(a$var1) gives a much more elaborate and concise summary of the variable Var 1- it’s a better version of summary
  2. summarize(a$var1,a$var2,FUN)  applies a function (like sum, median, summary or mean) on Var 1 , as GROUPED by Var2
  3. cor(a) gives corelation between all numeric variables of a
  • Data Visualization
  1. plot(a$var1,a$var2) Plots Var 1 with  Var 2
  2. boxplot(a) boxplot
  3. hist(a$Var1) Histogram
  4. plot(density(a$Var1) Density Plot
  5. pie (pie chart)

Modeling

  1. a=lm(y~x) creates model
  2. vif(a) gives Variance Inflation  (library(car) may help)
  3. outlierTest(a) gives Outliers

summary(a) gives model summary including parameter estimates

  • Write Output
  1. write.csv(a) Write output as a csv file
  2. png(“graph.png”) Write plot as png file
  3. q() –Quits R Session

——————————————————————————————————————————————————-

R is a huge language with 5000 packages and hundreds of thousands of functions.

But if you memorize these functions ~50, I assure you will make a much more positive impression in your business analytics interview !

Bonus-

Sys.time() and Sys.Date() gives current   time and date (note the change in case)
while system.time(experession gives time taken to evaluate an expression)

Citation- http://www.ats.ucla.edu/stat/r/faq/timing_code.htm

Also

yo=function(a,b){ a*b*12} creates a custom function called yo which can be then invoked as yo(2,3)

Coming up-

the apply family, the Hadley collective  and GUIs  for the second round of interview ;)

The Amazing R-Fiddle truly brings #rstats to the browser

Datamind.com whom I interact with on and off, and also the masterminds behind http://www.rdocumentation.org/

have finally created their platform for interactive and gamified R learning on the web. Take a look- it does like slightly better than Codeacademy’s interface doesnt it. The platform is called http://www.r-fiddle.org/#/

More power to R for Cloud Computing!

Screenshot from 2013-11-21 21:37:25

Now if they could only collobrate with other players like Quandl, BigML and even StatAce for a even cooler suggestion. Even Revolution Analytics and RStudio who have very expensive training modules should be able to use this for self paced online learning courses!


Quote- A software of beauty is a joy forever – Keats

RapidMiner 6.0 launched!

What’s new–

  • Revised visualization and display creation
  • A new “statistics” view
  • Improved results view
  • Better tours and tutorials

RapidMiner v6.0 provides four specific application wizards:

  • Churn reduction
  • Direct marketing
  • Sentiment analysis
  • Predictive maintenance

Check it out today!

http://rapidminer.com/my-account/

Screenshot from 2013-11-21 21:20:01

RapidMiner takes things to the next level

I have watched Rapid Miner for quite some years including the R -extension, interview with founders , one of the first  marketplace for algorithms (or extensions to its statistical software) and use in sports analytics  has been much in the news lately.

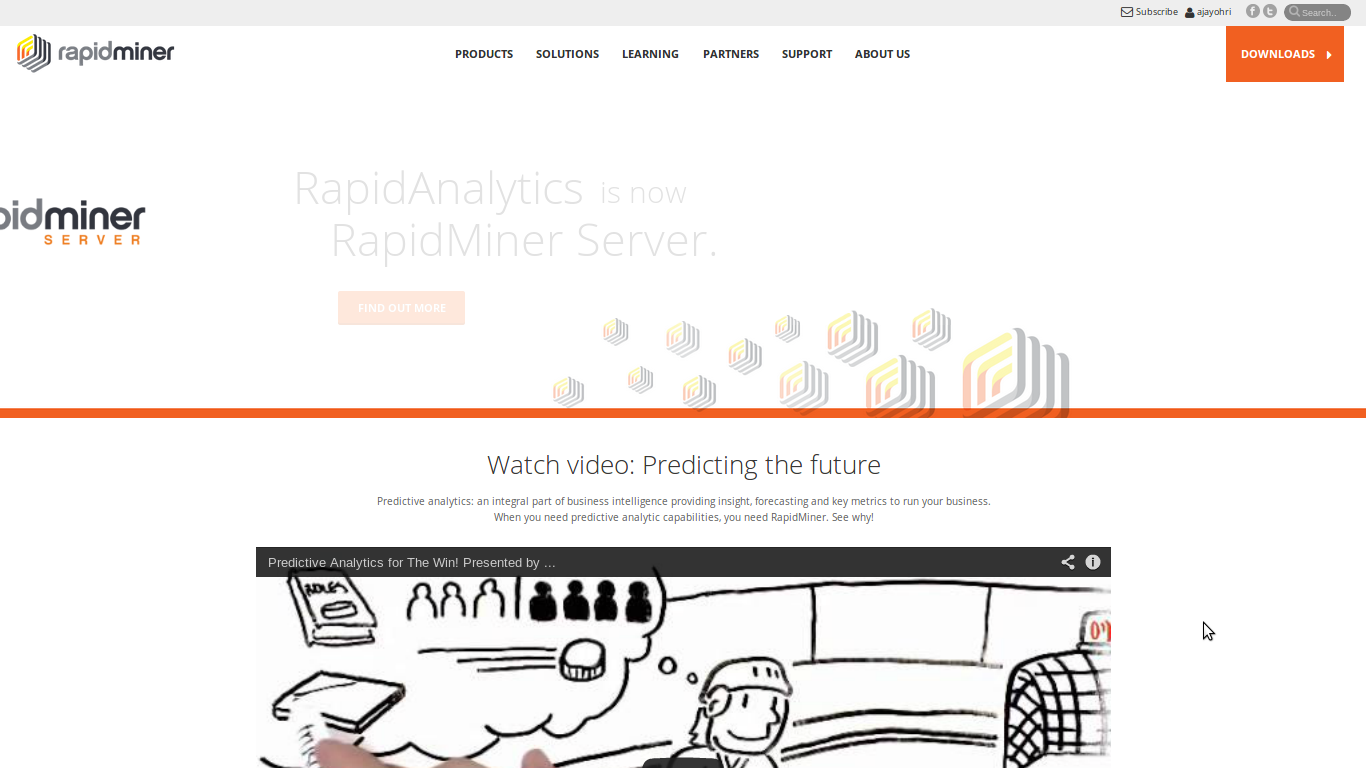
They got funded, revamped the website , changed the name from Rapid-I to Rapid Miner and are now announcing version 6 of their flagship software soon.

http://www.zdnet.com/rapid-i-gets-funded-re-brands-as-rapidminer-7000022757/

 A well-kept secret of the Analytics/Data Mining world may get some of the spotlight now, with a cool $5M in its pocket.

a successful $5M Series A funding round, with participation from European firms Earlybird Venture Capital and Open Ocean Capital (the latter firm having a strong pedigree from the team behind the MySQL relational database).

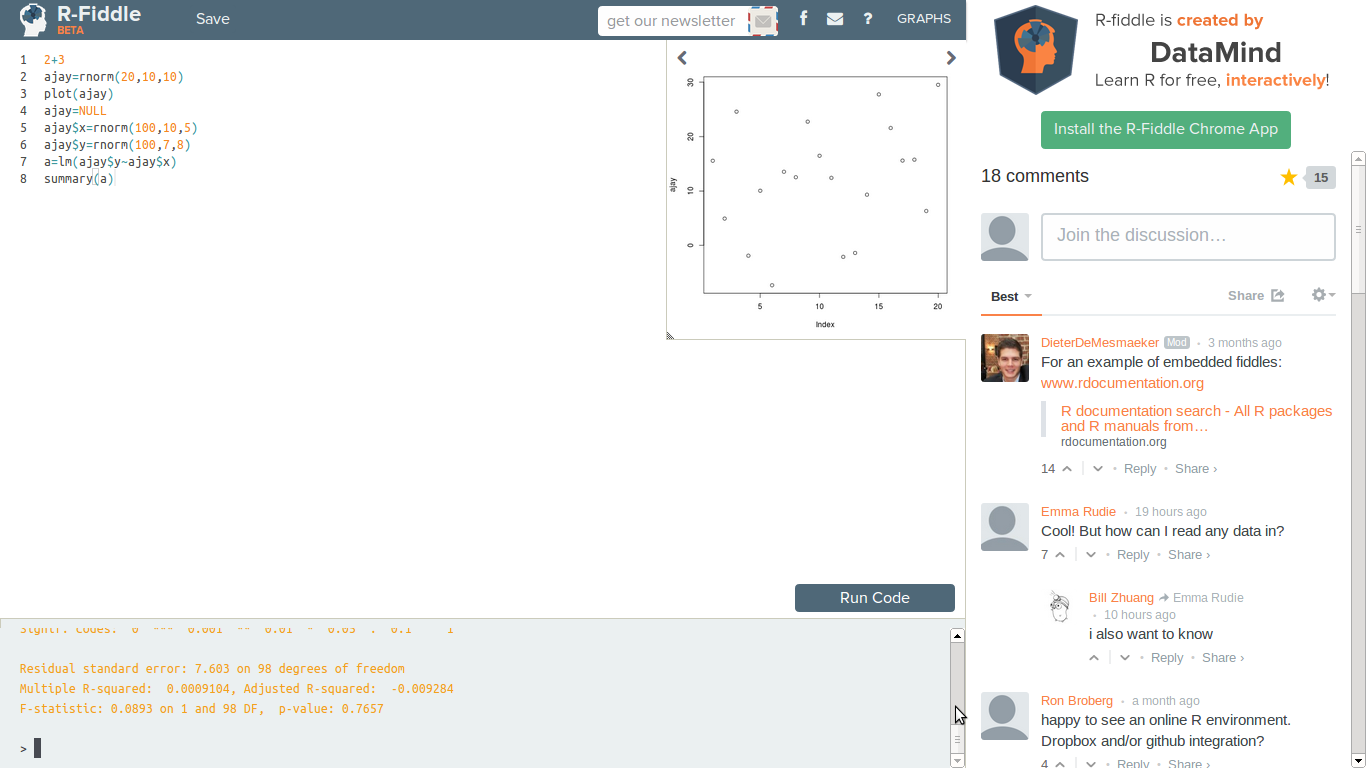
It has easily been the first open source statistical tool with Visual Programming ( something R is still yet to have despite efforts by RedR, Analytic Flow et al) and more importantly has a huge stack of enterprise clients.

Screenshot from 2013-11-15 18:38:20

http://rapidminer.com/products/rapidminer-studio/

RapidMiner 6 will have brand-new templates for churn reduction, sentiment analysis, predictive maintenance and direct marketing.  A data analysis toolbox has never been more user-friendly or more powerful.

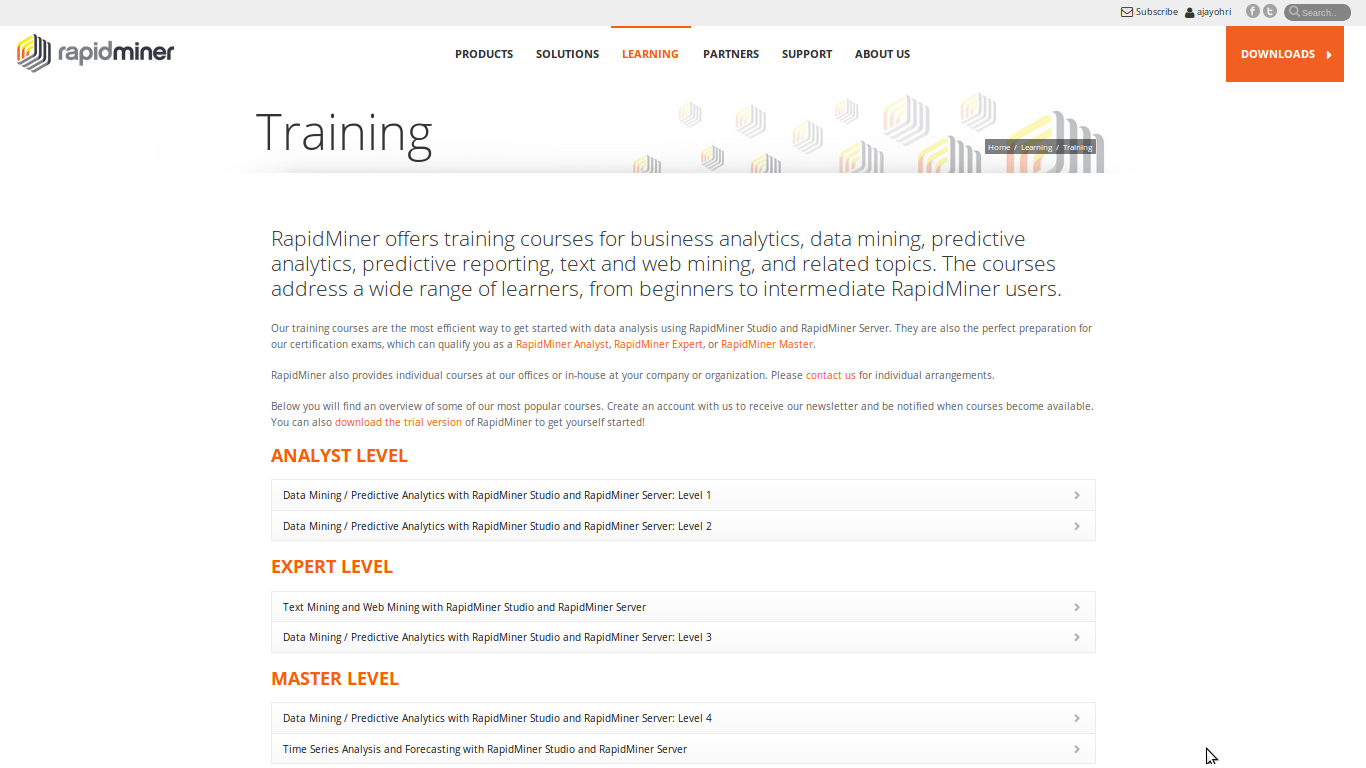
But best of all- they get a much easier training academy in place, and I am personally going to finally master it ( even though I have played a bit with it before

I do hope they make a MOOC (since the software is open source and free to download – how about some very easy to do self learning online tutorials)!

http://rapidminer.com/learning/training/

Introduction to Data Mining and Predictive Analytics with RapidMiner Studio and Server, December 3rd and 4th.
This course is a two-day introduction to the foundations of data mining, business analytics, and RapidMiner software. Participants will gain a complete understanding of how RapidMiner Studio and RapidMiner Server work and are used.

This course is the perfect preparation for the Image Mining training course.

Foundations of image processing, analysis and mining with the “Multimedia Mining-Image” (MUMI-Image) extension, December 5th and 6th.
This course is a two-day training on the foundations of image processing, analysis and mining with the “Multimedia Mining – Image” (MUMI-Image) extension for RapidMiner. After this training course, participants will have a complete understanding of how image mining analysis can be performed within RapidMiner Studio and Server, combining image processing techniques with the available data mining methods and data processing capabilities. Practical exercises ensure that the participants will be able to perform their own image analysis at the end of the class.

Screenshot from 2013-11-15 18:23:54

Blogger Disclosure- Rapid Miner has been a sponsor of Decisionstats.com for several years . I also like the software a lot!)