I really like two functions in ggmap package. One is geocode that converts any text charachter into basically a google maps query and returns the longitude and latitude for it.
library(ggmap)
geocode("Calgary")
geocode("Saddledome Calgary")
> geocode("Calgary")
Information from URL : http://maps.googleapis.com/maps/api/geocode/json?address=Calgary&sensor=false
Google Maps API Terms of Service : http://developers.google.com/maps/terms
        lon      lat
1 -114.0581 51.04532
> geocode("Saddledome Calgary")
Information from URL : http://maps.googleapis.com/maps/api/geocode/json?address=Saddledome+Calgary&sensor=false
Google Maps API Terms of Service : http://developers.google.com/maps/terms
        lon      lat
1 -114.0513 51.03811
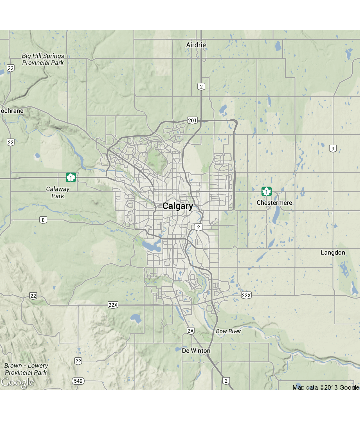
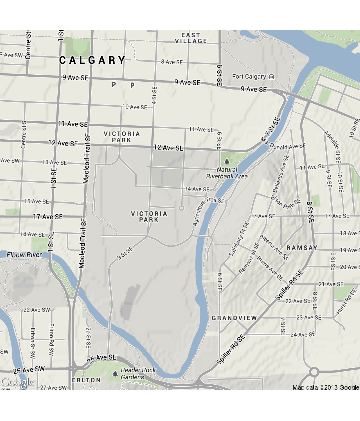
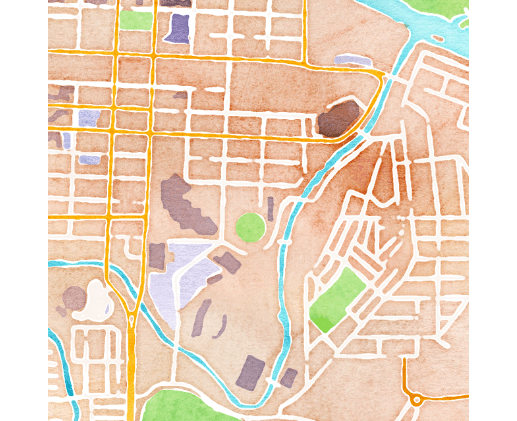
the other is qmap that makes a map out of the text query. We can change the level of detail using the zoom option.
One of the options that I like is of course watercolor using parameter maptype.
qmap("Saddledome Calgary")
qmap("Saddledome Calgary",zoom=15)
qmap("Saddledome Calgary",zoom=15,maptype="watercolor")
Other useful options for spatial analysis are get_map and ggmap which get and plot the map for a query. In between of course you can add the layers for your data.
This is a relatively recent package and you can test it out how it makes spatial analysis even more easy for beginners.
See the package site ,these slides , or this article on the R Journal.