
I really like two functions in ggmap package. One is geocode that converts any text charachter into basically a google maps query and returns the longitude and latitude for it.
library(ggmap)
geocode("Calgary")
geocode("Saddledome Calgary")
> geocode("Calgary")
Information from URL : http://maps.googleapis.com/maps/api/geocode/json?address=Calgary&sensor=false
Google Maps API Terms of Service : http://developers.google.com/maps/terms
        lon      lat
1 -114.0581 51.04532
> geocode("Saddledome Calgary")
Information from URL : http://maps.googleapis.com/maps/api/geocode/json?address=Saddledome+Calgary&sensor=false
Google Maps API Terms of Service : http://developers.google.com/maps/terms
        lon      lat
1 -114.0513 51.03811
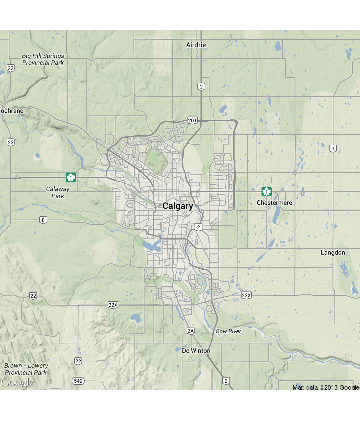
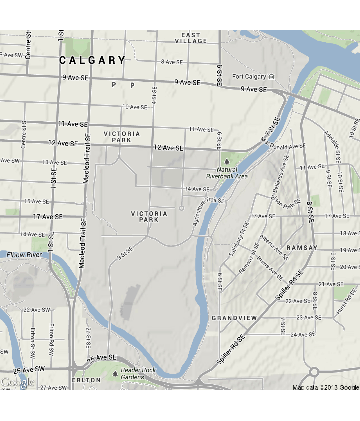
the other is qmap that makes a map out of the text query. We can change the level of detail using the zoom option.
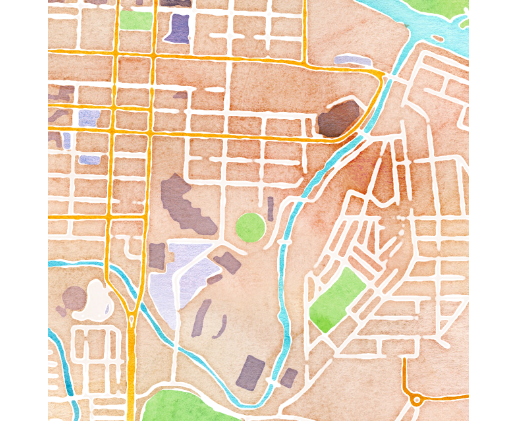
One of the options that I like is of course watercolor using parameter maptype.
qmap("Saddledome Calgary")
qmap("Saddledome Calgary",zoom=15)
qmap("Saddledome Calgary",zoom=15,maptype="watercolor")
Other useful options for spatial analysis are get_map and ggmap which get and plot the map for a query. In between of course you can add the layers for your data.
This is a relatively recent package and you can test it out how it makes spatial analysis even more easy for beginners.
See the package site ,these slides , or this article on the R Journal.

I would also have to agree. The “ggmap” package is a great way to show spatial data on a map. There are so many possible ways that you can use the package to show data for a region whether it be the whole world or just a city block in your city. What I like the most is how you can customize the map that you are showing your data on whether it be color or even how you pointed out editing the maps appearance like the watercolor example. All these reasons are why I like that it is a great package. Sorry if this sounds like a sales pitch but is really is a cool package.