
- Android Only Game
- Uses GIS or Google Maps API/ for geo-caching game
- Healthy for you- makes players walk from portals to another. You have to be within 40 m of a portal to recharge,capture of attack it. Makes you really walk a lot.
- Addictive and Immersive with impressive follow up media story.
- Can be used as base template for other games , and social experimentation
- Uses Points, Badges, Leaderboard of gamification
- Encourages direct face to face social interaction
- Has in game chat facility
- Zero in game currency . So no coiners or cheaters here
Month: October 2013

Things I wish I could Classify — by better and easier Machine Learning
- Web Analytics- Which customers are likely to convert and didnt. Which customers are not likely to stay and do. More analytics added to Google Analytics like Web Analytics
- Web Analytics Time Series models- web analytics is TS data. More forecasts. Automated Error detection and correction in forecasts
- Data Cleaning and Quality- Something like Google Refine (or open refine https://github.com/OpenRefine ) added before every Machine Learning Classification system I see. or software I see.
- More API integration- for data from the web, to classification models to the web
- Financial Data – Better interfaces and easier analytics. Every Financial Data is basically adding to a classification – Buy Sell Hold.
- Sentimental Analysis for the People- Easier to integrate Blog Data (though GA api) and Social Media Data (twitter , google plus, facebook APIs) to give user analytics of his own reputation across multiple social networks.
- Dating Website Recommendation Systems
These are a few of my favorite things…that I wish I could classify
And some military spying alogirthms that I wish they de classify because everyone has them- so they can show better ads, or build better internet connected night vision Glasses

Plyrmr- bringing #rstats Plyr to Map Reduce for Hadoop
Just saw this package, it is in testing early release now- Love the thought of Hadley’s Split Apply Combine Package being used for Map Reduce which is conceptually similar in many many ways. I do think though Revolution’s work in R and D needs to be applauded- given by the number of packages they have created- or funded AND donated( seperate blog post on this?) while RStudio seems more content on building basic blocks for infrastructure , without an adequate Big Data solution for R Studio itself.
Of course usage stats on RevoScaleR , Revolution’s Big Data package are not as transparent or in line with Free as Beer and Free as Speech philosophy that RStudio breathes in.
https://github.com/RevolutionAnalytics/RHadoop/wiki/plyrmr
This R package enables the R user to perform common data manipulation operations, as found in popular packages such as plyr and reshape2, on very large data sets stored on Hadoop. Like rmr, it relies on Hadoop mapreduce to perform its tasks, but it provides a familiar plyr-like interface while hiding many of the mapreduce details. plyrmr provides:
- Hadoop-capable versions of well known data.frame functions:
transform,subset,mutate,summarize,melt,dcastand more from packagesbase,plyrandreshape2. - Simple but powerful ways of applying any function operating on data.frames to Hadoop data sets:
doandmagic.wand. - Simple but powerful ways of aggregating data:
group,group.f,gatherandungroup. - All of the above can be combined by normal functional composition: delayed evaluation helps mitigating any performance penalty of doing so by minimizing the number of Hadoop jobs launched to evaluate an expression.
- New data frame functions which are also Hadoop-capable that are more suitable for development than some of the above:
selectandwhere.
Algorithms are everywhere
What is an algorithm anyway?
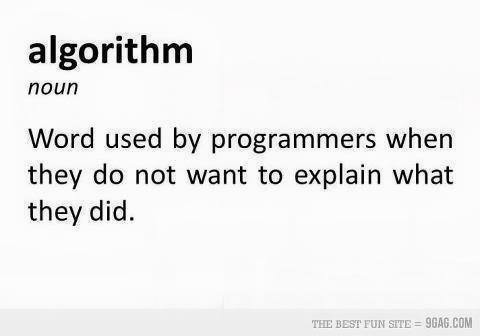
As per Wikipedia- http://en.wikipedia.org/wiki/Algorithm
an algorithm is a step-by-step procedure for calculations. Algorithms are used for calculation, data processing, and automated reasoning.
An algorithm is an effective method expressed as a finite list of well-defined instructions for calculating a function. Starting from an initial state and initial input (perhaps empty), the instructions describe a computation that, when executed, proceeds through a finite number of well-defined successive states, eventually producing “output” and terminating at a final ending state. The transition from one state to the next is not necessarily deterministic; some algorithms, known as randomized algorithms, incorporate random input
Where do I hear the word algorithm being used? Or the wat er cooler version- algols
I hear it everywhere- in newspapers especially GUARDIAN and NEW YORK TIMES
From search to security: the five most important algorithms in tech
- Pagerank – how Google calculates search results
- Public key cryptography – keeping credit card data secure
- Correcting errors (in CDs)
- Protecting passwords (cryptographic hash function)
- Perlin noise: generating landscapes in games
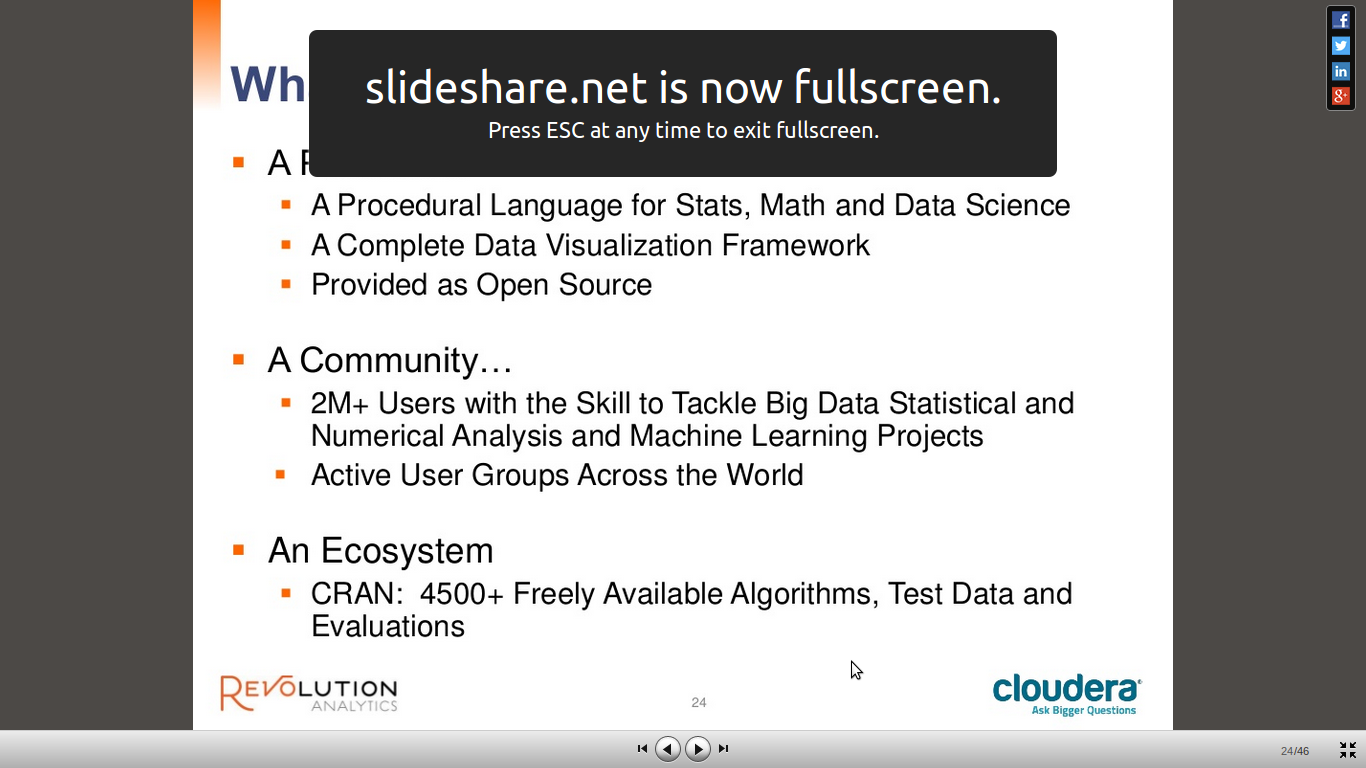
In Presentations-
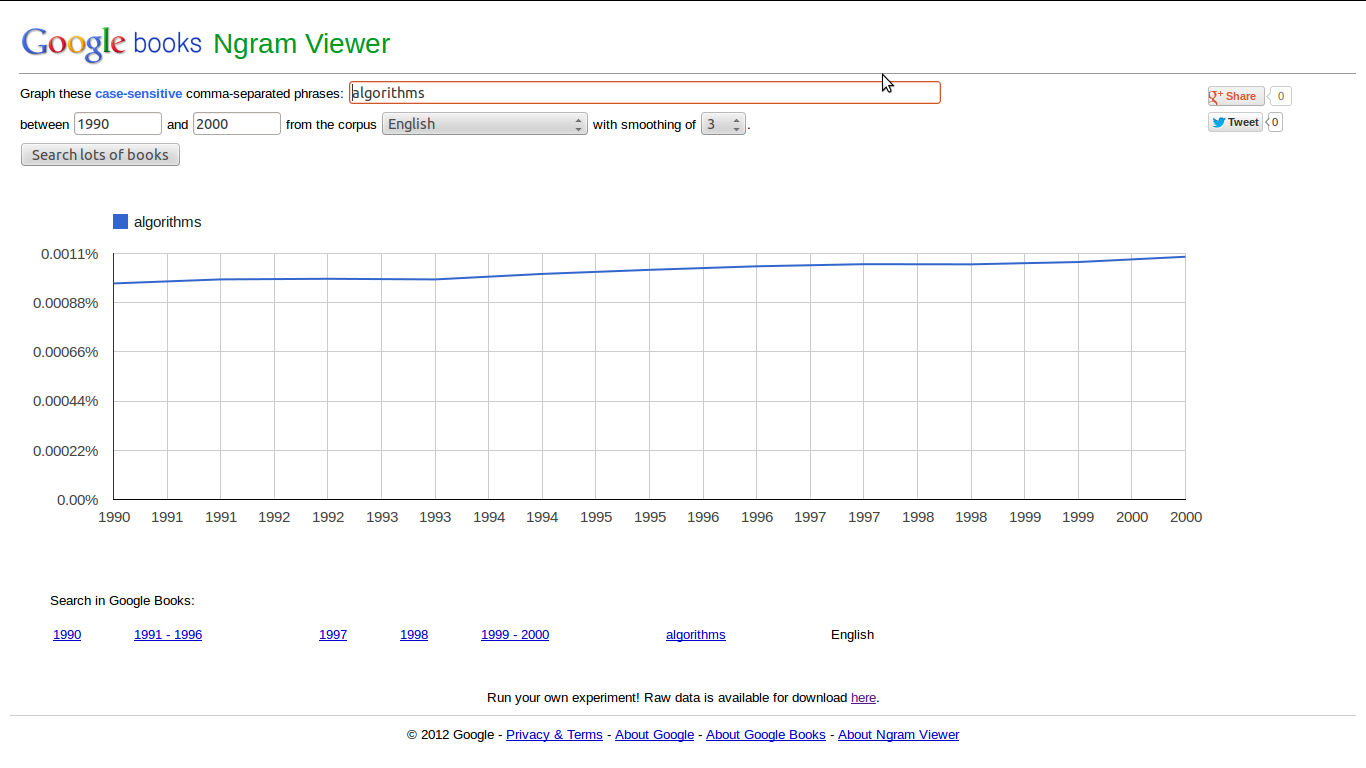
But Google NGrams thinks algorithms is flat in books
and Google Trends think the word is actually declining. But India remains a top user of searching for algorithms 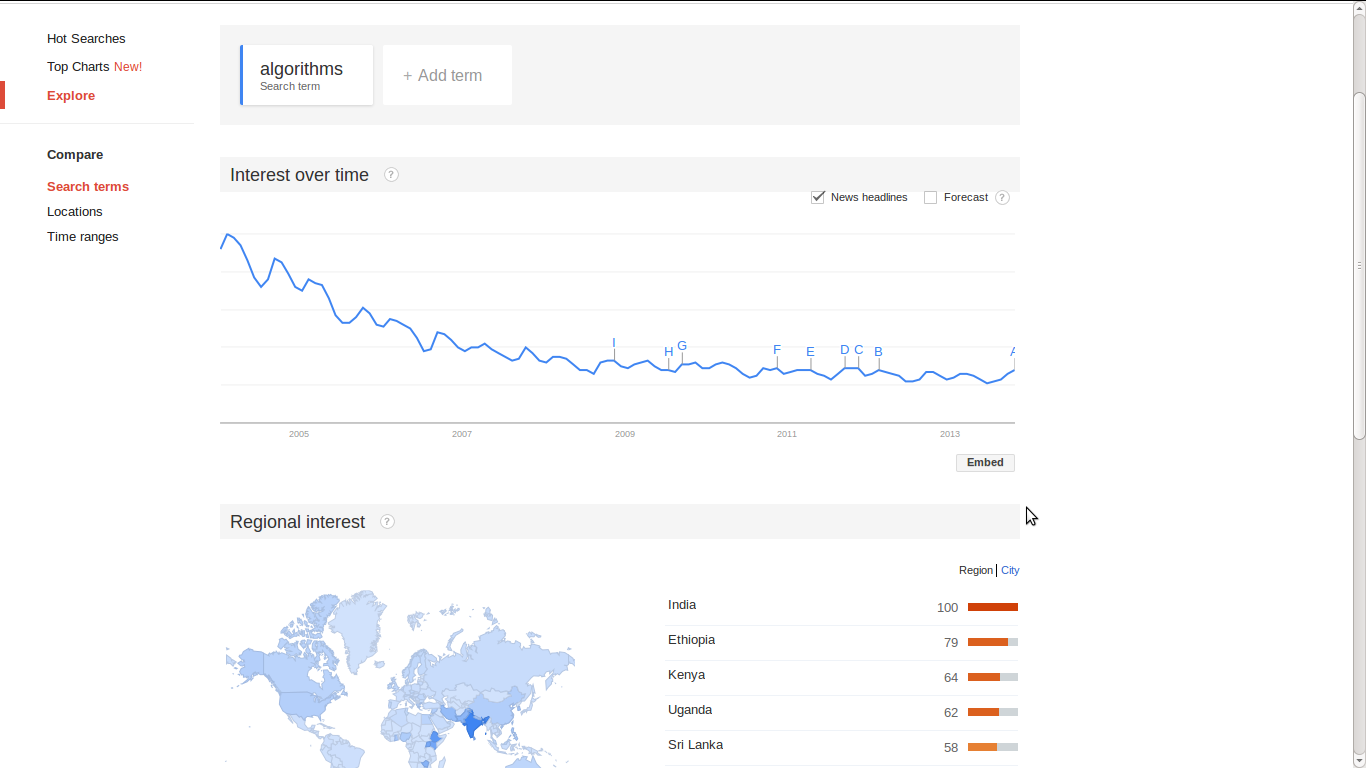
But algorithms are increasing in ArXiv articles 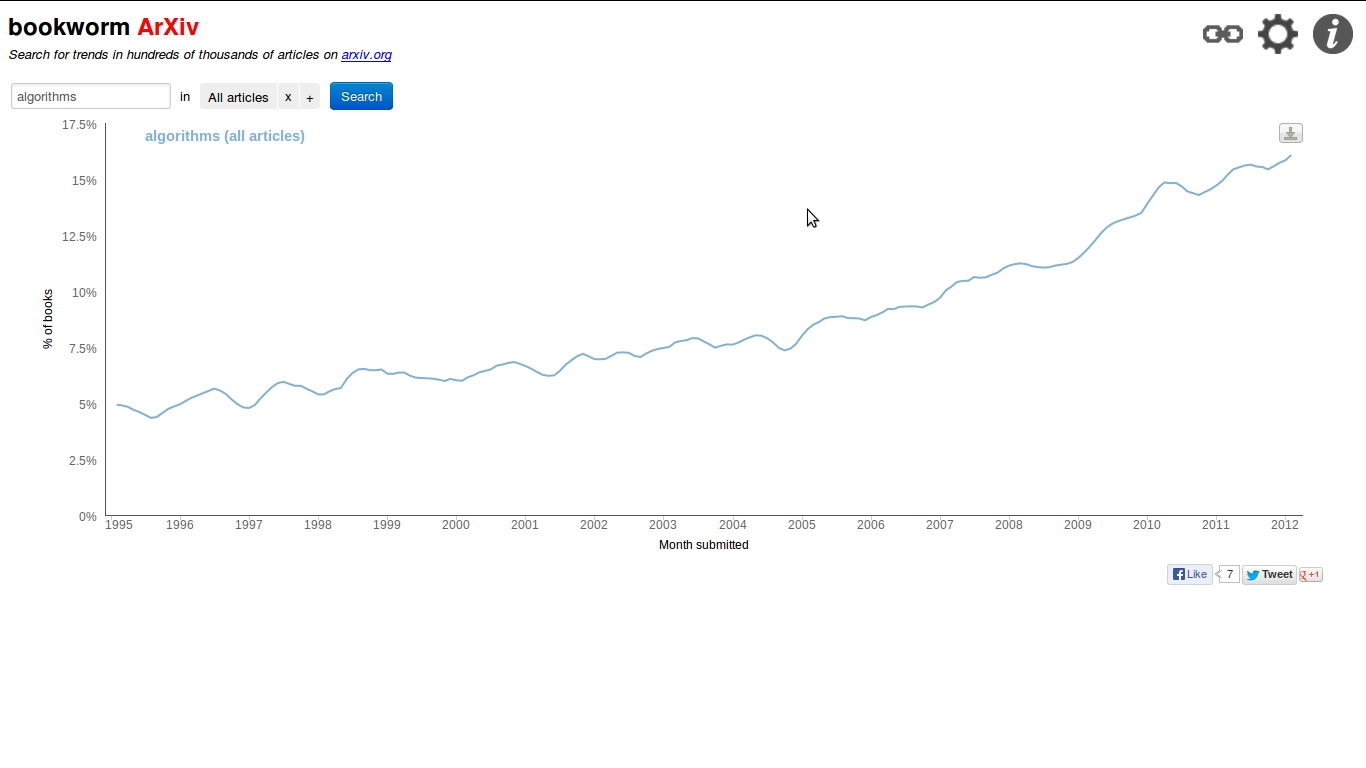
and there is a bit of up and down in Algorithms Jobs

What do you think- do you hear the word too much or too little?
Why a shutdown led US default could trigger The Third Opium War
What were The Opium Wars?
http://en.wikipedia.org/wiki/Opium_Wars
The Opium Wars, also known as the Anglo-Chinese Wars, divided into the First Opium War from 1839 to 1842 and the Second Opium War from 1856 to 1860. These were the climax of disputes over trade and diplomatic relations between China under the Qing Dynasty and the British Empire.
The import of opium into China stood at 200 chests (annual) in 1729,[1] when the first anti-opium edict was promulgated.[2][3] This edict was weakly enforced,[3] and by the time Chinese authorities reissued the prohibition in starker terms in 1799,[4] the figure had leaped; 4,500 chests were imported in the year 1800.[1] The decade of the 1830s witnessed a rapid rise in opium trade,[5] and by 1838 (just before the first Opium War) it climbed to 40,000 chests.[1][5]
Considering that importation of opium into China had been virtually banned by Chinese law, the East India Company established an elaborate trading scheme partially relying on legal markets, and partially leveraging illicit ones. British merchants carrying no opium would buy tea in Canton on credit, and would balance their debts by selling opium at auction in Calcutta. From there, the opium would reach the Chinese coast hidden aboard British ships then smuggled into China by native merchants. In 1797 the company further tightened its grip on the opium trade by enforcing direct trade between opium farmers and the British, and ending the role of Bengali purchasing agents. British exports of opium to China grew from an estimated 15 tons in 1730 to 75 tons in 1773. The product was shipped in over two thousand chests, each containing 140 pounds (64 kg) of opium.[21]
and
British military superiority drew on newly applied technology. British warships wreaked havoc on coastal towns; the steam ship Nemesis was able to move against the winds and tides and support a gun platform with very heavy guns. In addition, the British troops were the first to be armed with modern muskets and cannons, which fired more rapidly and with greater accuracy than the Qing firearms and artillery, though Chinese cannons had been in use since previous dynasties. After the British took Canton, they sailed up the Yangtze and took the tax barges, a devastating blow to the Empire as it slashed the revenue of the imperial court in Beijing to just a fraction of what it had been.
and
China’s Holdings of U.S. Securities: Implications for the U.S. Economy
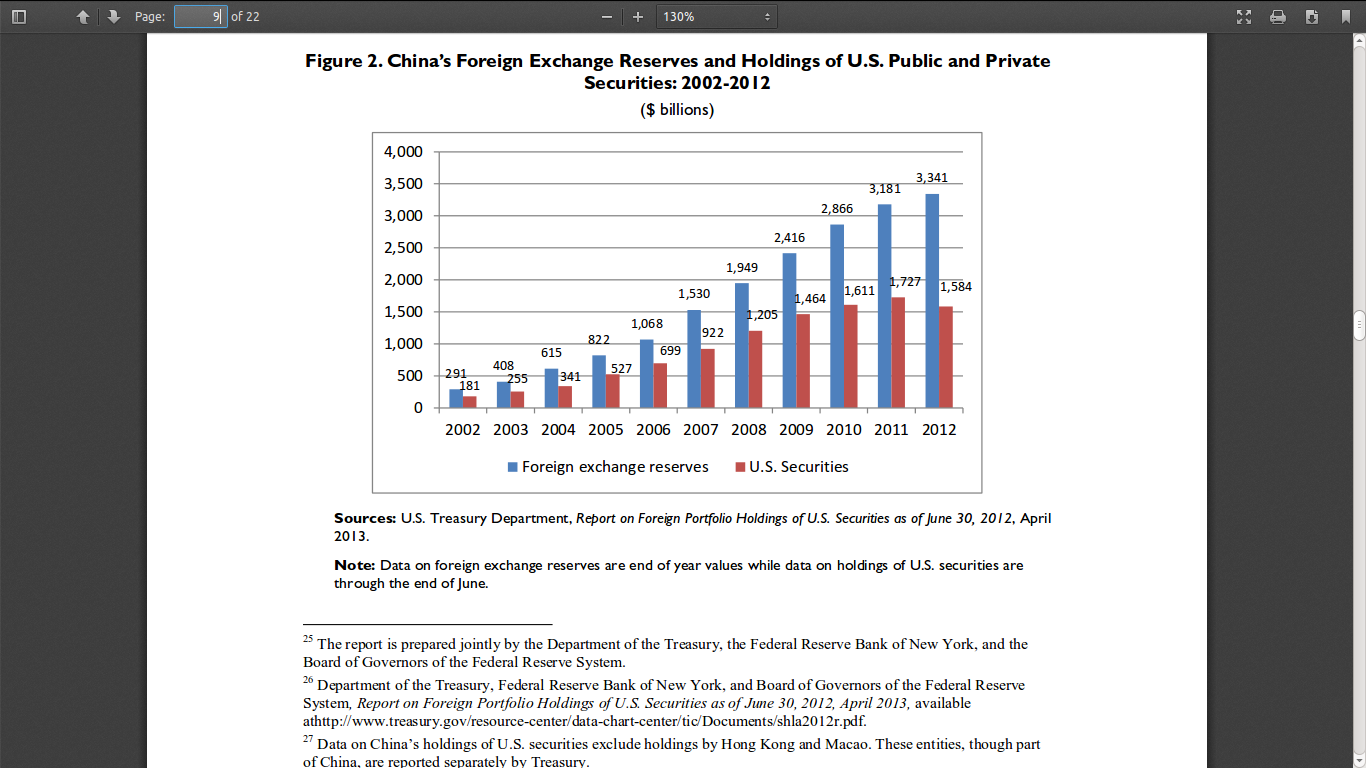
Notice how Chinese purchases of US Treasury mirror the rise in Opium purchases.
A technical default by US due to internal politics can enhance conflict and stress between China
It offers a great opportunity for the US to virtually cancel the US debt into half, by going into conflict.
The window of opportunity for US military superiority over China is limited- within a decade China would no longer be a generation behind US Aircraft Carriers.
—
So the US might just make a huge profit because of the shutdown. Still think that Boehner is crazy?
ps- In 1858, about twenty years after the first Opium War, the annual import rose to 70,000 chests (4,480 tons), approximately equivalent to global production of opium for the decade surrounding the year 2000
Ads and Analytics on Twitter is a lovely platform #ads #twitter #ipo #analytics #socialmedia
I really liked the simplicity and design of the Ads Platform in Twitter.
You can visit it here- https://ads.twitter.com
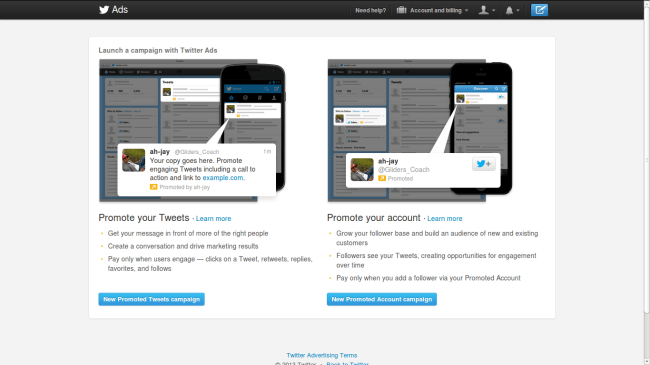 There are two options- either promote your tweet or promote your account
You pay only if the tweet gets an activity (retweet,favourite,reply,follow) or if you get a new follower.
That is an innovative breakthrough in social networks marketing.
Now if only Google Plus and LinkedIn network showed more such options- I would love to promote my blog on Google Plus- but I am not sure on the options.
I also like the simple design that Twitter Ads offers. I do think an initial free $5 for some accounts should help kickstart this adaptation in a much bigger way.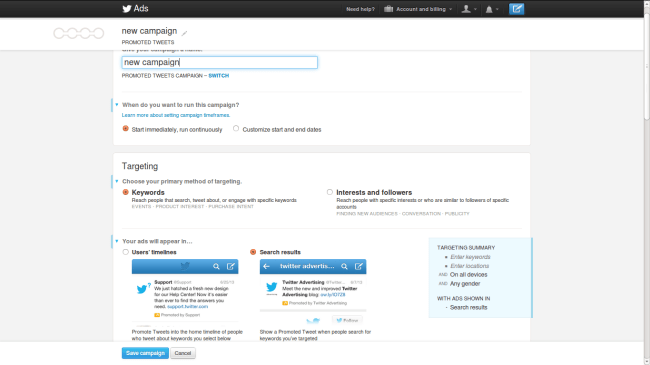
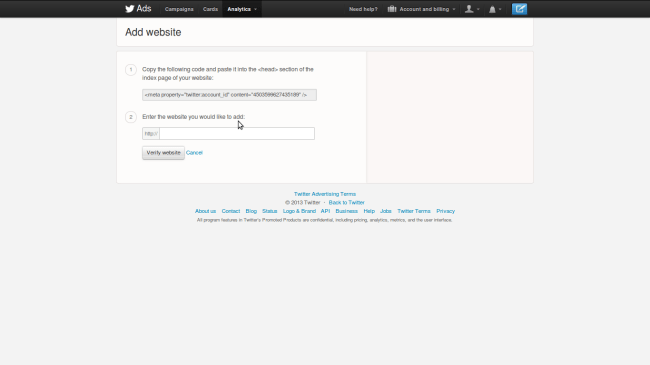
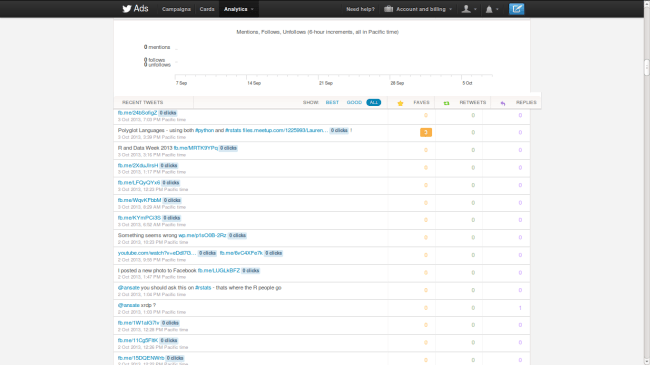
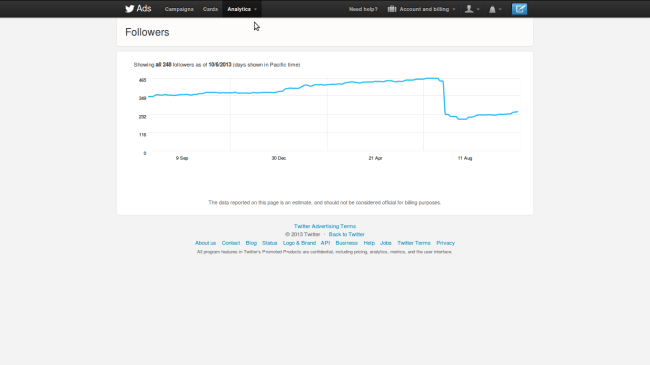
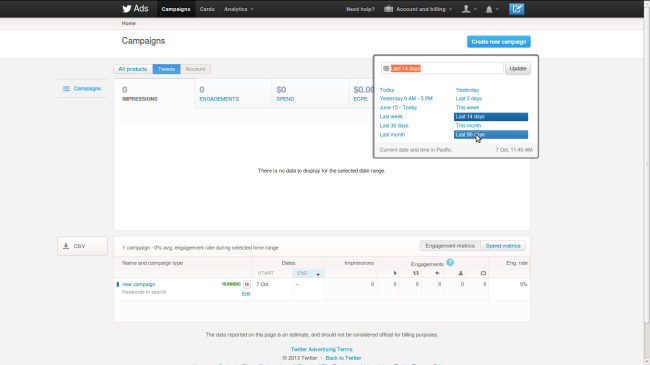
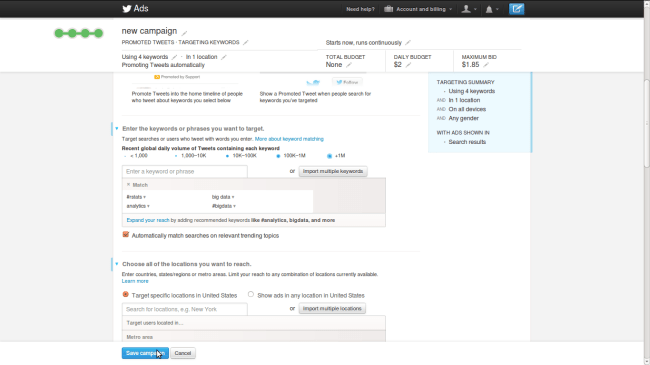
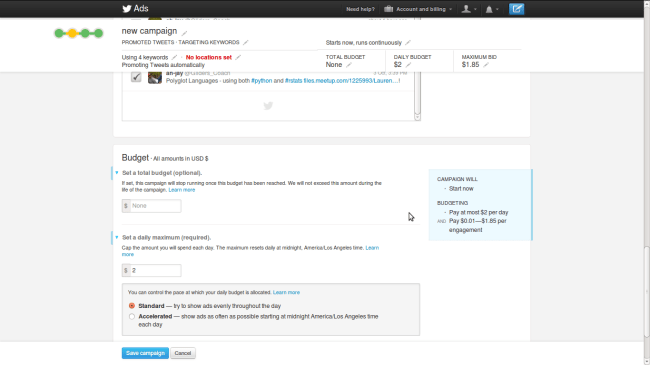
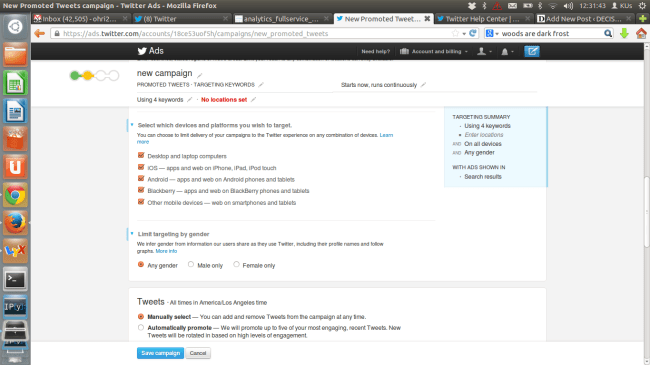
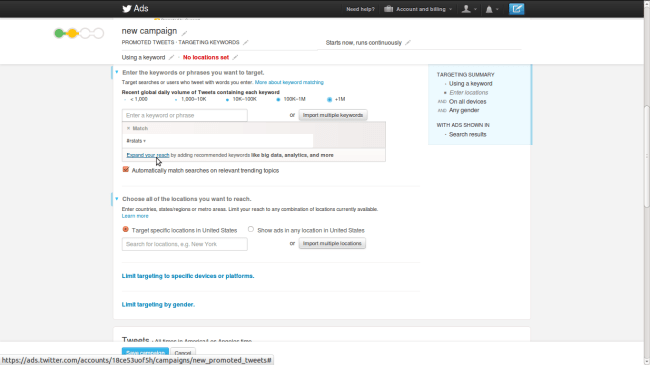 The recommended keywords is designed very nicely and subtly. You can click on screenshots for a better look (links have been updated)
Once you finalize your campaign- you should see a campaign dashboard.
You can also click on the Analytics tab on the top of campaign dashboard and see your own activity, thus adding to social media analytics options. Here it is more of a series of screenshots that is supposed to act as a mini- tutorial to make you familiar with the paltform.
Polyglots for Data Science #python #sas #r #stats #spss #matlab #julia #octave
In the future I think analysts need to be polyglots- you will need to know more than one language for crunching data.
SAS, Python, R, Julia,SPSS,Matlab- Pick Any Two 😉 or Any Three.
No, you can’t count C or Java as a statistical language 🙂 🙂
Efforts to promote Polyglots in Statistical Software are-
1) R for SAS and SPSS Users (free or book)
- JMP and R reference http://www.jmp.com/support/help/Working_with_R.shtml
2) R for Stata Users (book)
4) Using Python and R together
- Accessing R from Python (Rpy2) http://www.bytemining.com/wp-content/uploads/2010/10/rpy2.pdf
- Big Data with R and Python (though these have been made separately)
- Python for Data Analysis is a book .
Python for Data Analysis by Wes McKinney
Probably we need a Python and R for Data Analysis book- just like we have for SAS and R books.
- The RPy2 documentation is handy http://rpy.sourceforge.net/rpy2/doc-2.1/html/introduction.html
- A nice tutorial is also here – also the inspiration to writing this post http://files.meetup.com/1225993/Laurent%20Gautier_R_toPython_bridge_to_R.pdf#!
5) Matlab and R
Reference (http://mathesaurus.sourceforge.net/matlab-python-xref.pdf ) includes Python
5) Octave and R
package http://cran.r-project.org/web/packages/RcppOctave/vignettes/RcppOctave.pdf includes Matlab
reference http://cran.r-project.org/doc/contrib/R-and-octave.txt
6) Julia and python
- Julia and IPython https://github.com/JuliaLang/IJulia.jl
- PyPlot uses the Julia PyCall package to call Python’s matplotlib directly from Julia
7) SPSS and Python is here
8) SPSS and R is as below
- The Essentials for R for Statistics versions 22, 21, 20, and 19 are available here.
- This link will take you to the SourceForge site where the Version 18 Essentials and Plugins are hosted.
9) Using R from Clojure – Incanter
Use embedded R from Clojure and Incanter http://github.com/jolby/rincanter

