Rexer Analytics- What do you use for Data Mining? #rstats #spss #sas #bigdata

Message from Karl Rexer whom we have interviewed here. Come on show your support for your favorite data mining software.


Rexer Analytics has been conducting the Data Miner Survey since 2007.  Each survey explores the analytic behaviors, views and preferences of data miners and analytic professionals.  Over 1300 people from around the globe participated in the 2011 survey.  Summary reports (PDFs of about 40 pages) from previous surveys are available FREE to everyone who requests them by emailing at DataMinerSurvey@RexerAnalytics.com.

Also, highlights of earlier Data Miner Surveys are available online, including best practices shared by respondents on analytic success measurement, overcoming data mining challenges, and other topics.  The FREE Summary Report for this 2013 Data Miner Survey will be available to everyone in the fall of 2013.

Your survey responses are completely confidential.  This research is not being conducted on behalf of any third party, but is solely for Rexer Analytics to disseminate the findings throughout the data mining and analytics community.

To participate, please click on the link below, then click on the “Start Survey” link on the bottom of the webpage.  Please enter the access code in the space provided.  The survey should take approximately 15-20 minutes to complete.  Anyone who has had this email forwarded to them should use the access code in the forwarded email.

Survey Link:  www.RexerAnalytics.com/Data-Miner-Survey-2013-Intro.html

Access Code:  UL3X7

R in Oracle Java Cloud and Existing R – Java Integration #rstats

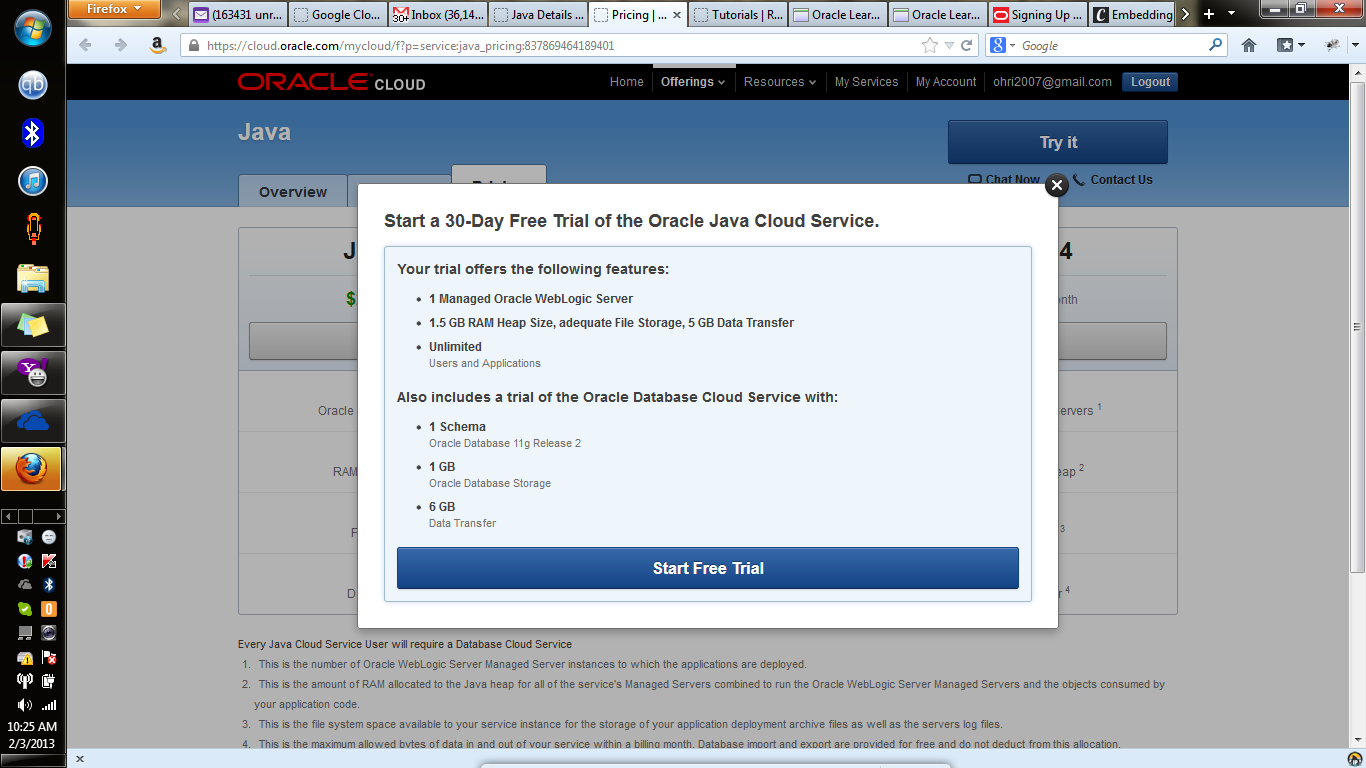
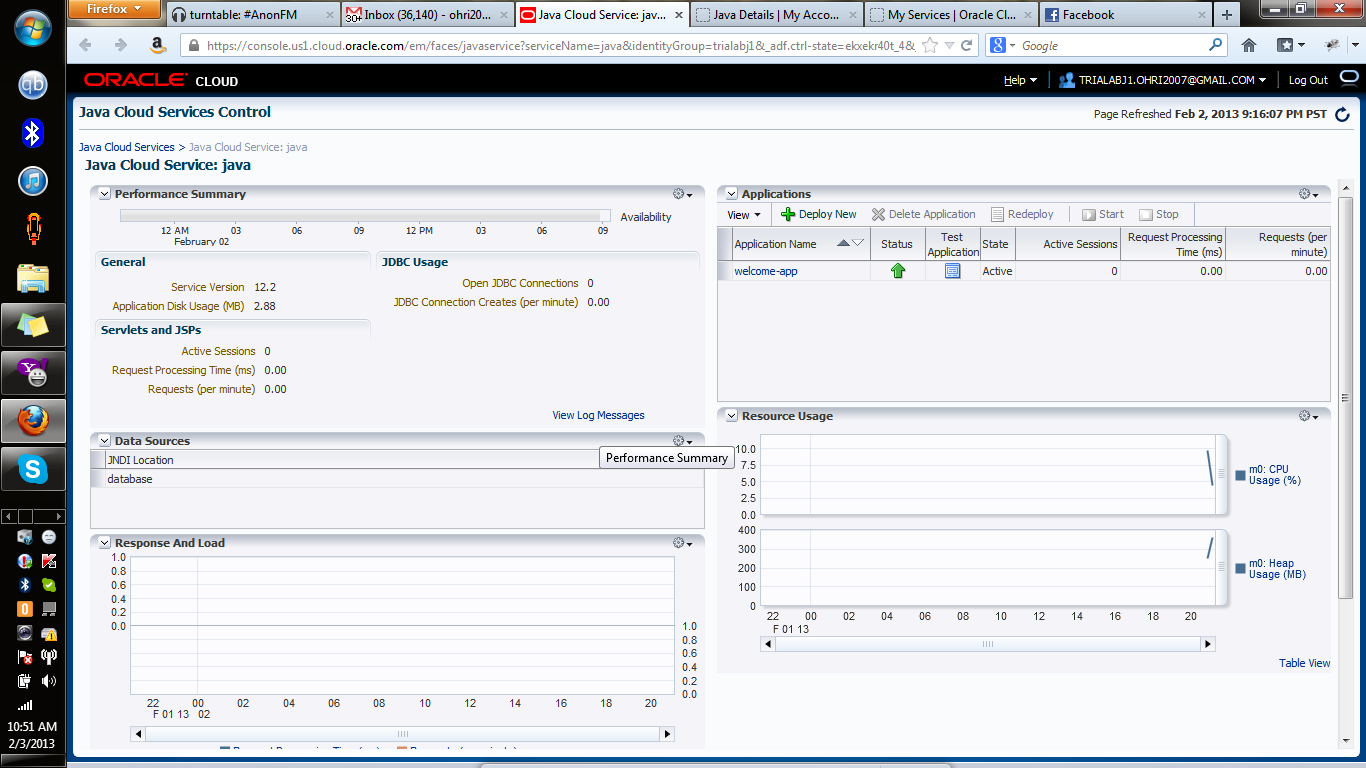
So I finally got my test plan accepted for a 1 month trial to the Oracle Public Cloud at https://cloud.oracle.com/ .

oc1 I am testing this for my next book R for Cloud Computing ( I have already covered Windows Azure, Amazon AWS, and in the middle of testing Google Compute).

Some initial thoughts- this Java cloud seemed more suitable for web apps, than for data science ( but I have to spend much more time on this).

I really liked the help and documentation and tutorials, Oracle has invested a lot in it to make it friendly to enterprise users.

Hopefully the Oracle R Enterprise  ORE guys can talk to the Oracle Cloud department and get some common use case projects going.

oc3.7

In the meantime, I did a roundup on all R -Java projects.

They include- Continue reading “R in Oracle Java Cloud and Existing R – Java Integration #rstats”

Interview Jeff Allen Trestle Technology #rstats #rshiny

Here is an interview with Jeff Allen who works with R and the new package Shiny in his technology startup. We featured his RGL Demo in our list of Shiny Demos- here

30cfc91

Ajay- Describe how you started using R. What are some of the benefits you noticed on moving to R?

Jeff- I began using R in an internship while working on my undergraduate degree. I was provided with some unformatted R code and asked to modularize the code then wrap it up into an R package for distribution alongside a publication.

To be honest, as a Computer Science student with training more heavily emphasizing the big high-level languages, R took some getting used to for me. It wasn’t until after I concluded that initial project and began using R to do my own data analysis that I began to realize its potential and value. It was the first scripting language which really made interactive use appealing to me — the experience of exploring a dataset in R was unlike anything Continue reading “Interview Jeff Allen Trestle Technology #rstats #rshiny”

3rd Meeting for New Delhi R users group #rstats

We continued the 3 rd month without a sponsor for the R User Meetup group. I wish analytics companies in Gurgaon and Mumbai or even Hyderabad can help sponsor R users meetups, as we need to have more knowledge sharing culture here.

I am a bit disappointed by people who RSVP yes, but cancel out without letting us know.

Some additional insights-

1) Never hold meetup on cricket match day

2) location should be very close to Metro Station.

3) Saturdays will be the only meetup day for future. If I am unavailable, Dr Amir will be leading the Meetup.

Some more action points-

1) Ajay and Dr Amir to work together on a blog / site called R for Medical Researchers focused on Indian issues.

2) For Web Application developers, please see shiny package. I have written on the latest version of Shiny- but I would also like you to click on each of the 18 links I have written in this article. Shiny is great for statistically enabling web apps.

https://decisionstats.com/2013/01/26/shiny-0-3-released-new-era-for-rstats/

3) We will be uploading files and creating a slideshare for Delhi R Users. This will be our  digital archive.

4) To start using R immediately use Rattle ( http://rattle.togaware.com/) especially if you build models or need to use data mining

5) To start using R for GIS and Spatial use Deducer with Spatial Plot Builder Plugin
http://www.deducer.org/pmwiki/index.php?n=Main.SpatialPlotBuilder

6) To integrate R with C++ see the RCPP gallery with almost 100 plus packages dependent on it. This will be needed with Developers who are trying to use a faster version of R by using C++ . http://gallery.rcpp.org/

7) Web Analytics using R- is now updated for changes in Google APIs. https://decisionstats.com/2013/01/28/google-analytics-using-rstats-updated/

8) If you are new to programming or Ruby or Python  please go to http://codeacdemy.com .

9) For a beginner in R use http://tryr.codeschool.com

Minutes of Meeting -courtesy Dr Amir

four people (Ajay, myself, Ashish and Nagesh) joined for the 3rd meetup today at around 4 pm at hauz khas village. Ashish and Nagesh are two new members who attended the meetup for the first time. Ashish is in web development with knowledge of python and perl. today he introduced the group about data scraping from web using Perl. Nagesh has a background in management and currently working with insurance company. he is planning to switch to R as it is free. he currently uses SAS. Ajay introduced GUIs like Rattle, Deducer; books (R for business analytics which he himself has authored and others like R for spss and sas users, data mining with r, rattle) and GADM for mapping. I introduced Coursera courses which is currently ongoing and which uses R and also the basics of R like packages, functions and strengths of R.
Ashish has volunteered to find a place for meetup in Green Park near the metro station as we are still struggling to get a decent place for our meetups.
important links:
https://www.coursera.org/course/dataanalysis (coursera course which uses R)
http://www.statmethods.net/index.html  (Quick R site for help)

Also – here is the meetup group for New Delhi R Users

http://www.meetup.com/New-Delhi-R-UseR-Group/

Shiny 0.3 released . New era for #rstats

Message from Winston Cheng of R Studio.

—-

We’ve released Shiny 0.3.0, and it’s available on CRAN now. Glimmer will be updated with the latest version of Shiny some time later today.
To update your installation of Shiny, run:
  install.packages(‘shiny’)
Highlights of the new version include:
* Some bugs were fixed in `reactivePrint()` and `reactiveText()`, so that they have slightly different rules for collecting the output. Please be aware that some changes to your apps’ text output is possible. The help pages for these functions explain the behavior.
* New `runGitHub()` function, which can run apps directly from a repository on GitHub
* New `runUrl()` function, which can run apps stored as zip or tar files on a remote web server.
* New `isolate()` function, which allows you to access reactive values (from input) without making the function dependent on them.
* Improved scheduling of evaluation of reactive functions, which should reduce the number of “extra” times a reactive function is called.

SAS gets awesome revenues

There are 2.87 billion reasons SAS is not going away anywhere in the Big Data Analytics space. Yes , thats the revenue figures declared by them-http://www.sas.com/news/preleases/2012financials.html

Of course I have always wondered how much they earn from SAS Federal LLC ( which is a subsidary that caters to the lucrative and not very competitive analytics in Intelligence) and their revenue breakdown by Product ( how much did they earn by Base SAS licenses versus how much they earned by Cyber Security  http://www.sas.com/industry/government/cybersecurity/index.html )

I wonder how many other analytics companies have even realized that they can help cut down the federal government costs ( or even have something close to this http://www.sas.com/industry/government/national-security/intelligence-management.html )

This year revenue breakdown was-

The Americas generated 47 percent of SAS’ total revenue; Europe, Middle East and Africa (EMEA) 41 percent; and Asia Pacific 12 percent.

but last year

The Americas accounted for 46 percent of total revenue; Europe, Middle East and Africa (EMEA) 42 percent; and Asia Pacific 12 percent

So Americas revenue grew faster than Europe revenues!Okay

Continue reading “SAS gets awesome revenues”

Data Visualization for R packages at Github #rstats

I noticed this article sometime back by the most excellent hacker, John Myles White ( author Machine learning for Hackers)

http://www.johnmyleswhite.com/notebook/2012/08/12/the-social-dynamics-of-the-r-core-team/

Professor John Fox, whom we have interviewed here as the creator of R Commander, talked on this at  User 2008 http://www.statistik.uni-dortmund.de/useR-2008/slides/Fox.pdf

I also noticed that R Project is stuck on SVN ( yes or no??, comment please) while some part of the rest of the World has moved on to Git. See http://en.wikipedia.org/wiki/Git_%28software%29

Is Git really that good compared to SVN http://stackoverflow.com/questions/871/why-is-git-better-than-subversion

Maybe, I think with 5000 packages and more , R -project needs to have more presence on Github and atleast consider Git for the distributed and international project R is becoming.

Continue reading “Data Visualization for R packages at Github #rstats”