I am speaking at this event next Sunday
There is a discount code
Register with discount code of 20% off on INR 3000 Pass
DISCOUNT CODE : INWKPTR20
(limited to 50 registrations only)


I am speaking at this event next Sunday
There is a discount code
Register with discount code of 20% off on INR 3000 Pass
DISCOUNT CODE : INWKPTR20
(limited to 50 registrations only)
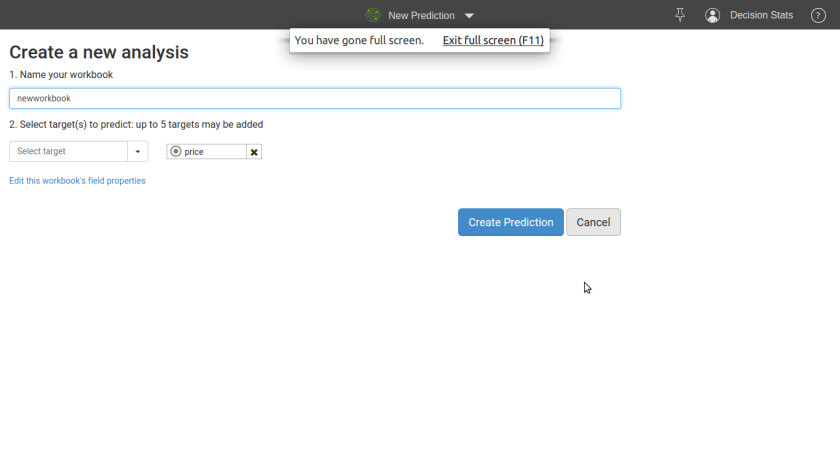
Step 1
Upload Dataset
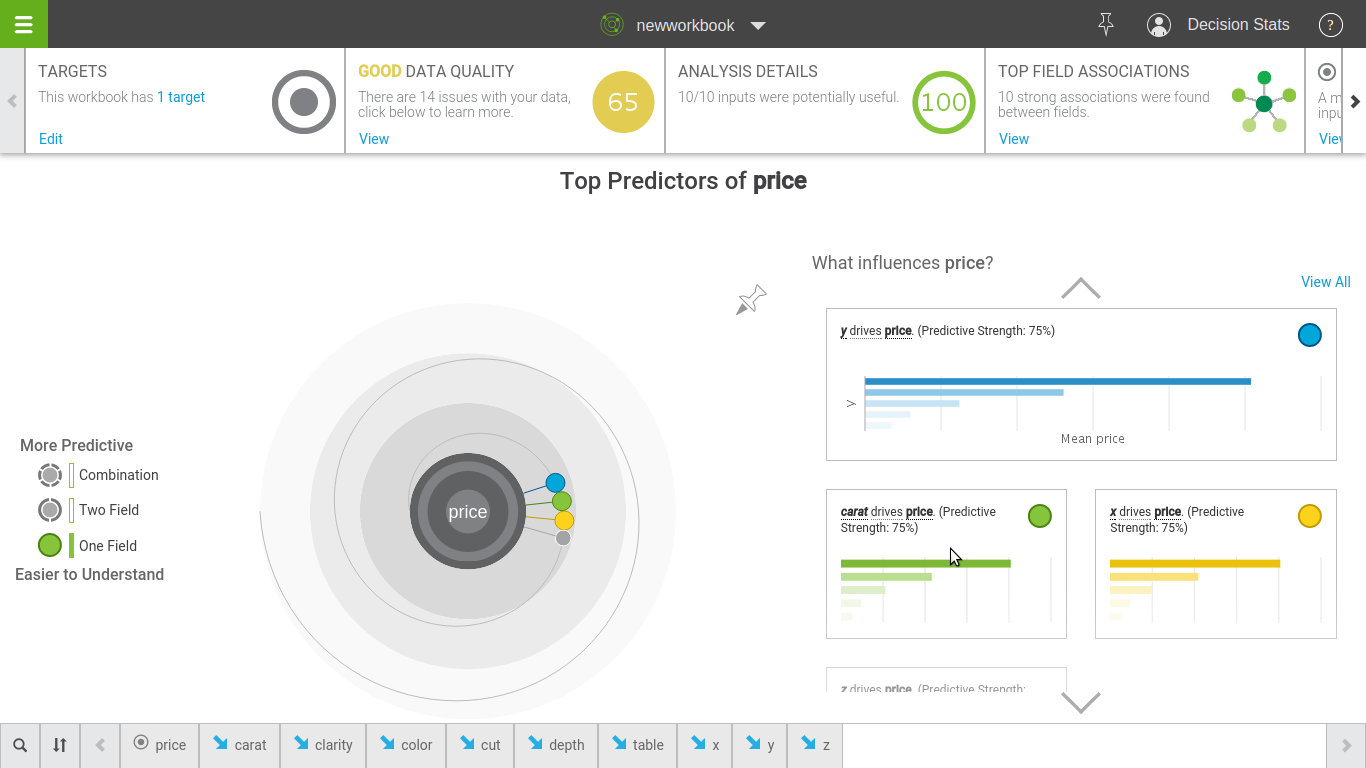
Step 2
Click Prediction
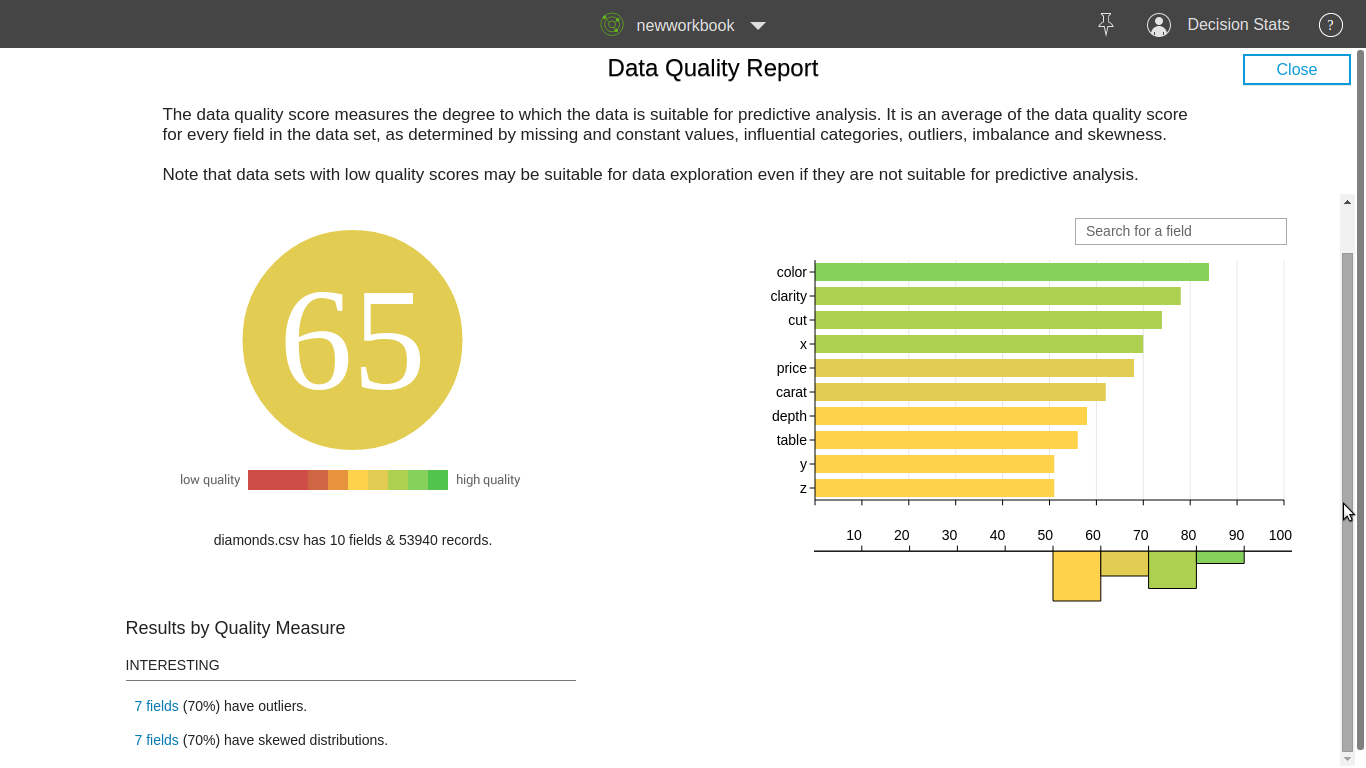
Step 3
Be blown away
I got the email from IBM saying try out Watson, yada yada yada. I was not so sure what to expect. So i uploaded the diamonds dataset from the flagbearer ggplot2 package in R.
Simple benchmark- can IBM Watson data viz beat the best data viz package (ggplot2) in the best statistical language (R)
To my chagrin and humility- here are the results
Interface is awesome
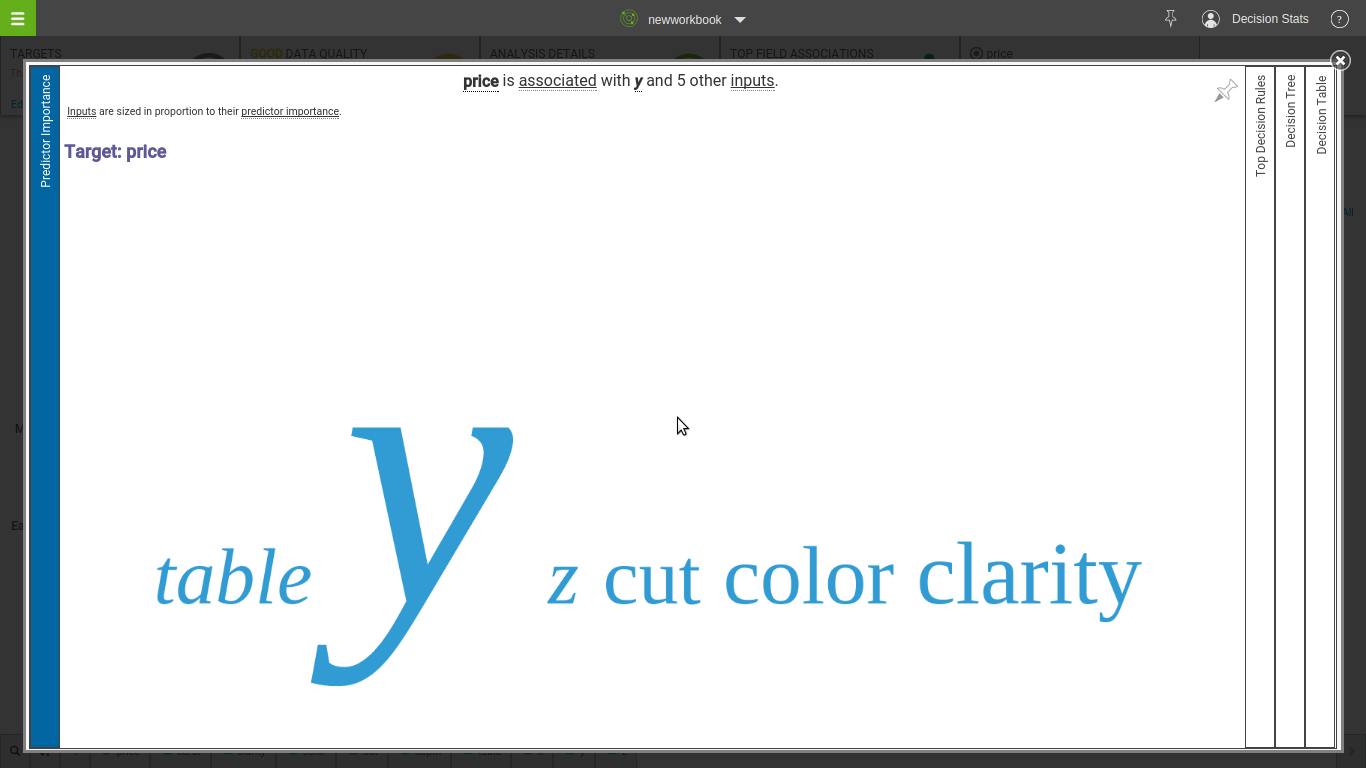
Watson actually asks questions which an experienced Data Scientist would ask
The default data visualization is actually superior but the tabs for customizing appearance needs some work.
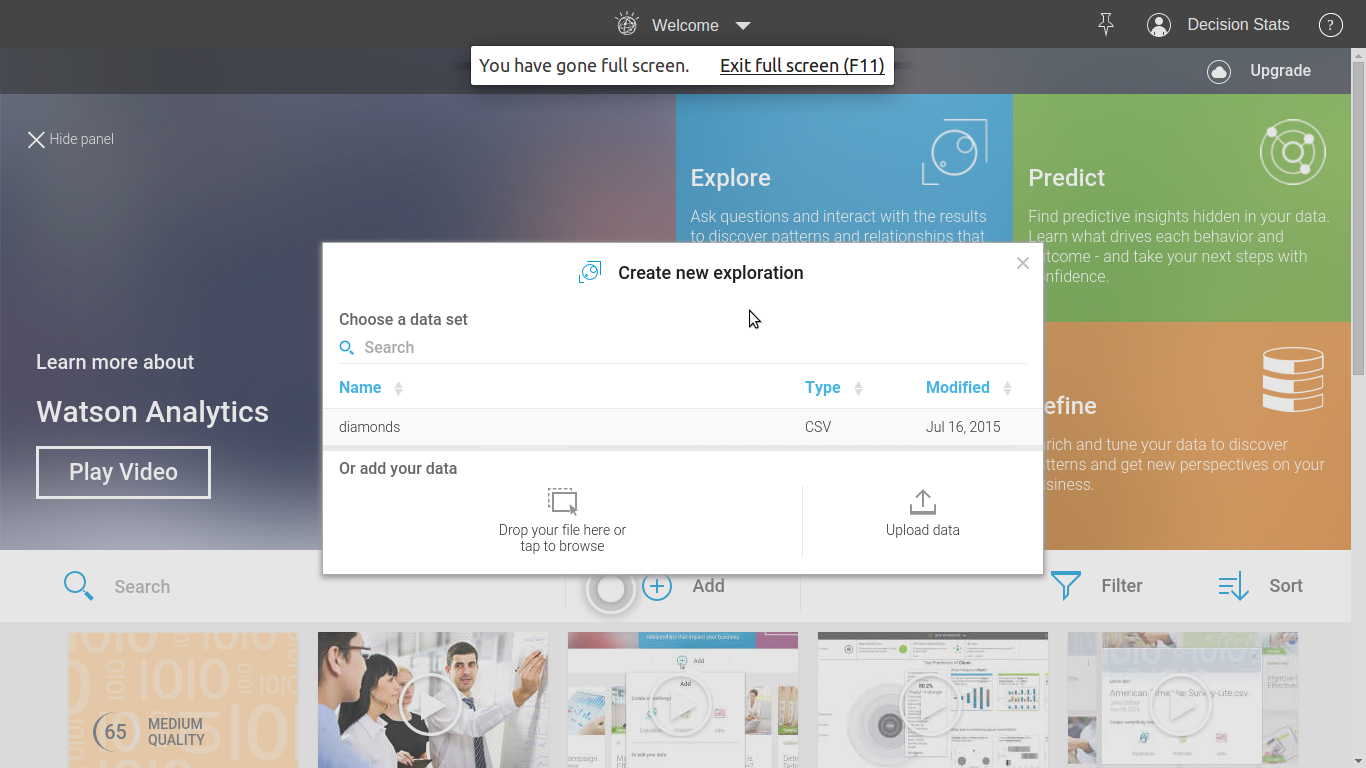
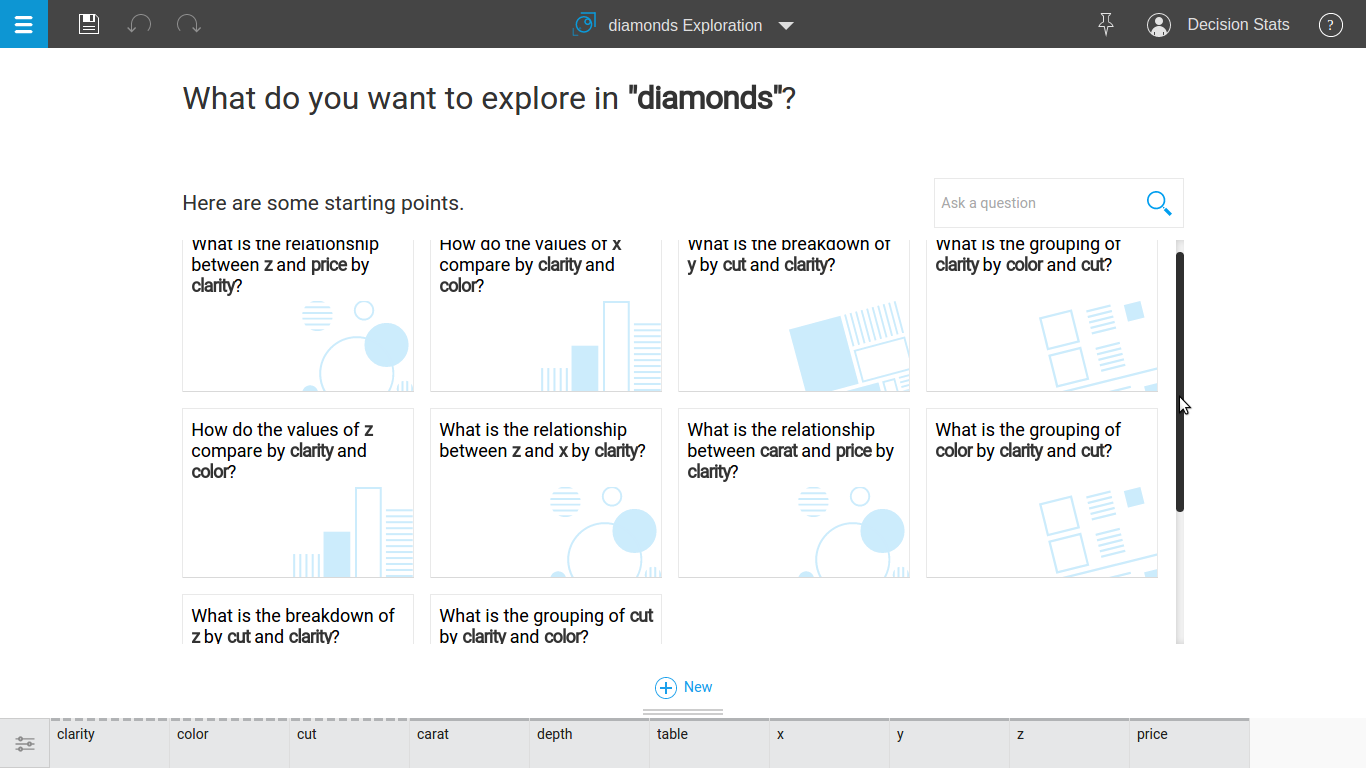
STEP 1
Just uploaded the dataset and these were some of the questions asked by Watson to me.
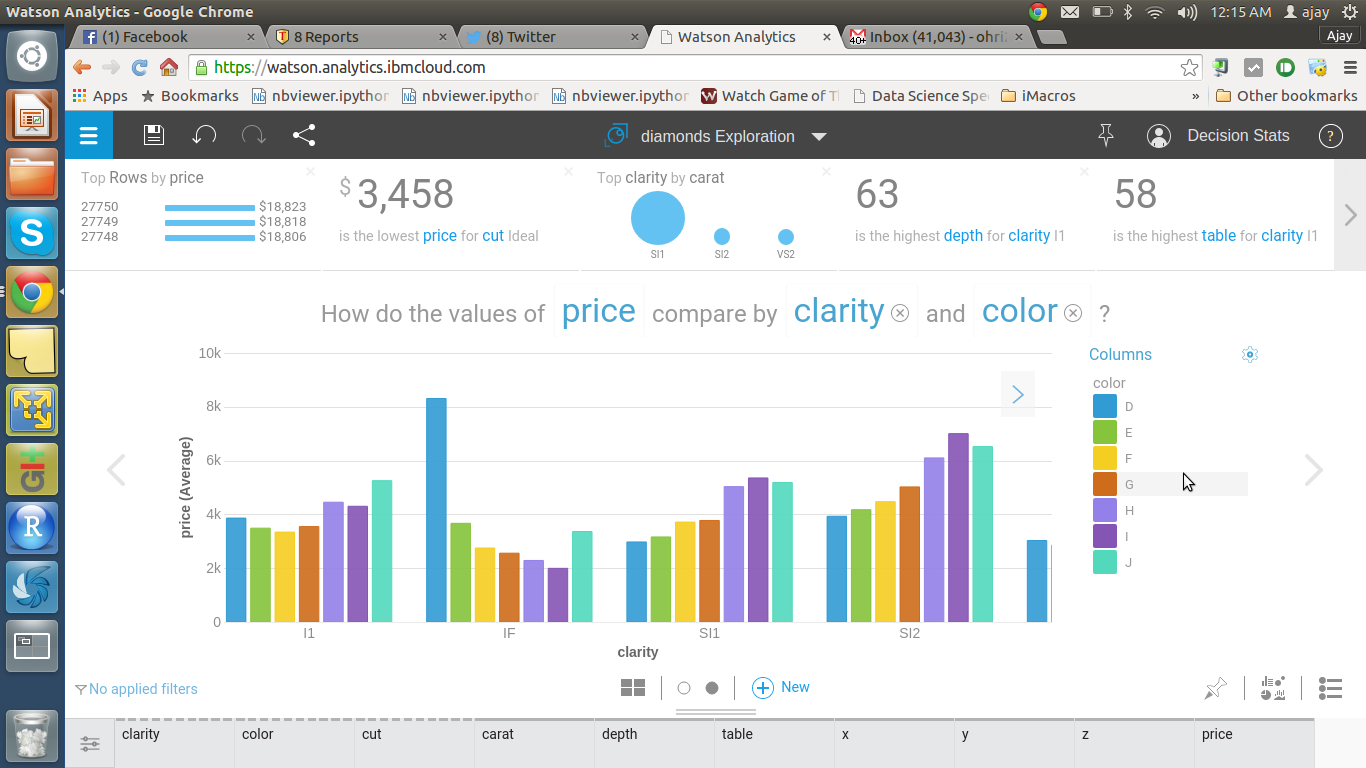
 Step 2
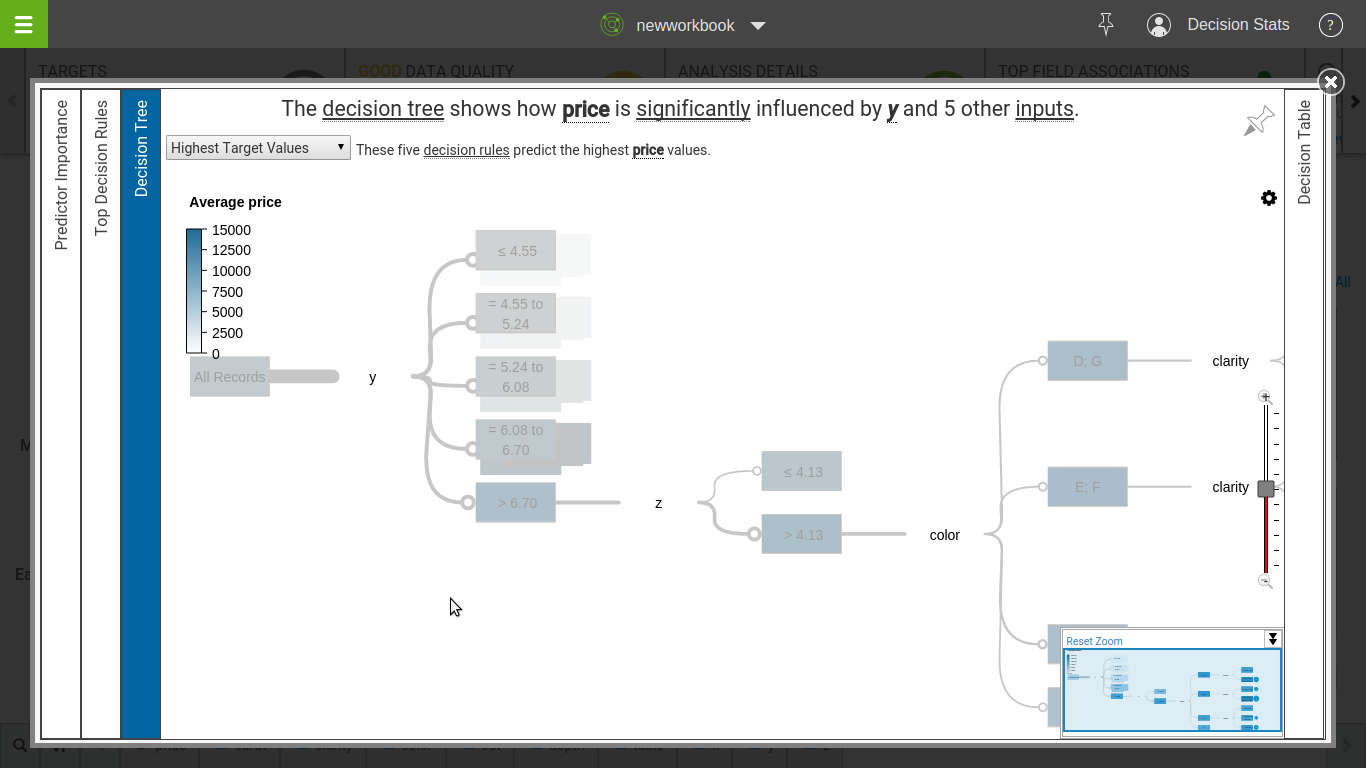
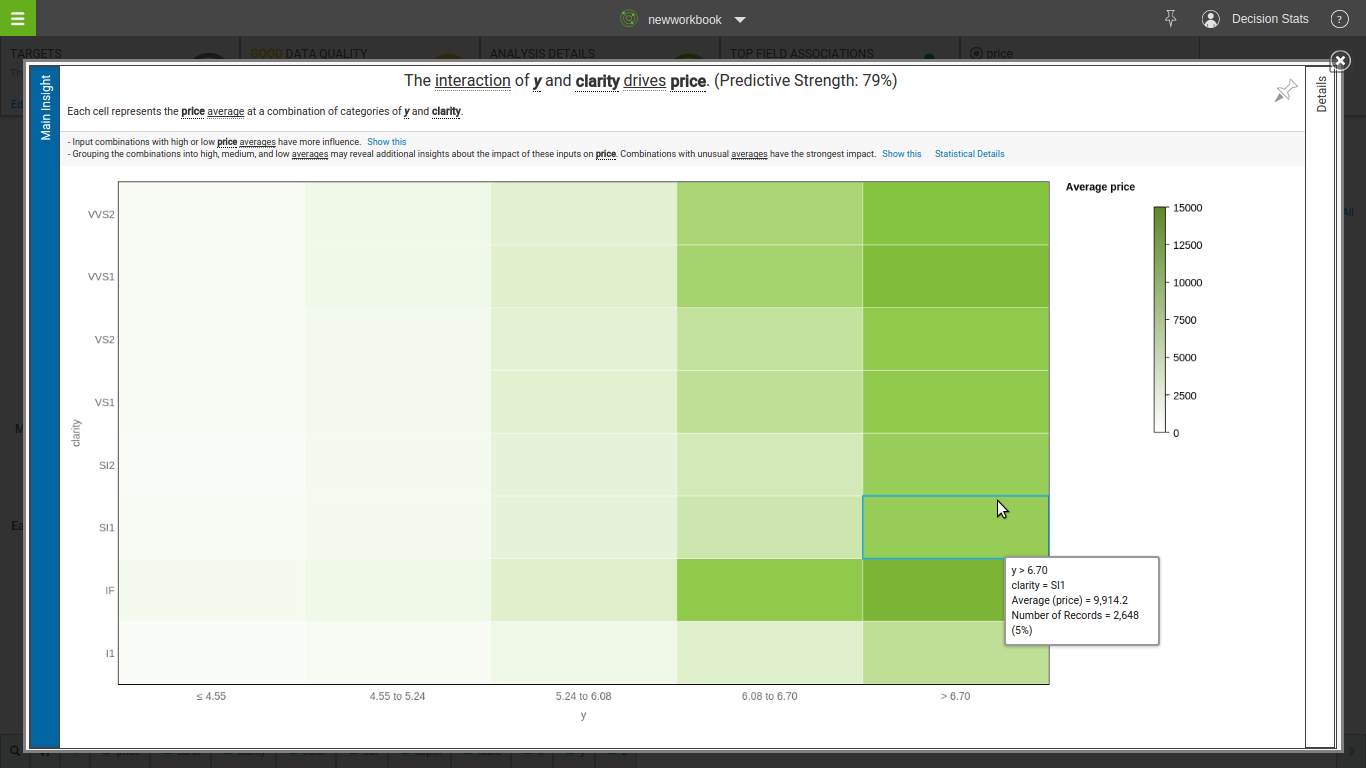
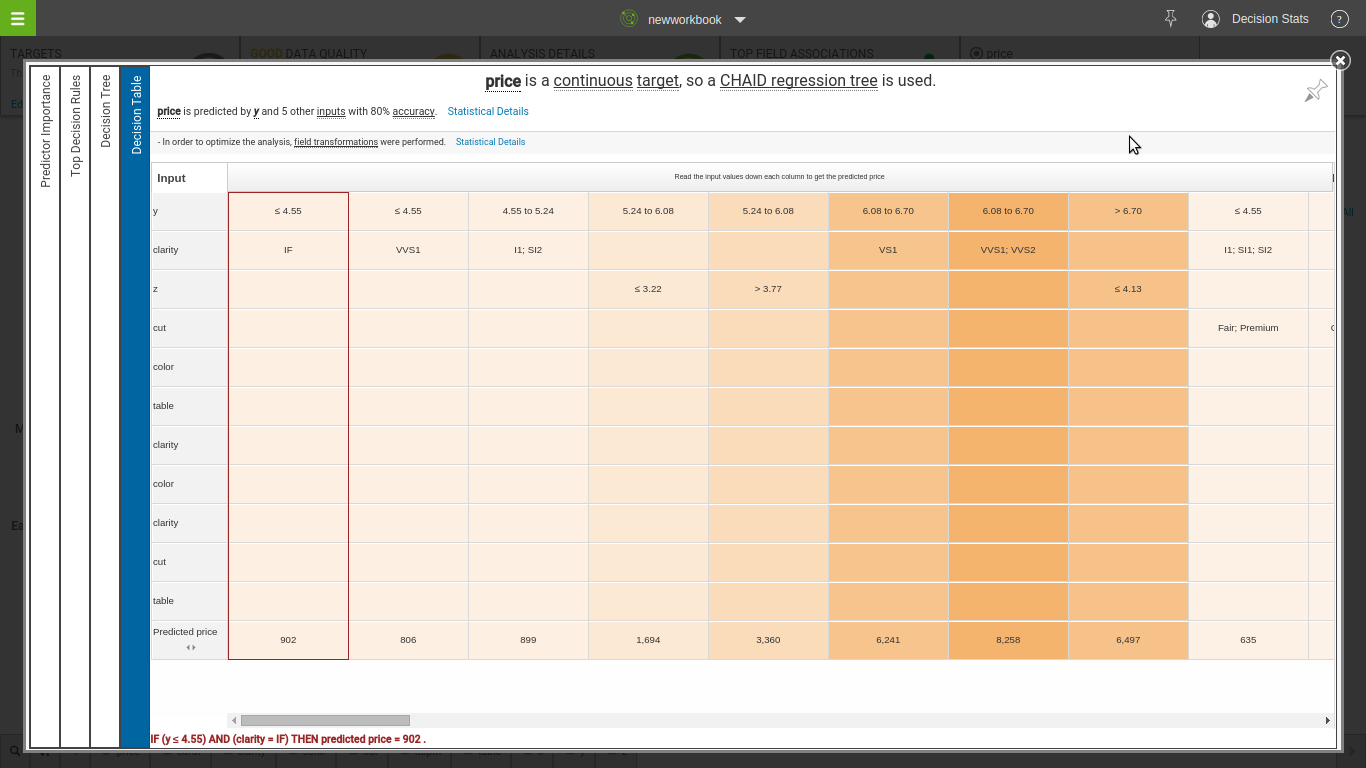
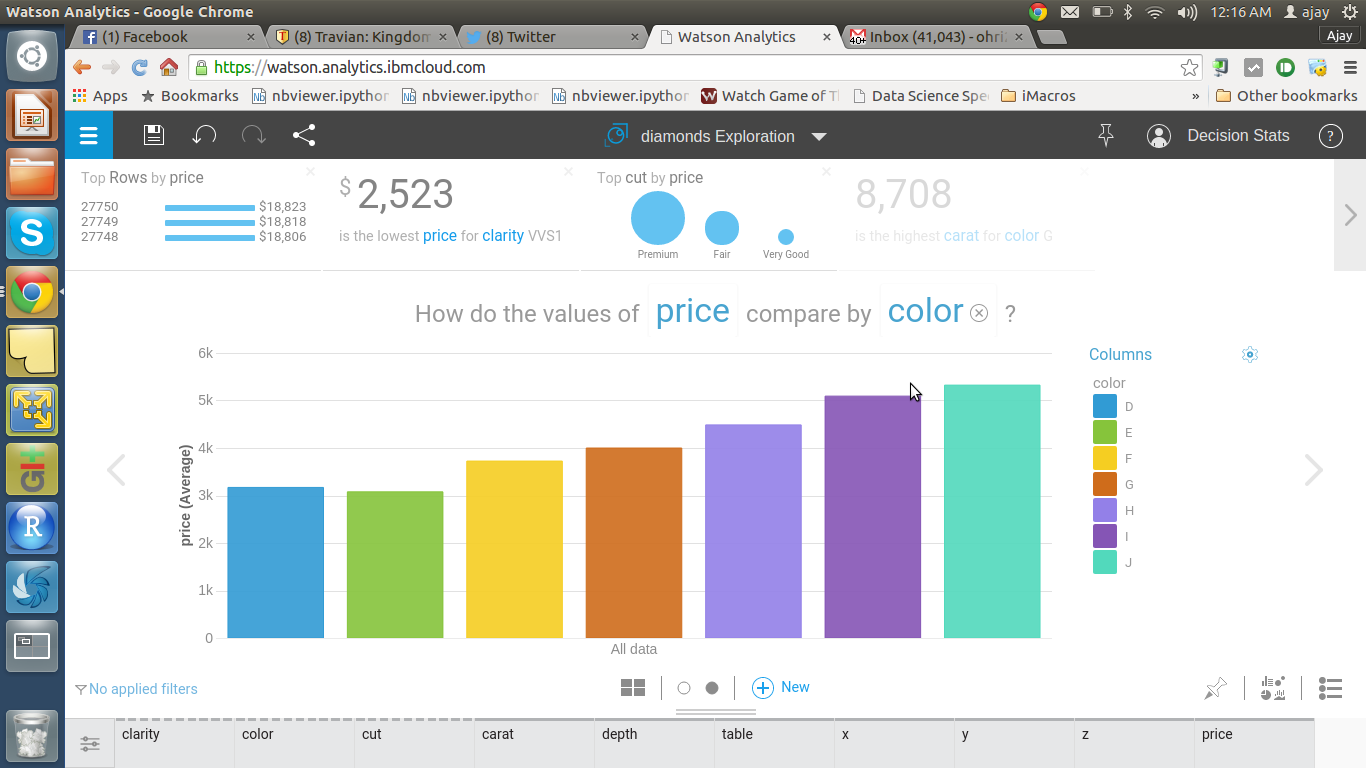
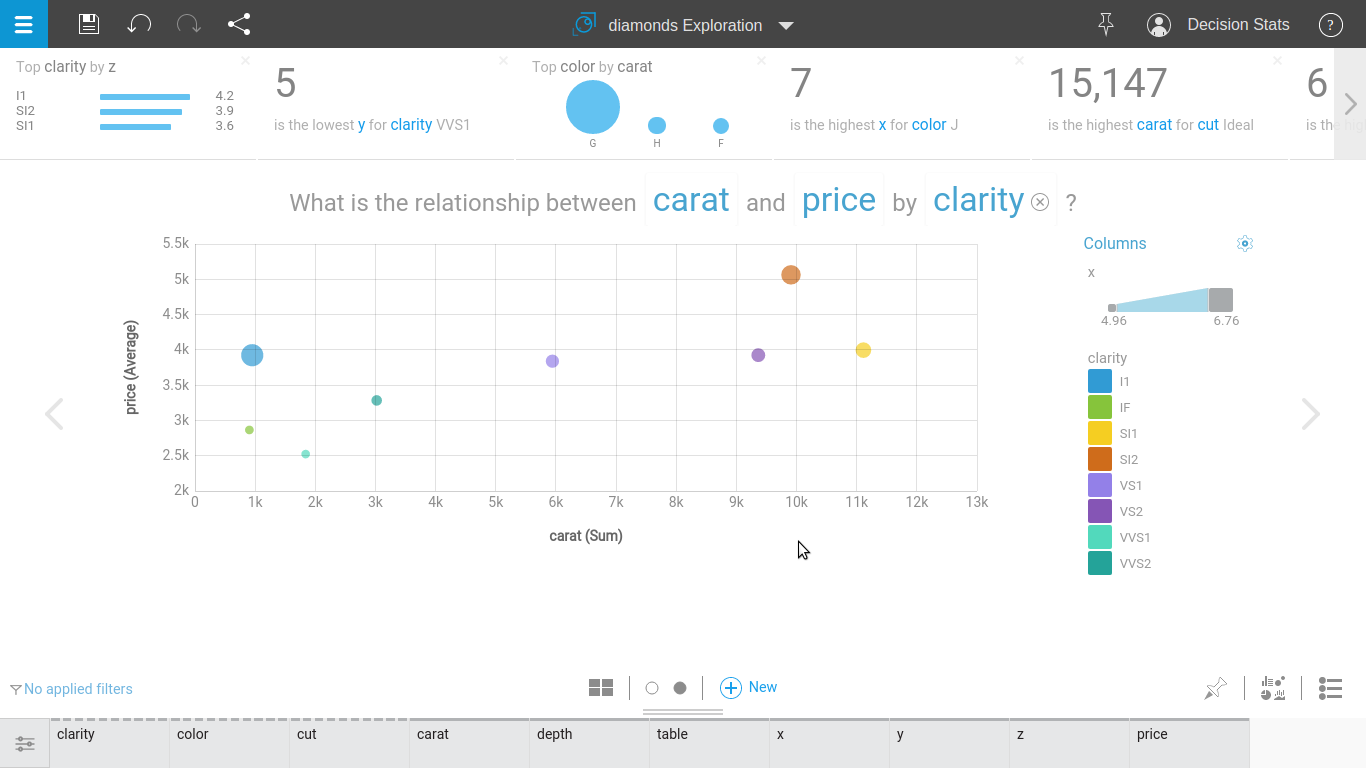
Look at how Watson answers one of these questions
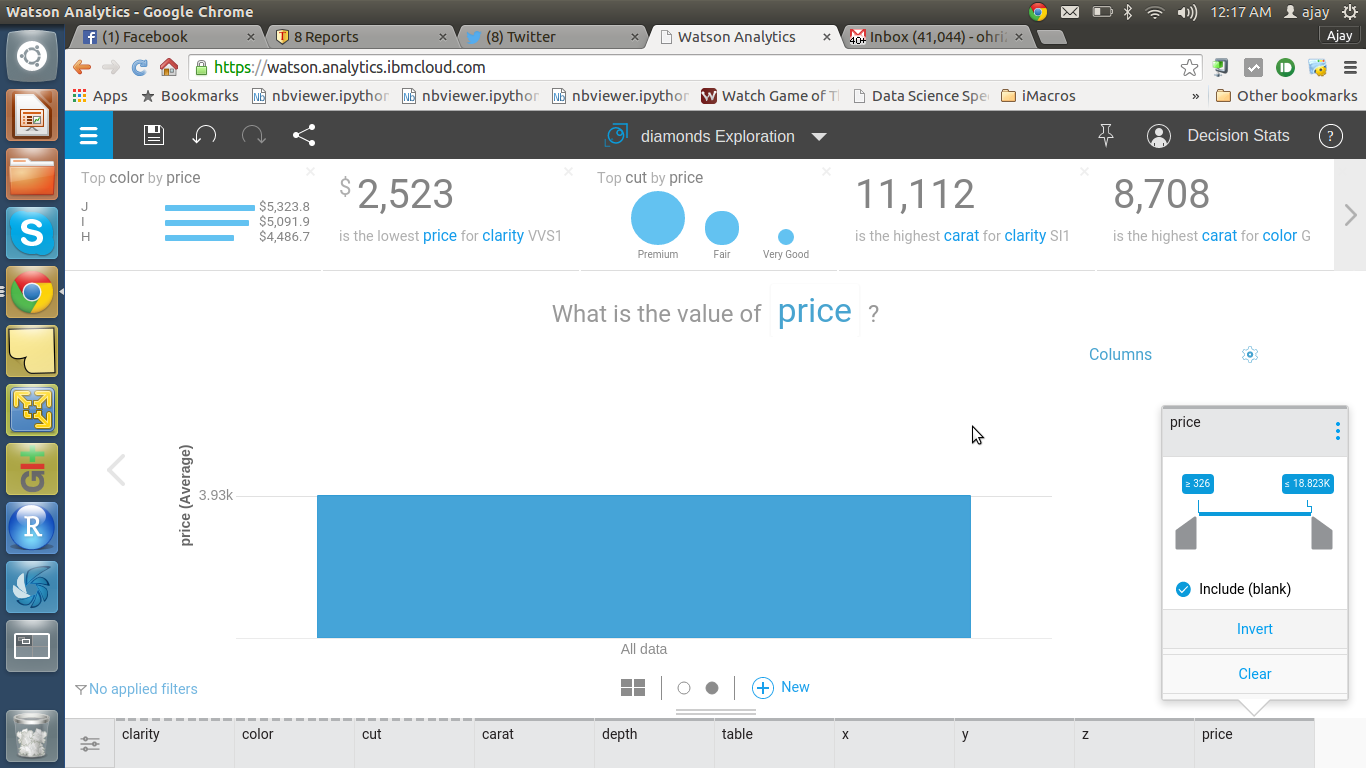
 Step 3
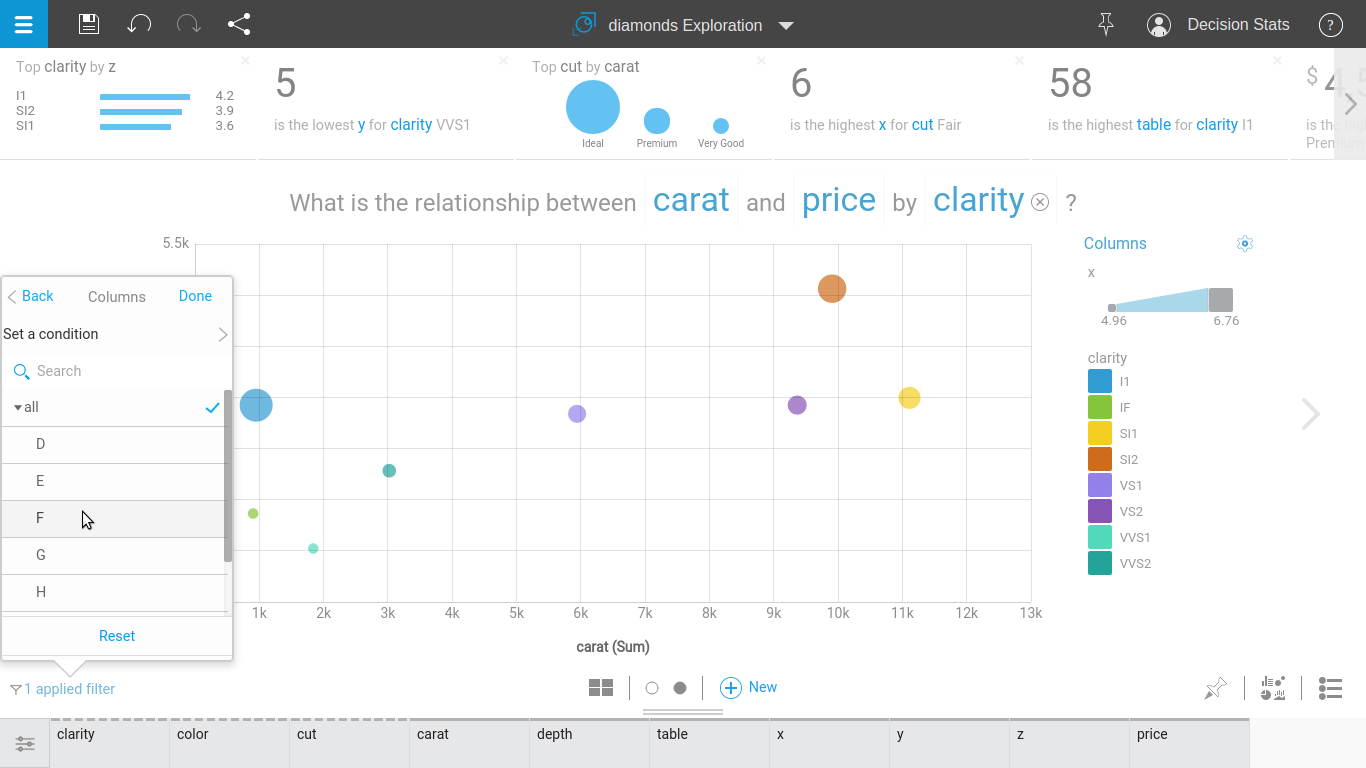
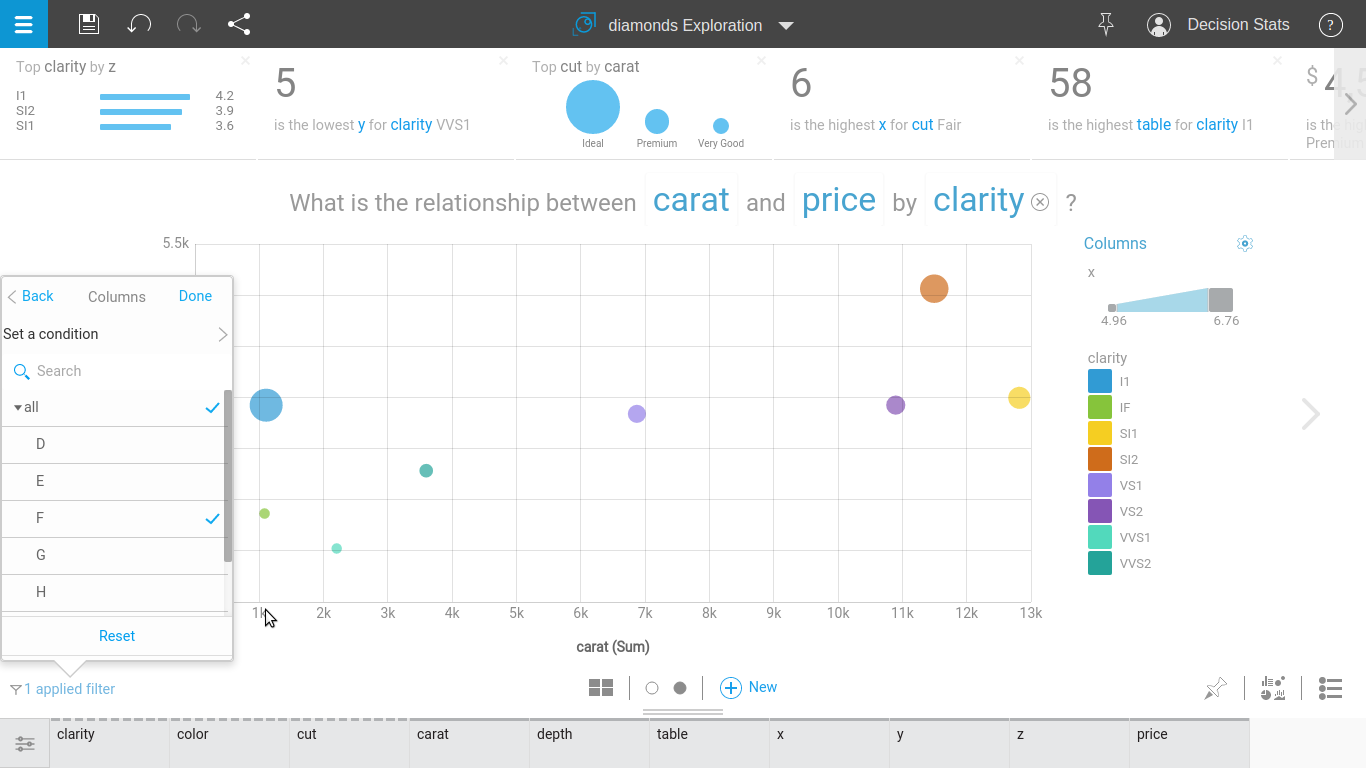
I added human input(me) to try and customize it
I have been chief R Scientist at AnalyticsVidhya ( Vidhya means knowledge in Sanskrit) where I am helping with thoughts, answering questions on discussion forum and writing posts.
Some of the articles I have written there are-
LeaRning Path on R – Step by Step Guide to Learn Data Science on R http://www.analyticsvidhya.com/learning-paths-data-science-business-analytics-business-intelligence-big-data/learning-path-r-data-science/
What I like about AnalyticsVidhya (apart from the 100,000 + page views they now get every month) is they help spread my views to a bigger broader audience and they also partner with me in helping create better posts through both active editorial suggestions and graphic design inputs.
Now helping spread analytics and getting paid for that- truly I am blessed and living the dream!
I was recently interviewed by Bigstep as part of their Expert Interview program. Click here to read the interview and let me know what you think!
