- Pkg.add(“RDatasets ”) installs package RDatasets
- using RDatasets –loads package RDatasets
- Pkg.update() Updates all packages
some packages to install IJulia, RDatasets, PyCall,PyPlot,Gadfly,Rif
- Data Input -pwd() – Gets you the current working directory
- cd(“C:/Path”) -Sets the working directory to the new path , here C:/Path
- readdir() – Lists all the files present in the current working directory
- using DataFrames
a=readtable(“1.csv”)
or df=readtable(“adult.data.txt”,header=false)
or
df= collect(readdlm(“adult.csv”))
or from package
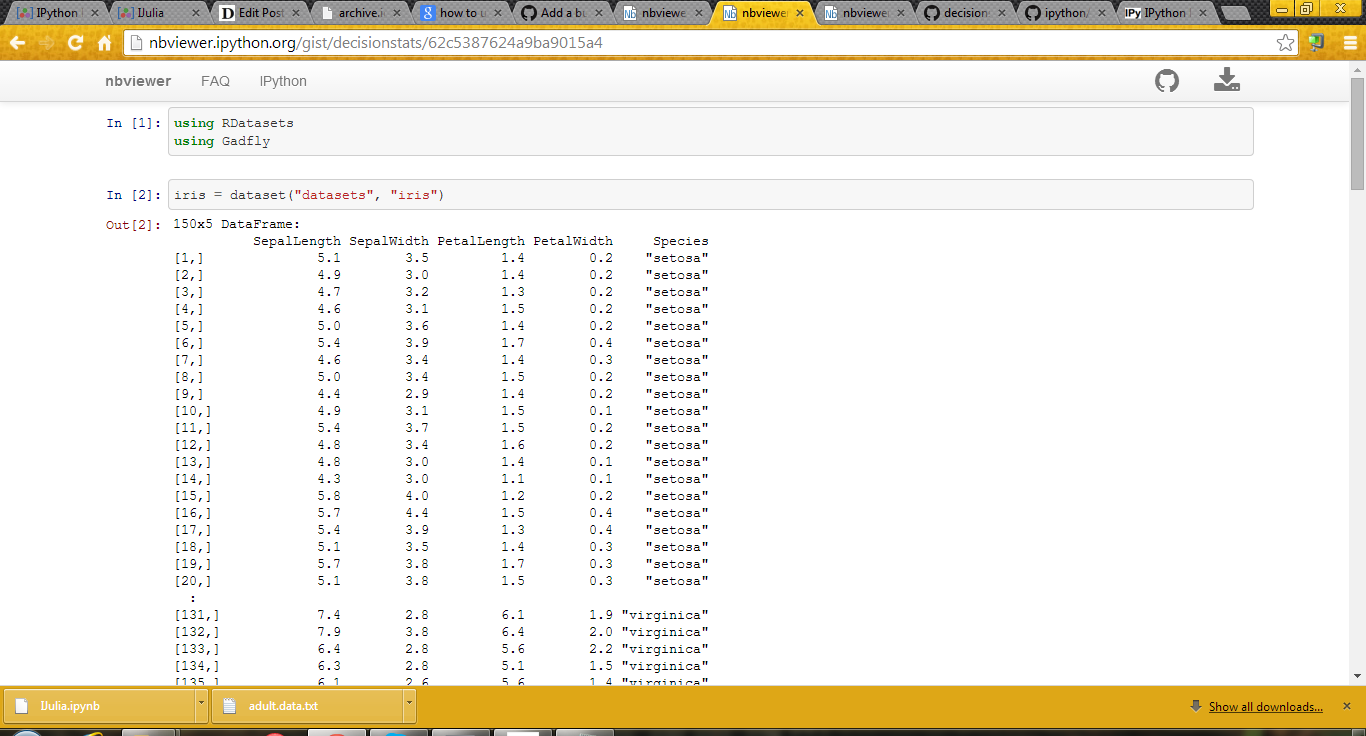
Using RDatasets
iris=dataset(“datasets”,”iris”)
- summary(a) Gives the structure of object named including class, dimensions,
- colnames(a) Gives the names of variables of the object
- typeof(a) Gives the class of a object like data.frame, list,matrix, vector etc
size(a) Givesthe dimension of object (rows column)
Plots
using Gadfly
plot(df,x=”x1″ ,color=”x15″,Geom.histogram)
plot(iris,x=”SepalLength”,y=”SepalWidth”,color=”Species”)
using PyPlot
boxplot(df[:x15])
Note- we can use df[:x15] notation to refer to x15 variable in Data Frame df
For missing values we use Data Arrays and @data to convert object to Data Array
Then use removeNA ( or dropna in Julia 0.3) to remove missing values so as to run functions like mean etc
The describe function gives the numerical summary
Min      17.0
1st Qu.  28.0
Median   37.0
Mean     38.58164675532078
3rd Qu.  48.0
Max      90.0
NAs      0
NA%      0.0%
NOTES-
1) Doesnt work very well on Win 32
2) Two interfaces – command line or IJulia Notebook
3) If you type an object name , gives you the first twenty and last twenty rows- which is quite intuitive designed.
4) PyCall is an interface to Python and Rif is an interface to R- but I had issues trying to work with Rif
5) Basically even simple things( functions!) are renamed in Julia- the effort seems to keep it distinct with R
6) PyPlot for basic plots and Gadfly for ggplot2 plots
Note- some of it was shown here-Updated
http://nbviewer.ipython.org/gist/decisionstats/62c5387624a9ba9015a4
28.635308
77.224960