
Assign Names to Objects Based on Names of Files in a Directory using R for a large number of input csv files
Month: December 2013
Geeks for Privacy: Play Color Cipher and Visual Cryptography
Maybe the guys in Anonymous or Wikileaks can now use visual cryptography while using Snapchat to fool the NSA or CIA
Personally I think a browser with inbuilt backdoors to Tor Relays and data transfer by Bit Torrrents could be worthy a project too.
Quit the bullshit, Google- you are as evil as The Russian Communist Empire
I was just reading up on my weekly to-read list and came across this interesting method. It is called Play Color Cipher-
Each Character ( Capital, Small letters, Numbers (0-9), Symbols on the keyboard ) in the plain text is substituted with a color block from the available 18 Decillions of colors in the world [11][12][13] and at the receiving end the cipher text block (in color) is decrypted in to plain text block. It overcomes the problems like “Meet in the middle attack, Birthday attack and Brute force attacks [1]”.
It also reduces the size of the plain text when it is encrypted in to cipher text by 4 times, with out any loss of content. Cipher text occupies very less buffer space; hence transmitting through channel is very fast. With this the transportation cost through channel comes down.


Reference-
http://www.ijcaonline.org/journal/number28/pxc387832.pdf
Visual Cryptography is indeed an interesting topic-
Visual cryptography, an emerging cryptography technology, uses the characteristics of human vision to decrypt encrypted
images. It needs neither cryptography knowledge nor complex computation. For security concerns, it also ensures that hackers
cannot perceive any clues about a secret image from individual cover images. Since Naor and Shamir proposed the basic
model of visual cryptography, researchers have published many related studies.


Visual cryptography (VC) schemes hide the secret image into two or more images which are called
shares. The secret image can be recovered simply by stacking the shares together without any complex
computation involved. The shares are very safe because separately they reveal nothing about the secret image.

Visual Cryptography provides one of the secure ways to transfer images on the Internet. The advantage
of visual cryptography is that it exploits human eyes to decrypt secret images .
ESPECIALLY SEE |THIS AND THIS
http://cacr.uwaterloo.ca/~dstinson/VCS-flag.html
and
http://cacr.uwaterloo.ca/~dstinson/VCS-pi.html
Even more fun—– visual cryptography using a series of bar codes – leaving the man in middle guessing how many sub images are there and which if at all is the real message


![]()
References-
Color Visual Cryptography Scheme Using Meaningful Shares
http://csis.bits-pilani.ac.in/faculty/murali/netsec-10/seminar/refs/muralikrishna4.pdf
Visual cryptography for color images
http://csis.bits-pilani.ac.in/faculty/murali/netsec-10/seminar/refs/muralikrishna3.pdf
Other Resources
- http://users.telenet.be/d.rijmenants/en/visualcrypto.htm
- Visual Crypto – One-time Image Create two secure images from one by Robert Hansen
- Visual Crypto Java Applet at the University of Regensburg
- Visual Cryptography Kit Software to create image layers
- On-line Visual Crypto Applet by Leemon Baird
- Extended Visual Cryptography (pdf) by Mizuho Nakajima and Yasushi Yamaguchi
- Visual Cryptography Paper by Moni Noar and Adi Shamir
- Visual Crypto Talk (pdf) by Frederik Vercauteren ESAT Leuven
- http://cacr.uwaterloo.ca/~dstinson/visual.html
- t the University of Salerno web page on visual cryptogrpahy.
- Visual Crypto Page by Doug Stinson
Constructions and Bounds for Visual Cryptography
Lecture Notes in Computer Science 1099 (1996), 416-428 (23rd International Colloquium on Automata, Languages and Programming).- Visual Cryptography for General Access Structures
Information and Computation 129 (1996), 86-106 (this paper is an expanded and revised version of the conference paper). - On the Contrast in Visual Cryptography Schemes
Journal of Cryptology 12 (1999), 261-289. - Extended Schemes for Visual Cryptography
Theoretical Computer Science 250 (2001), 143-161. - Threshold Visual Cryptography Schemes With Specified Whiteness Levels of Reconstructed Pixels
Designs, Codes and Cryptography 25 (2002), 15-61. - Contrast Optimal Threshold Visual Cryptography Schemes
SIAM J. on Discrete Math. 16 (2003), 224-261. - “Visual Cryptography: Seeing is Believing” availablehere,
- example- face http://cacr.uwaterloo.ca/~dstinson/VCS-happyface.html
- flag http://cacr.uwaterloo.ca/~dstinson/VCS-flag.html
- pi http://cacr.uwaterloo.ca/~dstinson/VCS-pi.html
- Simple implementation of the visual cryptography scheme based on Moni Naor and Adi Shamir, Visual Cryptography, EUROCRYPT 1994, pp1–12. This technique allows visual information like pictures to be encrypted so that decryption can be done visually.The code outputs two files. Try printing them on two separate transparencies and putting them one on top of the other to see the hidden message. http://algorito.com/algorithm/visual-cryptography
Visual Cryptography
- Moni Naor and Adi Shamir, Visual Cryptography , Eurocrypt 94. Postscript , gzipped Postscript
- Moni Naor and Adi Shamir, Visual Cryptography II , Cambridge Workshop on Protocols, 1996. Postscript, gzipped Postscript
- Moni Naor and Benny Pinkas, Visual Authentication , Crypto 97. Postscript, gzipped Postscript
—
Ajay- I think a combination of sharing and color ciphers would prove more helpful to secure Internet Communication than existing algorithms. It also levels the playing field from computationally rich players to creative coders.
#Rstats continues its march in data mining
From the famous KARL REXER ANNUAL DATA MINING SURVEY
—
HIGHLIGHTS from the 2013 Data Miner Survey:
- SURVEY & PARTICIPANTS: 68-item survey conducted online in 2013. Participants: 1,259 analytic professionals from 75 countries. This is the 6th Data Miner Survey.
- FOCUS ON CRM: In the past few years, there has been an increase among data miners in the already substantial area of customer-focused analytics. Respondents are looking for a better understanding of customers and seeking to improve the customer experience. This can be seen in their goals, analyses, big data endeavors, and in the focus of their text mining.
- BIG DATA: Many in the field are talking about the phenomena of Big Data. There are clearly some areas in which the volume and sources of data have grown. However it is unclear how much Big Data has impacted the typical data miner. While data miners believe that the size of their datasets have increased over the past year, data from previous surveys indicate that the size of datasets have been fairly consistent over time.
- THE ASCENDANCE OF R: The proportion of data miners using R is rapidly growing, and since 2010, R has been the most-used data mining tool. While R is frequently used along with other tools, an increasing number of data miners also select R as their primary tool.
- CHALLENGES IN THE USE OF ANALYTICS: Data miners continue to report challenges at each level of the analytic process. Companies often are not using analytics to their fullest and have continuing issues in the areas of deployment and performance measurement.
- ENGAGEMENT & JOB SATISFACTION: The Data Miners in our survey are highly engaged with the analytic community: consuming and producing content, entering competitions and searching for education and growth within their jobs. All of these activities lead to high job satisfaction, which has been increasing over time.
- ANALYTIC SOFTWARE: Data miners are a diverse group who are looking for different things from their data mining tools. Ease-of-use and cost are two distinguishing dimensions. Software packages vary in their strengths and features. STATISTICA, KNIME, SAS JMP and IBM SPSS Modeler all receive high satisfaction ratings.
- OTHER FINDINGS include the labels analytic professionals use to describe themselves (Data Scientist is #1), the algorithms being used (regression, decision trees, and cluster analysis continue to be the triad of core algorithms), and computing environments (cloud computing is increasing).
Teaching R in India #rstats $323 for 6 week course
I submitted a poster to User2013 that was accepted on Teaching R in India- but I could not attend since I was in Canada visiting family at that time
These were some of the experiences I wanted to talk about- but I think I will elaborate on them later
Anyways- I have been able to design a SECOND R course in Bangalore for Edureka-
What happened to the FIRST course I designed in India. Enough said!
But Edureka were different and they work mostly with open source like teaching Hadoop, Android, Cassandra and R- and they are truly world class in their ways (except video editing and websites and social media blogs )
Edureka has worked much more honestly with both students and instructors. I was also able to convince them of the value of limited open access by giving some slides and videos free .
here is the slides for the first class.
The landing page is at
By pricing a 6 week, 24 hour course using Go2Meeting at just $323 ———-

What we are trying to do is disrupt the market for training in two ways-
1) Give better customization and instructor attention than the MOOCs
2) Avoid obscenely expensive workshops priced above 900$ per 8 hours etc…. from corporates.
The youtube video has got almost 6338 views and the model works best for developing countries like India for spreading R (though we do have an occasional overseas student ). We are currently updating the quality of the video even more as we collect automated response at end of each 2 hour class.
All slides and all videos are made free to download forever to the student.
Got 323$ to learn R in six weeks? Sign up here http://www.edureka.in/r-for-analytics
New Delhi R Users Group- Noida Chapter Begins
I founded the New Delhi R Users group almost a year ago. It now has 183 members, and we recently held our first Noida Chapter meeting ( Delhi is a huge area, with Noida and Gurgaon as two adjoining suburban hubs). The response was terrific many people attended. 
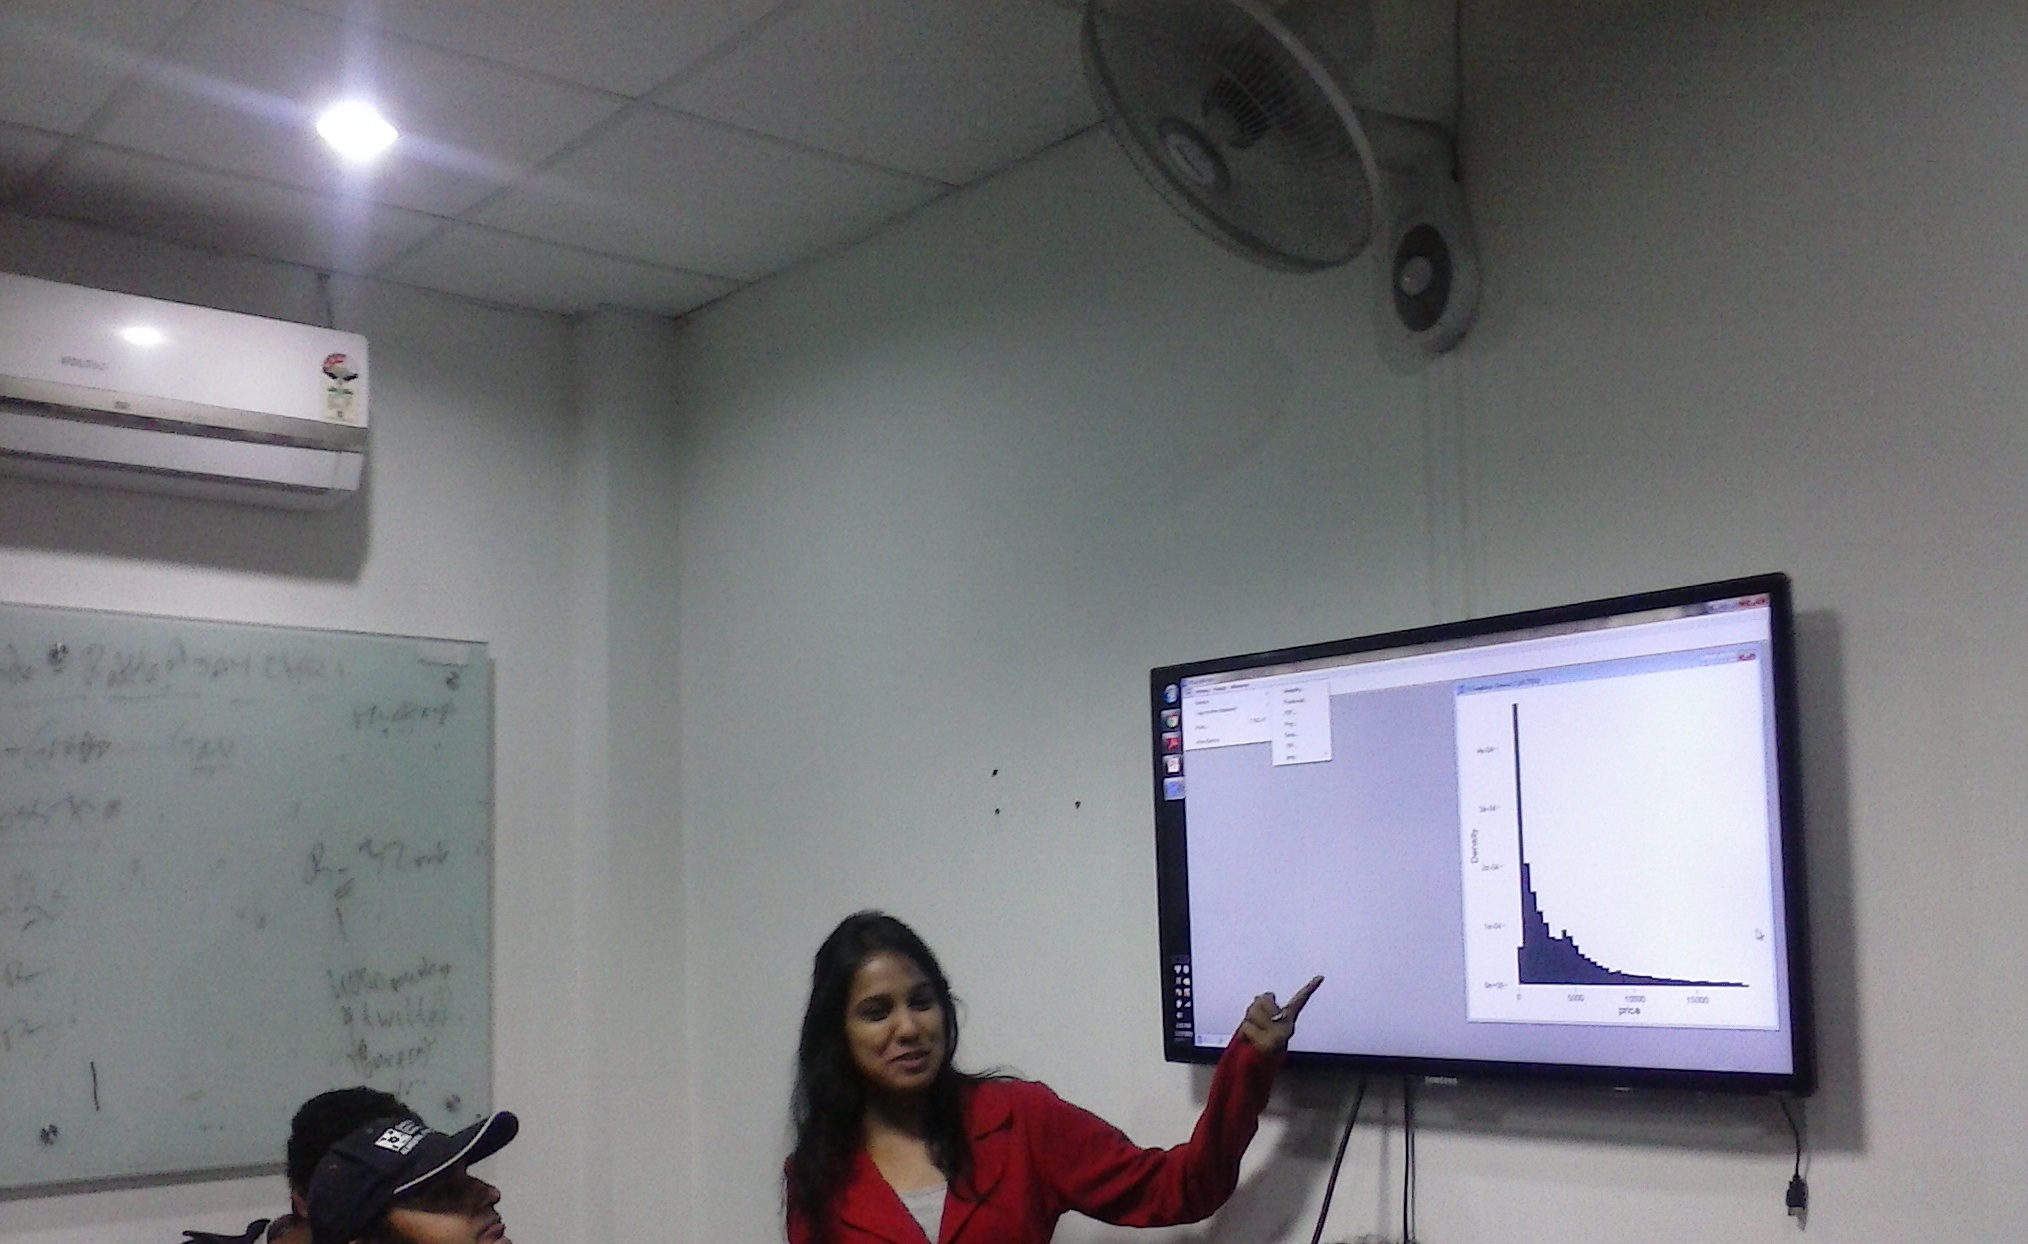
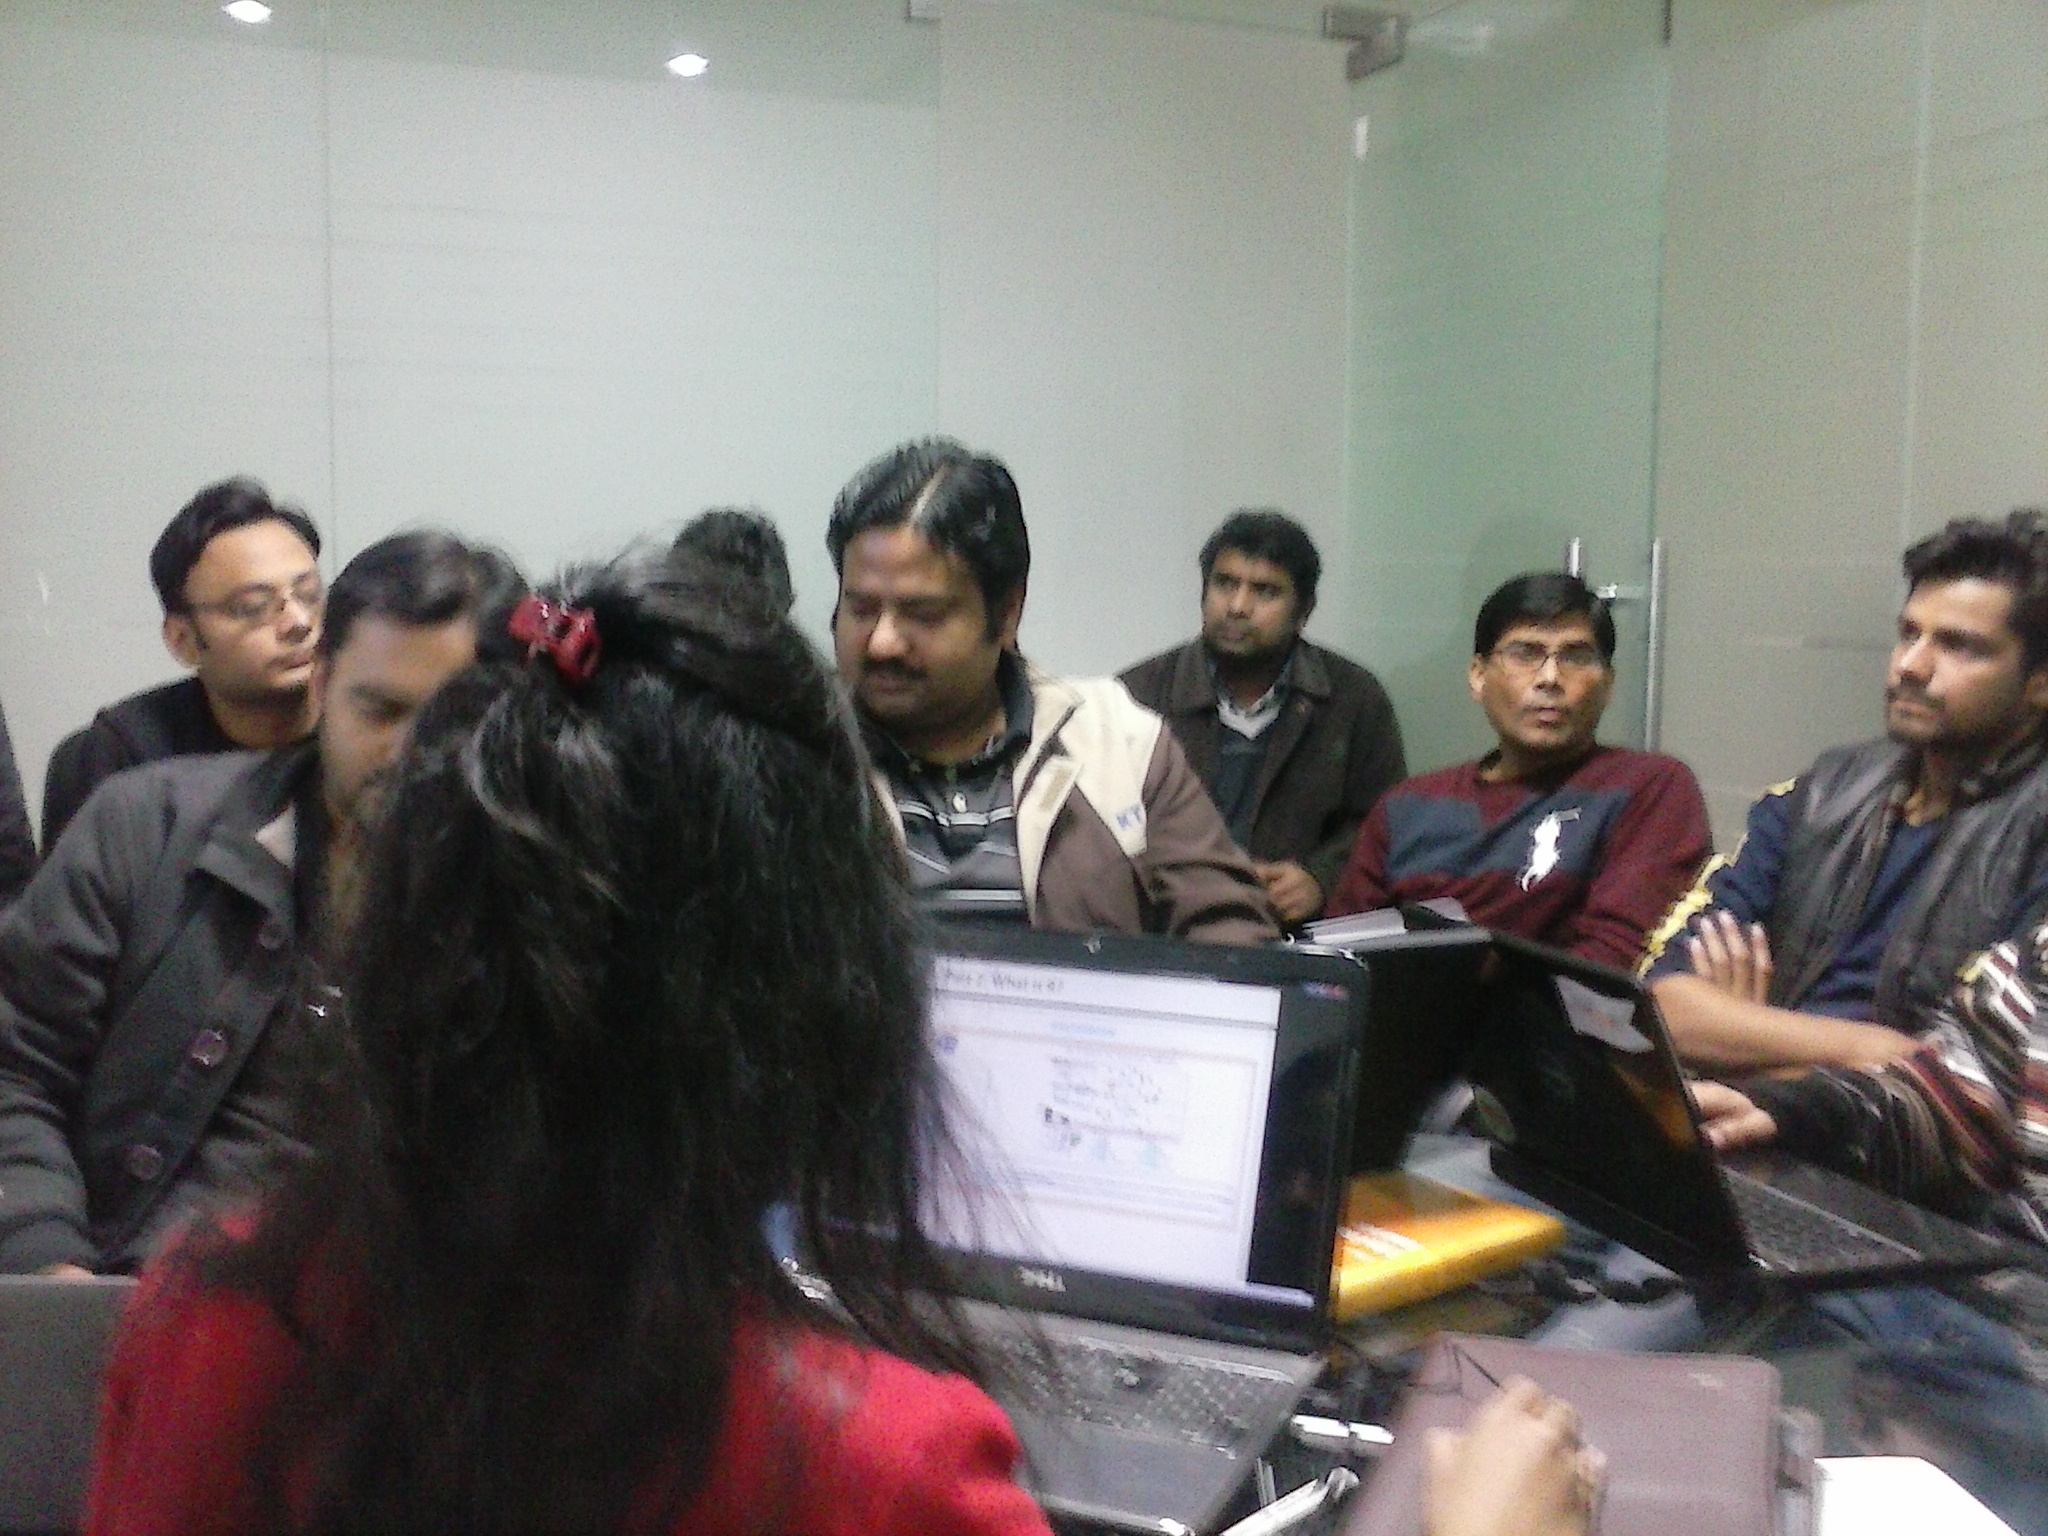
The sessions were divided in two- for beginners and advanced users
This was the agenda
We invite you on the R learning session at Apsidata Solutions on 7th Dec 2013 from 2:30PM-5:00PM.
Our purpose is to cover up the basics of R and its current market and business scope.
We have divided the session in 2 parts-
(PART – I) Introduction and basics graphs of R (by Su from 2:30PM – 3:30PM)
· Basic Introduction
· Introduction of Statistical Analysis
· Installation of R
· What is Package and how to install and use it.
· R-commander
· Importing Data in R
· Hands-on inbuilt functions
· Graphs
Half an hour break for discussion and queries (from 3:30PM -4:00PM)
(PART – II) – What’s new in R and its market (by Ajay Ohri from 4:00PM – 5:00PM)
· Rattle-Data mining
· R-Studio Sever
· R-Fiddle
· Statace
First part for beginners was taken by Su, my student from Edureka
These were the slides
Part 1
Part 2
Overall, we trying hard to develop the R ecosystem in a Microsoft ruled country 🙂
Mathematical .Gifs
Credit- Wikipedia and Google Plus Maths Community
https://plus.google.com/u/0/communities/100568607954673744130
Click on .gif for seeing motion esp if from mobile or on low bandwidth
Mobius

The road to Carnegie Hall

Illusion- Each of the dots are actually moving in straight line -Also used for Christmas Lights

Sine and Cosine

Tesseracts (not from Asgard)


Toruses


Pythagoras Theorem- Greek Math

Dodecahedron

Villarceau_circles

Hypotrochoid

Simple Way to Teach Pi

Monte Carlo to Estimate Pi
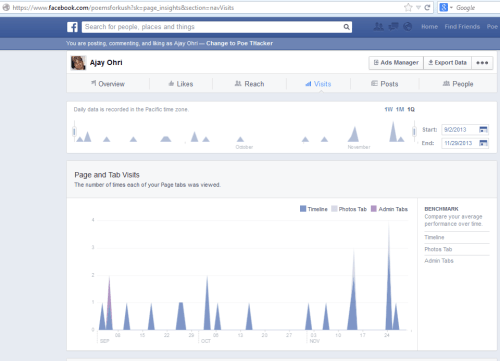
Top Fourteen Interfaces in Social Media and Web Analytics on the Internet
Gurus like this and this should me but I think something is rotten in the state of analytics data visualizations on the web.
- Facebook Page Insights- Cool Viz- Blue Line Graphs
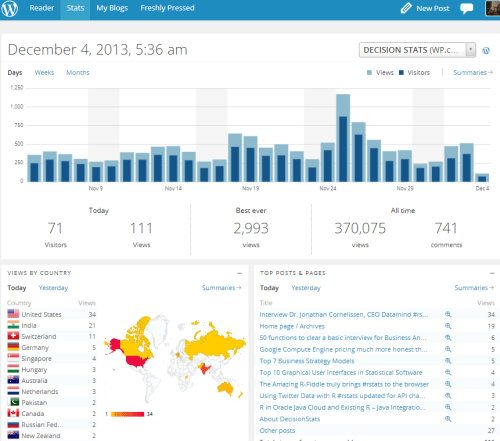
- WordPress prefers bar plots and spatial analysis (if only minimal)
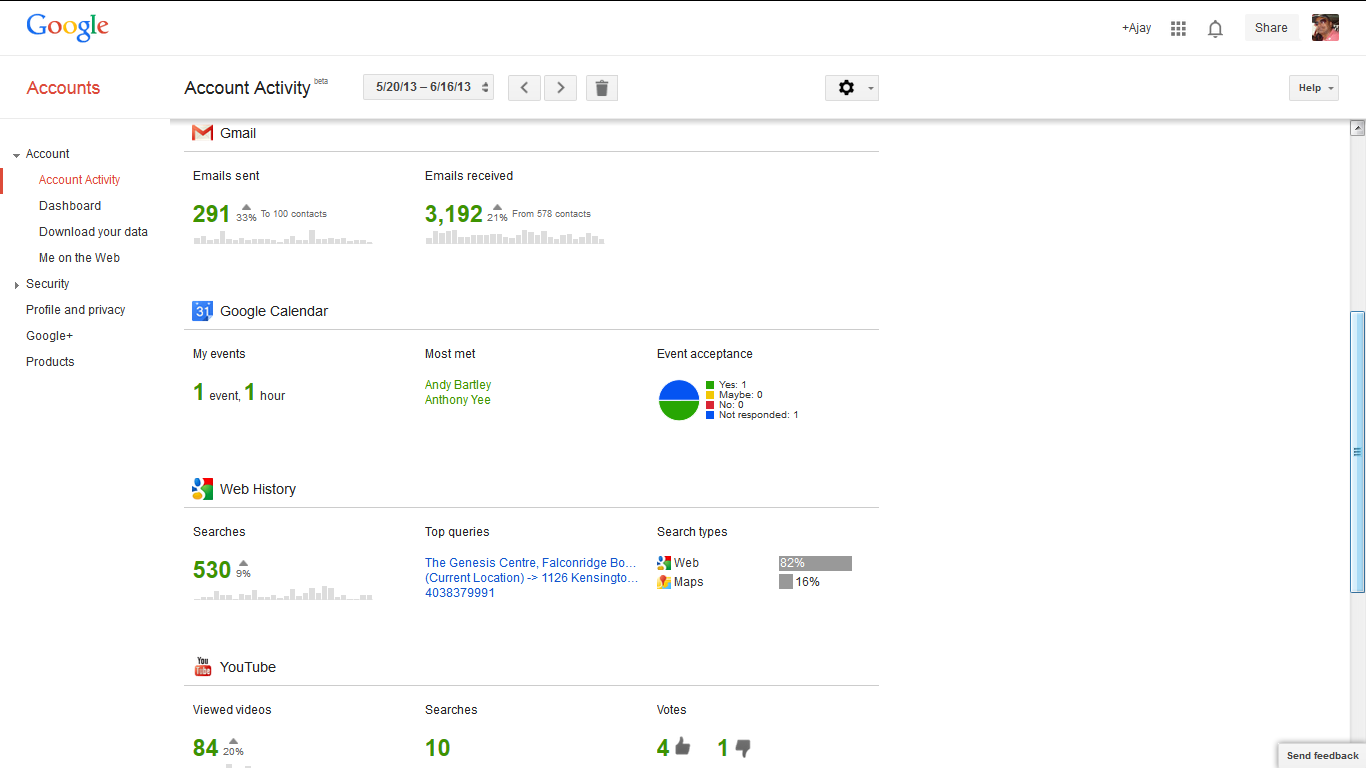
- Google Activity Dashboard prefers Tufte (?) . No it just shows fonts, and even a (gasp) pie chart.

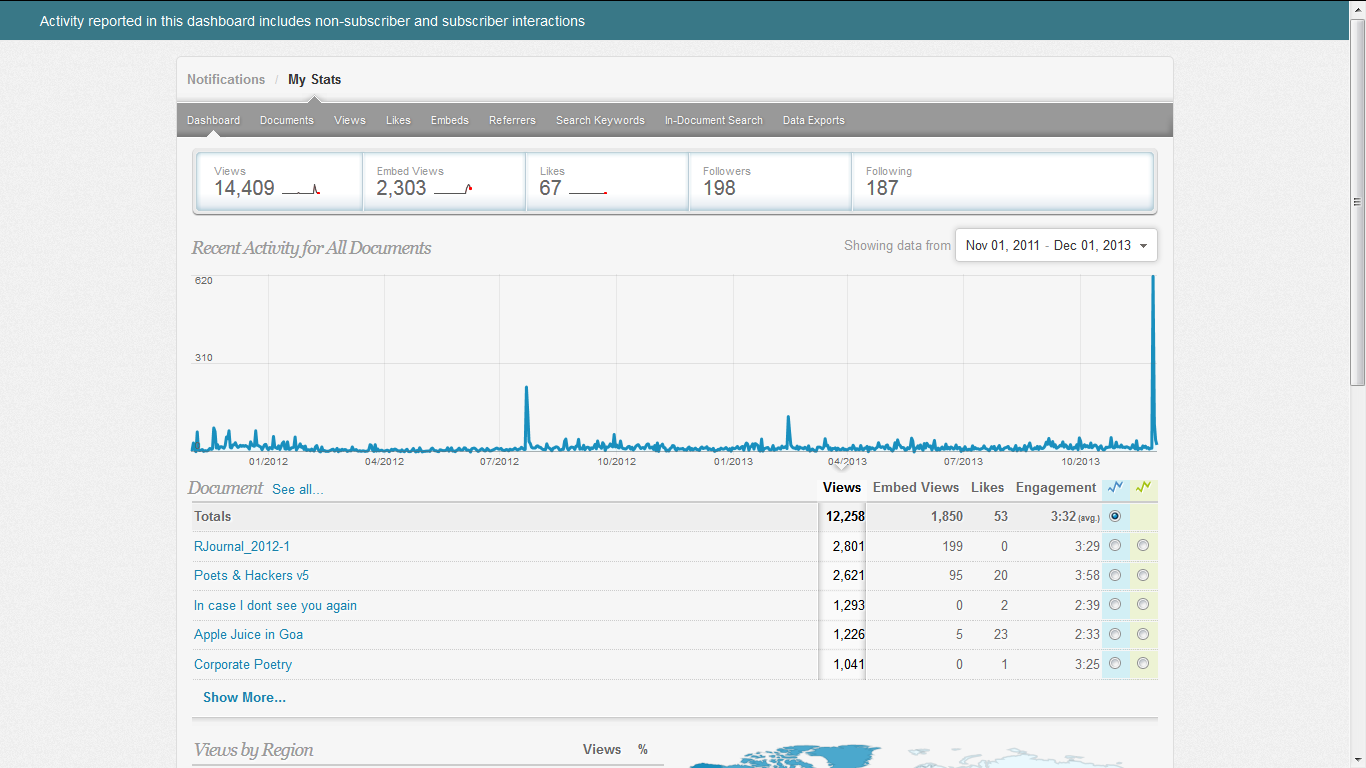
- Scribd prefers —yes tables and line graphs rule

- Slideshare Stats are a pro feature (!) . Free features are a table– sigh

- LinkedIn – was a pioneer but now


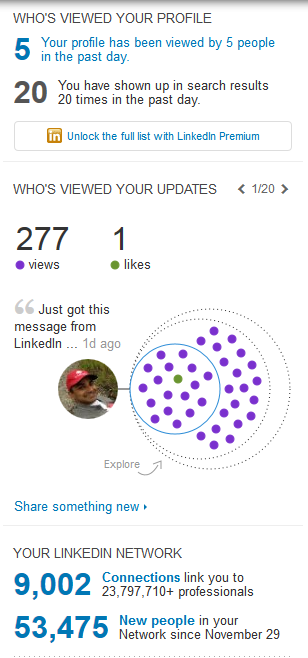
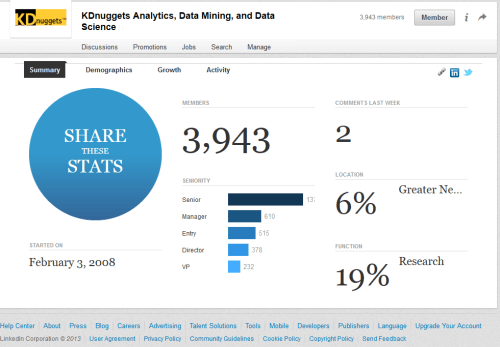
- Linkedin Groups viz
- Quora Stats – hmm

- My Anti Virus still likes doughnuts

- OFFICIAL Twitter Analytics


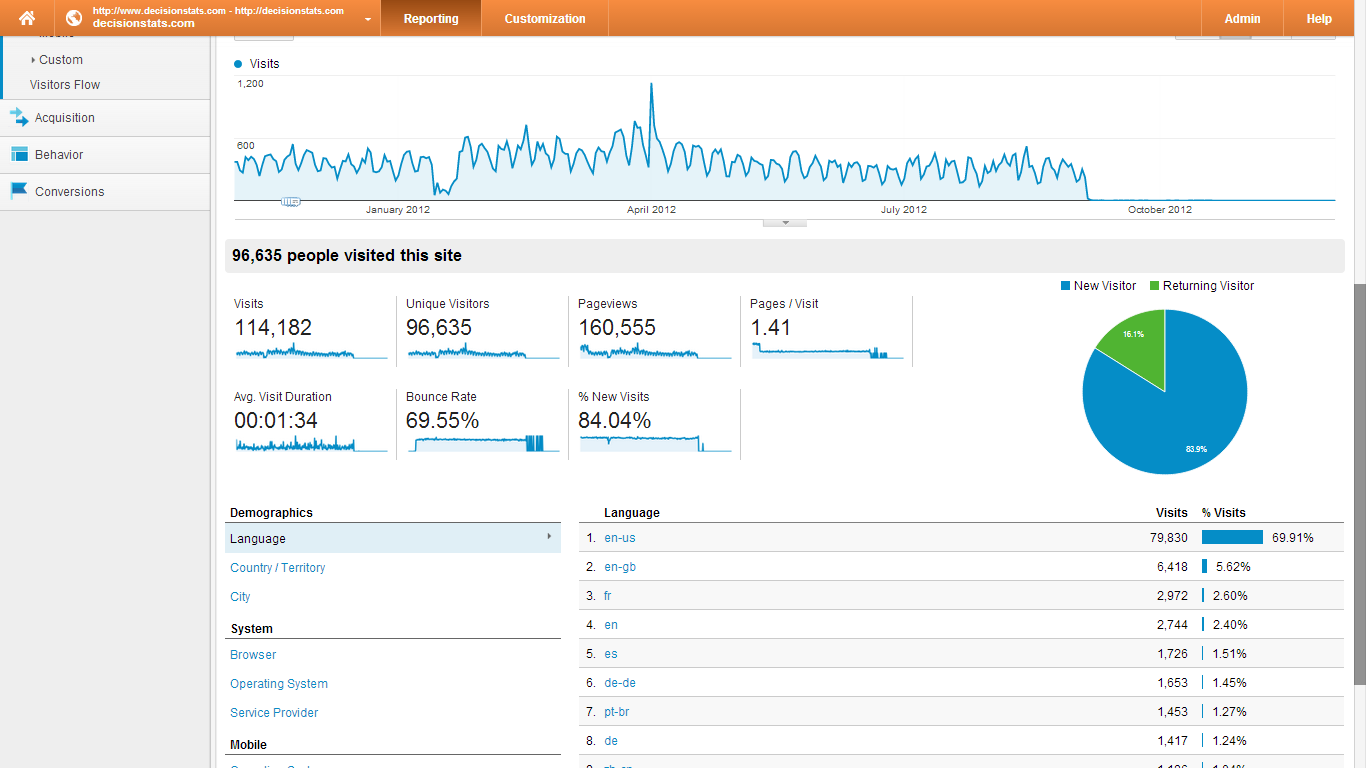
- Google Analytics – a synonym for data vizualization on the web has Napolean March Chart ambitions but fails to simplify beyond the simple and fails totally at the complex .
- That’s a pie chart, bitches!
- There is no data that can be displayed in a pie chart, that cannot be displayed BETTER in some other type of chart.” John Tukey


