Algorithms are everywhere

What  is an algorithm anyway?

main-qimg-1f91f9a242623e7994e7484970581d83

As per Wikipedia- http://en.wikipedia.org/wiki/Algorithm

an algorithm  is a step-by-step procedure for calculations. Algorithms are used for calculation, data processing, and automated reasoning.

An algorithm is an effective method expressed as a finite list of well-defined instructions  for calculating a function.  Starting from an initial state and initial input (perhaps empty),  the instructions describe a computation that, when executed, proceeds through a finite  number of well-defined successive states, eventually producing “output” and terminating at a final ending state. The transition from one state to the next is not necessarily deterministic; some algorithms, known as randomized algorithms, incorporate random input

Where do I hear the word algorithm being used?  Or the wat er cooler version- algols

I hear it everywhere- in newspapers  especially GUARDIAN and NEW YORK TIMES  

From search to security: the five most important algorithms in tech

  1. Pagerank – how Google calculates search results
  2. Public key cryptography – keeping credit card data secure
  3. Correcting errors (in CDs)
  4. Protecting passwords (cryptographic hash function)
  5. Perlin noise: generating landscapes in games

In Presentations-

Screenshot from 2013-10-08 10:19:03

But Google NGrams thinks algorithms is flat in books

http://books.google.com/ngrams/graph?content=algorithms&year_start=1990&year_end=2000&corpus=15&smoothing=3&share=

Screenshot from 2013-10-08 10:28:37

and Google Trends think the word is actually declining. But India remains a top user of searching for algorithms Screenshot from 2013-10-08 10:27:03

But algorithms are increasing in ArXiv articles Screenshot from 2013-10-08 10:43:24

and there is a bit of up and down in Algorithms Jobs

What do you think- do you hear the word too much or too little?

Why a shutdown led US default could trigger The Third Opium War

What were  The Opium Wars?

http://en.wikipedia.org/wiki/Opium_Wars

The Opium Wars, also known as the Anglo-Chinese Wars, divided into the First Opium War from 1839 to 1842 and the Second Opium War from 1856 to 1860. These were the climax of disputes over trade and diplomatic relations between China under the Qing Dynasty and the British Empire.

The import of opium into China stood at 200 chests (annual) in 1729,[1] when the first anti-opium edict was promulgated.[2][3] This edict was weakly enforced,[3] and by the time Chinese authorities reissued the prohibition in starker terms in 1799,[4] the figure had leaped; 4,500 chests were imported in the year 1800.[1] The decade of the 1830s witnessed a rapid rise in opium trade,[5] and by 1838 (just before the first Opium War) it climbed to 40,000 chests.[1][5]

Considering that importation of opium into China had been virtually banned by Chinese law, the East India Company established an elaborate trading scheme partially relying on legal markets, and partially leveraging illicit ones. British merchants carrying no opium would buy tea in Canton on credit, and would balance their debts by selling opium at auction in Calcutta. From there, the opium would reach the Chinese coast hidden aboard British ships then smuggled into China by native merchants. In 1797 the company further tightened its grip on the opium trade by enforcing direct trade between opium farmers and the British, and ending the role of Bengali purchasing agents. British exports of opium to China grew from an estimated 15 tons in 1730 to 75 tons in 1773. The product was shipped in over two thousand chests, each containing 140 pounds (64 kg) of opium.[21]

and

British military superiority drew on newly applied technology. British warships wreaked havoc on coastal towns; the steam ship Nemesis was able to move against the winds and tides and support a gun platform with very heavy guns. In addition, the British troops were the first to be armed with modern muskets and cannons, which fired more rapidly and with greater accuracy than the Qing firearms and artillery, though Chinese cannons had been in use since previous dynasties. After the British took Canton, they sailed up the Yangtze and took the tax barges, a devastating blow to the Empire as it slashed the revenue of the imperial court in Beijing to just a fraction of what it had been.

and

Click to access RL34314.pdf

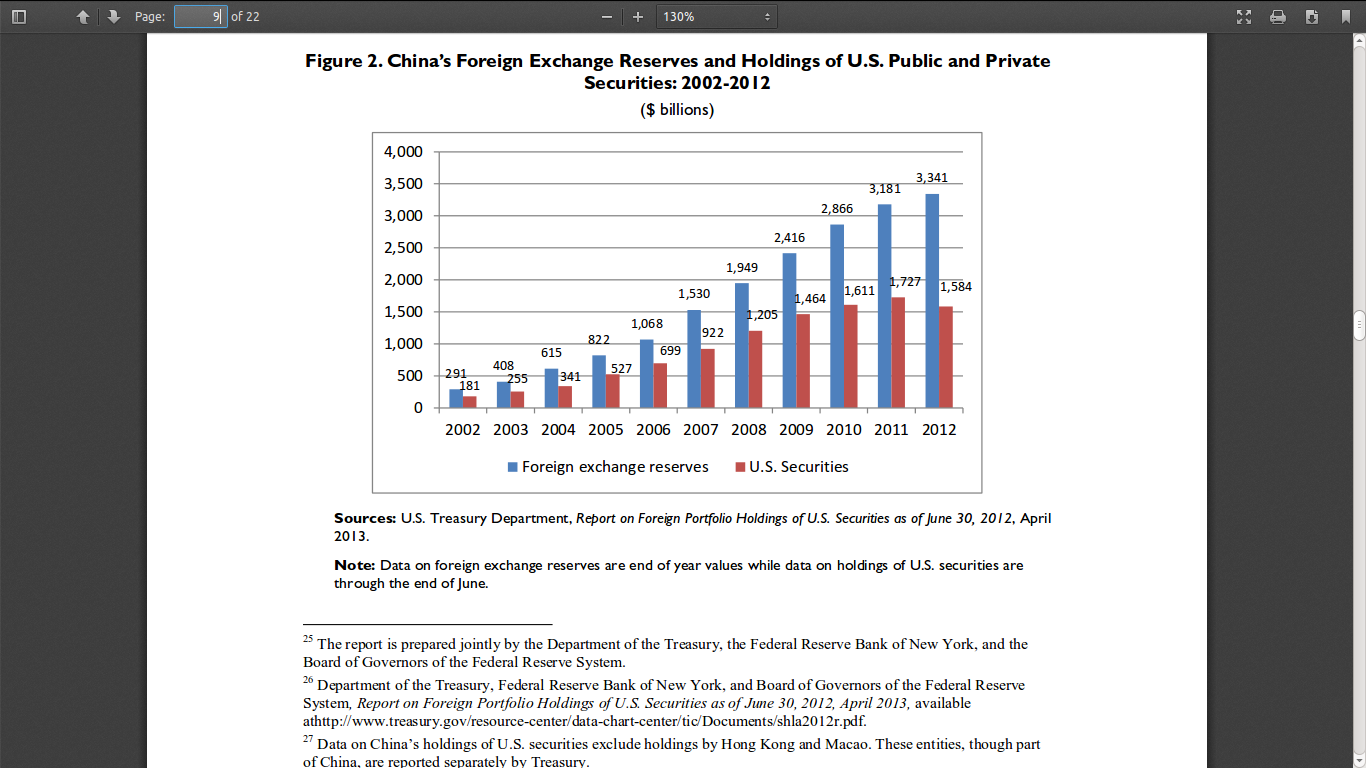
China’s Holdings of U.S. Securities: Implications for the U.S. Economy
Screenshot from 2013-10-08 07:52:20
Notice how Chinese purchases of US Treasury mirror the rise in Opium purchases.
A technical default by US due to internal politics can enhance conflict and stress between China
It offers a great opportunity for the US to virtually cancel the US debt into half, by going into conflict.
The window of opportunity for US military superiority over China is limited- within a decade China would no longer be a generation behind US Aircraft Carriers.
So the US might just make a huge profit because of the shutdown. Still think that Boehner is crazy?
ps- In 1858, about twenty years after the first Opium War, the annual import rose to 70,000 chests (4,480 tons), approximately equivalent to global production of opium for the decade surrounding the year 2000

Ads and Analytics on Twitter is a lovely platform #ads #twitter #ipo #analytics #socialmedia

I really liked the simplicity and design of the Ads Platform in Twitter.

You can visit it here- https://ads.twitter.com

Screenshot from 2013-10-07 12:20:07There are two options- either promote your tweet or promote your account

You pay only if the tweet gets an activity (retweet,favourite,reply,follow) or if you get a new follower.

That is an innovative breakthrough in social  networks marketing.

Now if only Google Plus and LinkedIn network showed more such options- I would love to promote my blog on Google Plus- but I am not sure on the options.

I also like the simple design that Twitter Ads offers. I do think an initial free $5 for some accounts should help kickstart this adaptation in a much bigger way.Screenshot from 2013-10-07 12:24:52 Screenshot from 2013-10-07 12:42:10 Screenshot from 2013-10-07 12:41:53 Screenshot from 2013-10-07 12:41:12 Screenshot from 2013-10-07 12:40:41 Screenshot from 2013-10-07 12:34:03 Screenshot from 2013-10-07 12:32:51 Screenshot from 2013-10-07 12:31:44 Screenshot from 2013-10-07 12:30:13 The recommended keywords is designed very nicely and subtly. You can click on screenshots for a better look (links have been updated)

Screenshot from 2013-10-07 12:24:52

Once you finalize your campaign- you should see a campaign dashboard.

You can also click on the Analytics tab on the top of campaign dashboard and see your own activity, thus adding to social media analytics options. Here  it is more of a series of screenshots that is supposed to act as a mini- tutorial to make you familiar with the paltform.

Polyglots for Data Science #python #sas #r #stats #spss #matlab #julia #octave

In the future I think analysts need to be polyglots- you will need to know more than one language for crunching data.

SAS, Python, R, Julia,SPSS,Matlab- Pick Any Two 😉 or Any Three.

No, you can’t count C or Java as a statistical  language 🙂 🙂

Efforts to promote Polyglots in Statistical Software are-

1) R for SAS and SPSS Users (free or book)

2) R for Stata Users (book)

3) SAS and R (blog and book)

4) Using Python and R together

Probably we need a Python and R for Data Analysis book- just like we have for SAS and R books.

5) Matlab   and R

Reference (http://mathesaurus.sourceforge.net/matlab-python-xref.pdf ) includes Python

5) Octave and R

package http://cran.r-project.org/web/packages/RcppOctave/vignettes/RcppOctave.pdf includes Matlab

reference http://cran.r-project.org/doc/contrib/R-and-octave.txt

6) Julia and python

  • PyPlot uses the Julia PyCall package to call Python’s matplotlib directly from Julia

7) SPSS and Python is here

8) SPSS and R is as below

  • The Essentials for R for Statistics versions 22, 21, 20, and 19 are available here.
  • This link will take you to the SourceForge site where the Version 18 Essentials and Plugins are hosted.


9) Using R from Clojure – Incanter

Use embedded R from Clojure and Incanter http://github.com/jolby/rincanter

NumFocus- The Python Statistical Community

I really liked the mature design, and foundation of this charitable organization. While it is similar to FOAS in many ways (http://www.foastat.org/projects.html) I like the projects . Excellent projects and some of which I think should be featured in Journal of Statistical Software– (since there is a seperate R Journal) unless it wants to be overtly R focused.


In the same manner I think some non Python projects should try and reach out to NumFocus (if it is not wanting to be so  PyFocus-ed)

Here it is NumFocus

NumFOCUS supports and promotes world-class, innovative, open source scientific software. Most individual projects, even the wildly successful ones, find the overhead of a non-profit to be too large for their community to bear. NumFOCUS provides a critical service as an umbrella organization which removes the burden from the projects themselves to raise money.

Money donated through NumFOCUS goes to sponsor things like:

  • Coding sprints (food and travel)
  • Technical fellowships (sponsored students and mentors to work on code)
  • Equipment grants (to developers and projects)
  • Conference attendance for students (to PyData, SciPy, and other conferences)
  • Fees for continuous integration and other software engineering tools
  • Documentation development
  • Web-page hosting and bandwidth fees for projects

Core Projects

NumPy

static/images/NumPY.pngNumPy is the fundamental package needed for scientific computing with Python. Besides its obvious scientific uses, NumPy can also be used as an efficient multi-dimensional container of generic data. Arbitrary data-types can be defined. This allows NumPy to seamlessly and speedily integrate with a wide variety of databases. Repositories for NumPy binaries: http://www.lfd.uci.edu/~gohlke/pythonlibs/#numpy, a variety of versions – http://sourceforge.net/projects/numpy/files/NumPy/, version 1.6.1 – http://sourceforge.net/projects/numpy/files/NumPy/1.6.1/.

SciPy

static/images/scipy.pngSciPy is open-source software for mathematics, science, and engineering. It is also the name of a very popular conference on scientific programming with Python. The SciPy library depends on NumPy, which provides convenient and fast N-dimensional array manipulation. The SciPy library is built to work with NumPy arrays, and provides many user-friendly and efficient numerical routines such as routines for numerical integration and optimization.

Matplotlib

static/images/matplotlib.png2D plotting library for Python that produces high quality figures that can be used in various hardcopy and interactive environments. matplolib is compatiable with python scripts and the python and ipython shells.

IPython

static/images/ipython.pngHigh quality open source python shell that includes tools for high level and interactive parallel computing.

SymPy

static/images/SymPy2.jpgSymPy is a Python library for symbolic mathematics. It aims to become a full-featured computer algebra system (CAS) while keeping the code as simple as possible in order to be comprehensible and easily extensible. SymPy is written entirely in Python and does not require any external libraries.

Other Projects

Cython

static/images/cython.pngCython is a language based on Pyrex that makes writing C extensions for Python as easy as writing them in Python itself. Cython supports calling C functions and declaring C types on variables and class attributes, allowing the compiler to generate very efficient C code from Cython code.

pandas

static/images/pandas.pngpandas is an open source, BSD-licensed library providing high-performance, easy-to-use data structures and data analysis tools for the Python programming language.

PyTables

static/images/logo-pytables-small.pngPyTables is a package for managing hierarchical datasets and designed to efficiently and easily cope with extremely large amounts of data. PyTables is built on top of the HDF5 library, using the Python language and the NumPy package. It features an Pythonic interface combined with C / Cython extensions for the performance-critical parts of the code. This makes it a fast, yet extremely easy to use tool for very large amounts of data. http://pytables.github.com/

scikit-image

static/images/scikitsimage.pngFree high-quality and peer-reviewed volunteer produced collection of algorithms for image processing.

scikit-learn

static/images/scikitslearn.pngModule designed for scientific pythons that provides accesible solutions to machine learning problems.

Scikits-Statsmodels

static/images/scikits.pngStatsmodels is a Python package that provides a complement to scipy for statistical computations including descriptive statistics and estimation of statistical models.

Spyder

static/images/spyder.pngInteractive development environment for Python that features advanced editing, interactive testing, debugging and introspection capabilities, as well as a numerical computing environment made possible through the support of Ipython, NumPy, SciPy, and matplotlib.

Theano

static/images/theano_logo_allblue_200x46.pngTheano is a Python library that allows you to define, optimize, and evaluate mathematical expressions involving multi-dimensional arrays efficiently.

Associated Projects

NumFOCUS is currently looking for representatives to enable us to promote the following projects. For information contact us at: info@NumFOCUS.org.

Sage

static/images/sage.pngOpen source mathematics sofware system that combines existing open-source packages into a Python-based interface.

NetworkX

NetworkX is a Python language software package for the creation, manipulation, and study of the structure, dynamics, and functions of complex networks.

Python(X,Y)

static/images/pythonxy.pngFree scientific and engineering development software used for numerical computations, and analysis and visualization of data using the Python programmimg language.


Task View on Web Technologies #rstats

Task Views on R offer a good way to navigate the 5000 + plus packages . Screenshot from 2013-09-17 19:16:50 They are here-  http://cran.r-project.org/web/views/

ROpenSci has a CRAN Task View , except it is on Github, and it is on using web services from within R. I think it is more like a R API View!

UPDATE- It is updated and now on CRAN here

I wish CRAN View allowed MORE Markdown expecially in the views– or the whole site …

😉

http://cran.r-project.org/web/views/WebTechnologies.html

You can see a lot of Not on CRAN packages huh ed?

CRAN Task View: Web Technologies and Services

Maintainer: Scott Chamberlain, Karthik Ram, Christopher Gandrud, Patrick Mair
Contact: scott at ropensci.org
Version: 2013-10-02
This task view contains information about using R to obtain and parse data from the web. The base version of R does not ship with many tools for interacting with the web. Thankfully, there are an increasingly large number of tools for interacting with the web. If you have any comments or suggestions for additions or improvements please contact the maintainer of the task view. A list of available packages and functions is presented below, grouped by the type of activity.

Tools for Working with the Web from R

Parsing Data from the Web

  • The repmis package contains a source_data() command to load plain-text data from a URL (either http or https).
  • The package XML contains functions for parsing XML and HTML, and supports xpath for searching XML (think regex for strings). A helpful function to read data from one or more HTML tables is readHTMLTable().
  • scrapeR provides additional tools for scraping data from HTML and XML documents.
  • The XML2R package (to be on CRAN soon) is a collection of convenient functions for coercing XML into data frames.
  • The rjson converts R object into Javascript object notation (JSON) objects and vice-versa.
  • An alternative to the rjson is RJSONIO which also converts to and from data in JSON format (it is fast for parsing).
  • An alternative to the XML package is selectr, which parses CSS3 Selectors and translates them to XPath 1.0 expressions.

Curl/HTTP/FTP and Authentication:

  • RCurl: A low level curl wrapper that allows one to compose general HTTP requests and provides convenient functions to fetch URIs, get/post forms, etc. and process the results returned by the Web server. This provides a great deal of control over the HTTP/FTP connection and the form of the request while providing a higher-level interface than is available just using R socket connections. It also provide tools for Web authentication.
  • httr: A light wrapper around RCurl that makes many things easier, but still allows you to access the lower level functionality of RCurl. It has convenient http verbs: GET(), POST(), PUT(), DELETE(), PATCH(), HEAD(), BROWSE(). These wrap functions are more convenient to use, though less configurable than counterparts in RCurl. http status codes are helpful for debugging http calls. This package makes this easier using, for example, stop_for_status() gets the http status code from a response object, and stops the function if the call was not successful.
  • Using web resources can require authentication, either via API keys, OAuth, username:password combination, or via other means. ROAuth is a package that provides a separate R interface to OAuth. OAuth is the most complicated authentication process, and can be most easily done using httr (see package demos).

Web Frameworks

  • The shiny package makes it easy to build interactive web applications with R.
  • The Rook web server interface contains the specification and convenience software for building and running Rook applications.
  • The opencpu framework for embedded statistical computation and reproducible research exposes a web API interfacing R, LaTeX and Pandoc. This API is used for example to integrate statistical functionality into systems, share and execute scripts or reports on centralized servers, and build R based apps.

JavaScript

  • ggvis (not on CRAN) makes it easy to describe interactive web graphics in R. It fuses the ideas of ggplot2 and shiny, rendering graphics on the web with Vega.
  • rCharts (not on CRAN) allows for interactive javascript charts from R.
  • rVega (not on CRAN) is an R wrapper for Vega.
  • clickme (not on CRAN) is an R package to create interactive plots.

Data Sources on the Web Accessible via R

Ecological and Evolutionary Biology

  • rvertnet: A wrapper to the VertNet collections database API.
  • rgbif: Interface to the Global Biodiversity Information Facility API methods.
  • rfishbase: A programmatic interface to fishbase.org.
  • treebase: An R package for discovery, access and manipulation of online phylogenies.
  • taxize: Taxonomic information from around the web.
  • dismo: Species distribution modeling, with wrappers to some APIs.
  • rnbn (not on CRAN): Access to the UK National Biodiversity Network data.
  • rWBclimate (not on CRAN): R interface for the World Bank climate data.
  • rbison (not on CRAN): Wrapper to the USGS Bison API.
  • neotoma (not on CRAN): Programmatic R interface to the Neotoma Paleoecological Database.
  • rnoaa (not on CRAN): R interface to NOAA Climate data API.
  • rnpn (not on CRAN): Wrapper to the National Phenology Network database API.
  • rfisheries: Package for interacting with fisheries databases at openfisheries.org.
  • rebird: A programmatic interface to the eBird database.
  • flora: Retrieve taxonomical information of botanical names from the Flora do Brasil website.
  • Rcolombos: This package provides programmatic access to Colombos, a web based interface for exploring and analyzing comprehensive organism-specific cross-platform expression compendia of bacterial organisms.
  • Reol: An R interface to the Encyclopedia of Life (EOL) API. Includes functions for downloading and extracting information off the EOL pages.
  • rPlant: An R interface to the the many computational resources iPlant offers through their RESTful application programming interface. Currently, rPlant functions interact with the iPlant foundational API, the Taxonomic Name Resolution Service API, and the Phylotastic Taxosaurus API. Before using rPlant, users will have to register with the iPlant Collaborative. http://www.iplantcollaborative.org/discover/discovery-environment

Genes and Genomes

  • cgdsr: R-Based API for accessing the MSKCC Cancer Genomics Data Server (CGDS).
  • rsnps (not on CRAN): Wrapper to the openSNP data API and the Broad Institute SNP Annotation and Proxy Search.
  • rentrez: Talk with NCBI entrez using R.

Earth Science

  • RNCEP: Obtain, organize, and visualize NCEP weather data.
  • crn: Provides the core functions required to download and format data from the Climate Reference Network. Both daily and hourly data are downloaded from the ftp, a consolidated file of all stations is created, station metadata is extracted. In addition functions for selecting individual variables and creating R friendly datasets for them is provided.
  • BerkeleyEarth: Data input for Berkeley Earth Surface Temperature.
  • waterData: An R Package for retrieval, analysis, and anomaly calculation of daily hydrologic time series data.
  • CHCN: A compilation of historical through contemporary climate measurements scraped from the Environment Canada Website Including tools for scraping data, creating metadata and formating temperature files.
  • decctools: Provides functions for retrieving energy statistics from the United Kingdom Department of Energy and Climate Change and related data sources. The current version focuses on total final energy consumption statistics at the local authority, MSOA, and LSOA geographies. Methods for calculating the generation mix of grid electricity and its associated carbon intensity are also provided.
  • Metadata: Collates metadata for climate surface stations.
  • sos4R: A client for Sensor Observation Services (SOS) as specified by the Open Geospatial Consortium (OGC). It allows users to retrieve metadata from SOS web services and to interactively create requests for near real-time observation data based on the available sensors, phenomena, observations et cetera using thematic, temporal and spatial filtering.

Economics

  • WDI: Search, extract and format data from the World Bank’s World Development Indicators.
  • FAOSTAT: The package hosts a list of functions to download, manipulate, construct and aggregate agricultural statistics provided by the FAOSTAT (Food and Agricultural Organization of the United Nations) database.

Chemistry

  • rpubchem: Interface to the PubChem Collection.

Agriculture

  • cimis: R package for retrieving data from CIMIS, the California Irrigation Management Information System.

Literature, Metadata, Text, and Altmetrics

  • rplos: A programmatic interface to the Web Service methods provided by the Public Library of Science journals for search.
  • rbhl (not on CRAN): R interface to the Biodiversity Heritage Library (BHL) API.
  • rmetadata (not on CRAN): Get scholarly metadata from around the web.
  • RMendeley: Implementation of the Mendeley API in R.
  • rentrez: Talk with NCBI entrez using R.
  • rorcid (not on CRAN): A programmatic interface the Orcid.org API.
  • rpubmed (not on CRAN): Tools for extracting and processing Pubmed and Pubmed Central records.
  • rAltmetic (not on CRAN): Query and visualize metrics from Altmetric.com.
  • rImpactStory: Programmatic interface to the ImpactStory API.
  • alm (not on CRAN): R wrapper to the almetrics API platform developed by PLoS.
  • ngramr: Retrieve and plot word frequencies through time from the Google Ngram Viewer.

Marketing

  • anametrix: Bidirectional connector to Anametrix API.

Data Depots

  • dvn: Provides access to The Dataverse Network API.
  • rfigshare: Programmatic interface for Figshare.
  • factualR: Thin wrapper for the Factual.com server API.
  • dataone: A package that provides read/write access to data and metadata from the DataONE network of Member Node data repositories.
  • yhatr: Lets you deploy, maintain, and invoke models via the Yhat REST API.
  • RSocrata: Provided with a Socrata dataset resource URL, or a Socrata SoDA web API query, returns an R data frame. Converts dates to POSIX format. Supports CSV and JSON. Manages throttling by Socrata.

Machine Learning as a Service

  • bigml: BigML, a machine learning web service.
  • MTurkR: Access to Amazon Mechanical Turk Requester API via R.

Web Analytics

  • rgauges (not on CRAN): Interface to Gaug.es API.
  • RSiteCatalyst: Functions for accessing the Adobe Analytics (Omniture SiteCatalyst) Reporting API.
  • r-google-analytics (not on CRAN): Provides access to Google Analytics.

News

  • GuardianR: Provides an interface to the Open Platform’s Content API of the Guardian Media Group. It retrieves content from news outlets The Observer, The Guardian, and guardian.co.uk from 1999 to current day.

Images, Videos, Music

  • imguR: A package to share plots using the image hosting service imgur.com.
  • RLastFM: A package to interface to the last.fm API.

Sports

  • nhlscrapr: Compiling the NHL Real Time Scoring System Database for easy use in R.

Maps

  • RgoogleMaps: This package serves two purposes: It provides a comfortable R interface to query the Google server for static maps, and use the map as a background image to overlay plots within R.
  • osmar: This package provides infrastructure to access OpenStreetMap data from different sources to work with the data in common R manner and to convert data into available infrastructure provided by existing R packages (e.g., into sp and igraph objects).
  • ggmap: Allows for the easy visualization of spatial data and models on top of Google Maps, OpenStreetMaps, Stamen Maps, or CloudMade Maps using ggplot2.

Social media

  • streamR: This package provides a series of functions that allow R users to access Twitter’s filter, sample, and user streams, and to parse the output into data frames. OAuth authentication is supported.
  • twitteR: Provides an interface to the Twitter web API.

Government

  • wethepeople: An R client for interacting with the White House’s “We The People” petition API.
  • govdat: Interface to various APIs for government data, including New York Times congress API, and the Sunlight Foundation set of APIs.
  • govStatJPN: Functions to get public survey data in Japan.

Other

  • sos4R: R client for the OGC Sensor Observation Service.
  • datamart: Provides an S4 infrastructure for unified handling of internal datasets and web based data sources. Examples include dbpedia, eurostat and sourceforge.
  • rDrop (not on CRAN): Dropbox interface.
  • zendeskR: This package provides an R wrapper for the Zendesk API.

The original was on github

https://github.com/ropensci/webservices

Some new packages I really liked!

  • rDrop: Dropbox interface.
  • nhlscraper: Compiling the NHL Real Time Scoring System Database for easy use in R
  • osmar: This package provides infrastructure to access OpenStreetMap data from different sources, to work with the data in common R manner, and to convert data into available infrastructure provided by existing R packages (e.g., into sp and igraph objects).
  • MTurkR: Access to Amazon Mechanical Turk Requester API via R. more

  • rgauges: Interface to Gaug.es API more (not on CRAN)

  • RSiteCatalyst: Adobe Analytics (Omniture SiteCatalyst) Reporting API

  • GuardianR: Provides an interface to the Open Platform’s Content API of the Guardian Media Group.

  • imguR: A package to share plots using the image hosting service imgur.com
  • RLastFM: A package to interface to the last.fm API.

Family as a basic social unit- Stats

Some stats from http://www.stepfamilies.info/stepfamily-fact-sheet.php

Sadly they decided to discontinue providing estimates of marriage, divorce, and remarriage except for those that are available from  current census. Thus, many of the following  current estimates were derived from the 1990 census and earlier data sources. This is for the US, but I would be interested in plotting say how GDP and Family Unit size changes— across countries


Current estimates from 1988-1990 suggest:

  • 92% of all men and women marry by age 50
  • 43% of first marriages will end in divorce within 15 years
  • 25% of all men and women report being marriage two or more times by age 50
  • In 2004, 42% of all marriages were remarriages for at least one partner
  • Of those who get divorced, 75% will remarry (65% bring children from a previous union)
  • 60% of those who get remarried redivorce
  • 15% of remarriages will end in divorce within 3 years, 25% within 5 years, 39% within 10 years
  • The average length of first and re- marriages that end in divorce is about 8 years
  • The average time between first divorce and remarriage is about 3.5 years
  • 54% of women will remarry within 5 years of first divorce and 75% within 10 years
  • 50% of men who remarry after first divorce do so within 3-4 years
  • Having low income and living in poor neighborhoods are associated with a lower chance of remarriage
  • Younger adults are more likely to remarry than older ones
  • Whites and Latinos are more likely to remarry than African Americans
  • After 5 years of divorce Whites are most likely to remarry (58%), followed by Latinos (44%) and African Americans (32%)
  • These proportions show a marked downward trend when compared to national samples in 1976, which indicated the probability of remarriage within 5 years of divorce was 73% for Whites and nearly 50% for African Americans
  • Estimates suggest that by the time they are 18, anywhere from 1/3 to 1/2 will have been part of a stepfamily

In addition while billions are being spent on data software , how can we cut down the cost of collecting Census data using newer technologies ( than those paper forms!!)