Iris for Big Data #rstats #bigdata

Quote of the Day-

it is impossible to be a data scientist without knowing iris 

#Anonymous #Quotes


Revolution Analytics has been nice enough to provide both datasets and code for analyzing Big Data in R.

http://www.revolutionanalytics.com/subscriptions/datasets/

http://packages.revolutionanalytics.com/datasets/

Site was updated so here are the new links


while the Datasets collection is still elementary, as a R Instructor I find this list extremely useful. However I wish they look at some other repositories and make .xdf and “tidy” csv versions. A little bit of RODBC usage should help, and so will some descriptions. Maybe they should partner with Quandl, DataMarket, or Infochimps on this initiative than do it alone.


Overall there can be a R package (like a Big Data version of the famous datasets package in R)

But a nice and very useful effort

Revolution R Datasets

More code-

http://blog.revolutionanalytics.com/2013/08/big-data-sets-for-r.html

Also a recent project made by a student of mine on Revolution Datasets and using their blog posts.
Note how much more better the above project is than use the mini and super clean datasets within R (like Boston)


Hat TIP- R’s very own Mr Smith
Unrelated-
For more on IRIS


Using ifelse in R for creating new variables #rstats #data #manipulation

The ifelse function is simple and powerful and can help in data manipulation within R. Here I create a categoric variable from specific values in a numeric variable

> data(iris)

> iris$Type=ifelse(iris$Sepal.Length<5.8,”Small Flower”,”Big Flower”)
> table(iris$Type)
Big Flower Small Flower
77           73

The parameters  of ifelse is quite simple

Usage

ifelse(test, yes, no)
Arguments

test
an object which can be coerced to logical mode.

yes
return values for true elements of test.

no
return values for false elements of tes


Basics of Data Handling for R beginners #rstats

  • Assigning Objects

We can create new data objects and variables quite easily within R. We use the = or the → operator to denote assigning an object to it’s name. For the purpose of this article we will use = to assign objectnames and objects. This is very useful when we are doing data manipulation as we can reuse the manipulated data as inputs for other steps in our analysis.


Types of Data Objects in R

  • Lists

A list is simply a collection of data. We create a list using the c operator.

The following code creates a list named numlist from 6 input numeric data

numlist=c(1,2,3,4,5,78)


The following code creates a list named charlist from 6 input character data

charlist=c(“John”,”Peter”,”Simon”,”Paul”,”Francis”)


The following code creates a list named mixlistfrom both numeric and character data.

mixlist=c(1,2,3,4,”R language”,”Ajay”)


  • Matrices

Matrix is a two dimensional collection of data in rows and columns, unlike a list which is basically one dimensional. We can create a matrix using the matrix command while specifying the number of rows by nrow and number of columns by ncol paramter.

In the following code , we create an matrix named ajay and the data is input in 3 rows as specified, but it is entered into first column, then second column , so on.

ajay=matrix(c(1,2,3,4,5,6,12,18,24),nrow=3)

ajay

[,1] [,2] [,3]

[1,] 1 4 12

[2,] 2 5 18

[3,] 3 6 24


However please note the effect of using the byrow=T (TRUE) option. In the following code we create an matrix named ajay and the data is input in 3 rows as specified, but it is entered into first row, then second row , so on.


>ajay=matrix(c(1,2,3,4,5,6,12,18,24),nrow=3,byrow=T)

>ajay

[,1] [,2] [,3]

[1,] 1 2 3

[2,] 4 5 6

[3,] 12 18 24

  • Data Frames

A data frame is a list of variables of the same number of rows with unique row names. The column names are the names of the variables.


6 weeks Data Scientist Online Courses #rstats

Hosting a 6 weekend live online certification course on Business Analytics with R starting June 1 at Edureka.Check www.edureka.in/r-for-analytics for more details. Course has been decided to ensure more open data science than current expensive offerings that are tech rather than business oriented but more support and customization than a MOOC This is because many business customers don’t care if it is lapply or ddapply, or command line or GUI, as long  as they get good ROI on time and money spent in shifting to R from other analytics software.

Screenshot from 2013-05-28 07:16:41


Using a Linux only package in Windows #rstats

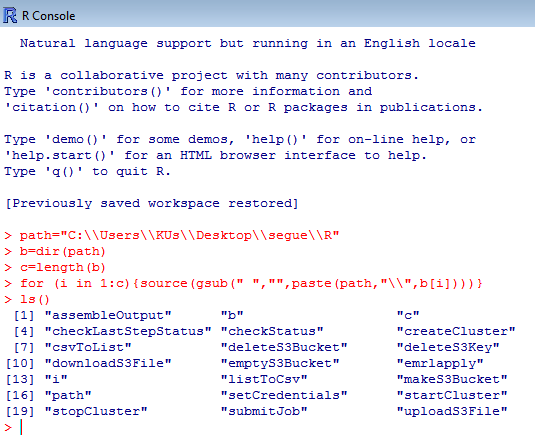
Here is some R code for using a R package that has only a tar.gz file available (used to load R packages in Linux) and no Zip file available (used to load R packages in Windows).

Step 1- Download the tar.gz file.

Step 2 Unzip it (twice) using 7zip

Step 3 Change the path variable below to your unzipped, downloaded location for the R sub folder within the package folder .

Step 4 Copy and Paste this in R

Step 5 Start using the R package in Windows (where 75% of the money and clients and businesses still are)

Caveat Emptor- No X Dependencies (ok!)

path="C:\\Users\\KUs\\Desktop\\segue\\R"
b=dir(path)
c=length(b)
for (i in 1:c){source(gsub(" ","",paste(path,"\\",b[i])))}
ls()


R2D2

Using R for Cricket Analysis #rstats #IPL

#Downloading the Data for batting across all formats of cricket
library(XML)
url="http://stats.espncricinfo.com/ci/engine/stats/index.html?class=11;template=results;type=batting"
tables=readHTMLTable(url,stringsAsFactors = F)
#Note we wrote stringsAsFactors=F in this to avoid getting factor variables, 
#since we will need to convert these variables to numeric variables
table2=tables$"Overall figures"
rm(tables)
#Creating new variables from Span
table2$Debut=as.numeric(substr(table2$Span,1,4))
table2$LastYr=as.numeric(substr(table2$Span,6,10))
table2$YrsPlayed=table2$LastYr-table2$Debut
#Creating New Variables. In cricket a not out score is denoted by * which can cause data quality error. 
#This is treated by grepl for finding and gsub for removing the *. 
#Note the double \ to escape regex charachter
table2$HSNotOut=grepl("\\*",table2$HS)
table2$HS2=gsub("\\*","",table2$HS)
#Creating a FOR Loop (!) to convert variables to numeric variables
for (i in 3:17) {
+     table2[, i] <- as.numeric(table2[, i])
+ }

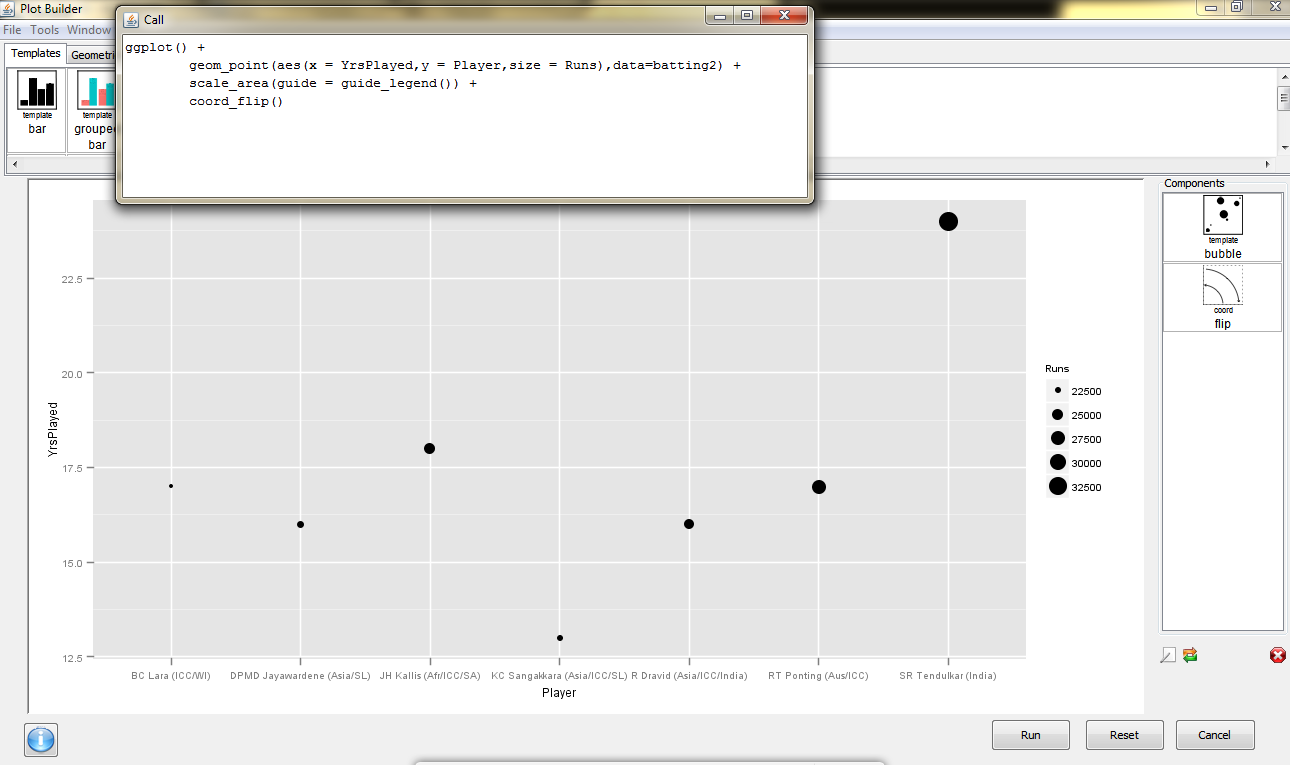
and we see why Sachin Tendulkar is the best (by using ggplot via Deducer)

dmancasestudy5

Also see 

  • Freaknomics Challenge-
    1. Prove match fixing does not and cannot exist in IPL
    2. Create an ideal fantasy team


Using R for Cricket Analysis #rstats

ESPN Crincinfo is the best site for cricket data (you can see an earlier detailed post on the database  here https://decisionstats.com/2012/04/07/cricinfo-statsguru-database-for-statistical-and-graphical-analysis/  ), and using the XML package in R we can easily scrape and manipulate data

Here is the code.

library(XML)
url="http://stats.espncricinfo.com/ci/engine/stats/index.html?class=1;team=6;template=results;type=batting"
#Note I can also break the url string and use paste command to modify this url with parameters
tables=readHTMLTable(url)
tables$"Overall figures"

#Now see this- since I only got 50 results in each page, I look at the url of next page

table1=tables$"Overall figures"
url="http://stats.espncricinfo.com/ci/engine/stats/index.html?class=1;page=2;team=6;template=results;type=batting"
tables=readHTMLTable(url)
table2=tables$"Overall figures"

#Now I need to join these two tables vertically

table3=rbind(table1,table2)

Note-I can also automate the web scraping .
Now the data is within R, we can use something like Deducer to visualize.
Created by Pretty R at inside-R.org