I was in New York for past two days. New York is very pretty, very cold and the trains are very confusing. So I ended up walking and going back and forth.
Later on, when I reached home, heat, food, bed and jet lag, I decided to analyze where and what did I see in the visual ephiphany tour.
This was my route
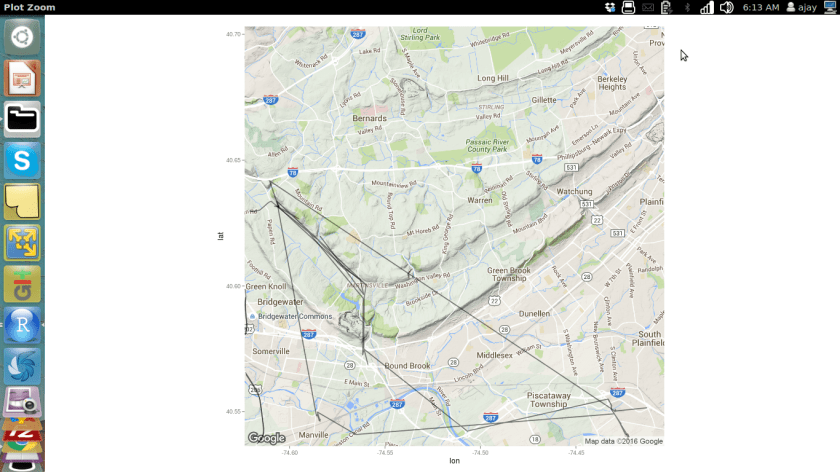
This was my R code
library(jsonlite)
a=fromJSON("/home/ajay/Desktop/Takeout/Location History/LocationHistory.json")
b=as.data.frame(a)

mygoog=NULL
mygoog$latitude=b$locations.latitudeE7/10000000
mygoog$longitude=b$locations.longitudeE7/10000000
mygoog$time=as.POSIXct(as.numeric(b$locations.timestampMs)/1000 , origin="1970-01-01")


mygoog=as.data.frame(mygoog)
head(mygoog)
nrow(mygoog)
#Clearly that is over the API limit for free usage
length(unique(mygoog$longitude))
library(magrittr) #to make code easier to read
mygoog$longitude%>%unique%>%length
unique(mygoog$latitude)
mygoog$latitude%>%unique%>%length

fivenum(mygoog$latitude) #tukey

#or using Dr H over Tukey
library(Hmisc)
describe(mygoog$latitude)
describe(mygoog$longitude)

#deleting Non NY data
mygoog2=mygoog[mygoog$longitude<0,]
describe(mygoog2$longitude)
rm(mygoog2)
mygoog2=mygoog[mygoog$latitude<48,]
describe(mygoog2$latitude)
rm(mygoog2)

mygoog=mygoog[mygoog$longitude<0&mygoog$latitude<48,]


library(ggmap)=
#Starting Point
revgeocode(c(mygoog$longitude[1],mygoog$latitude[1]))
#Starting Time
mygoog$time[1]
------
  #Median Location
a1=median(mygoog$longitude)
print(a1)
a2=median((mygoog$latitude))
print(a2)
revgeocode(c(a1,a2))

#Lingering Location
Mode <- function(x) {
  ux <- unique(x)
  ux[which.max(tabulate(match(x, ux)))]
}
b1=Mode(mygoog$longitude)
b1
b2=Mode(mygoog$latitude)
b2

revgeocode(c(b1,b2))
#Creating New Fields to minimize API calls to Google Maps
unique(mygoog$longitude)
unique(mygoog$latitude)
 mygoog2=mygoog[!duplicated(mygoog[c("longitude", "latitude")]),]
nrow(mygoog2)

result <- do.call(rbind,
                  lapply(1:nrow(mygoog2),
                         function(i)revgeocode(as.numeric(mygoog2[i,1:2]))))
mygoog2 <- cbind(mygoog2,result)

library(stringr)
mygoog2$zipcode <- substr(str_extract(mygoog2$result," [0-9]{5}, .+"),2,6)
mygoog2[,-4]

#merge(x, y, by=c("k1","k2")) # NA's match

#Cleaning up workspace
             #rm(a1)
             #rm(a2)
             #gc()

Map <- get_googlemap(center = c(lon = median(mygoog$longitude), lat = median(mygoog$latitude)),
                     zoom = 13,
                     size = c(640, 640),
                     scale = 2, maptype = c("terrain"),
                     color = "color")

plot1 <- ggmap(Map) +
  geom_path(data = mygoog, aes(x = longitude, y = latitude
  ),
  alpha = I(0.9),
  size = 1.8)
suppressWarnings(print(plot1))
Code contains Easter Eggs created by Pretty R at inside-R.org
 Polite hello gets me more work contracts than aggressive pitches. I am not afraid to say hello, but I always write a crisp two line on why I am saying hello. Short and sweet messaging rules today’s era. Attention span is short. Brevity is the soul of tweet.