Big Data and Data Science should help Google detect copyright infringements or detect terror motivational videos on Youtube

Big Data and Data Science should help Google detect copyright infringements or detect terror motivational videos on Youtube
What the world might need (in this writer’s much derided opinion) is a global set of volunteers to help find ISIS cyber army which uses the internet for motivation through videos and pictures in Instagram and Youtube, recruitment of sleeper lone wolves among carefully selected demographics among Western and Eastern locations , cyber retaliation targeted at law enforcement and military personnel culled from social media, propaganda for political and fundraising ( and real-time communication with both potential terrorists as well as internally using both encryption, and unorthodox methods of communicating) .
Crowd sourced cyber intelligence which can be incentivized to prevent members of Anonymous being recruited by North Korea or ISIS bitcoins. Think of volunteers that tried to fight in Russia’s fall to communism or volunteers that tried to fight against the Fascists in Spain. The West’s half hearted efforts in both these conflicts led the much bigger conflicts later on. Well does the free world need volunteers in the cyber terror fight against ISIS. Unfortunately the same people with a particular set of skills that can help FBI encrypt or decrypt phones, are people that have been aggressively prosecuted in the past. There is no cyber witness program and indeed no effort to reach out by counter-terrorism infrastructure to the hacker activist cyber infrastructure. This despite mutual suspicions of tax money wastage and cyber criminality. A house divided against itself will fall , in the real world and on the Internet.
Well what about Hemingway? From my favorite website
https://en.wikipedia.org/wiki/Ernest_Hemingway#Spanish_Civil_War

Hemingway (center) with Dutch filmmaker Joris Ivens and German writer Ludwig Renn(serving as an International Brigades officer) in Spain during Spanish Civil War, 1937.
In 1937, Hemingway agreed to report on the Spanish Civil War for the North American Newspaper Alliance (NANA),[86] arriving in Spain in March with Dutch filmmaker Joris Ivens.[87] Ivens, who was filming The Spanish Earth, wanted Hemingway to replace John Dos Passos as screenwriter, since Dos Passos had left the project when his friend José Robleswas arrested and later executed.[88] The incident changed Dos Passos’ opinion of the leftist republicans, creating a rift between him and Hemingway, who later spread a rumor that Dos Passos left Spain out of cowardice.
Late in 1937, while in Madrid with Martha, Hemingway wrote his only play, The Fifth Column, as the city was being bombarded.
The Spanish Civil War took place from 1936 to 1939 and was fought between the Republicans, who were loyal to the democratic, left-leaningSecond Spanish Republic, and the Nationalists, a falangist group led by General Francisco Franco. The Nationalists won, and Franco then ruled Spain for the next 36 years, from April 1939 until his death in November 1975.
The Spanish Civil War seized the fears and hopes of the world, including not just diplomats and politicians, but intellectuals, religious leaders, and labor unions, as well. Opinion divided three ways. The right and the Catholics supported the Nationalists as a way to stop the expansion of Bolshevism. On the left, including labor unions, students and intellectuals, the war represented a necessary battle to stop the spread of fascism. Antiwar and pacifist sentiment was strong in many countries
Early bird prices for passes to Predictive Analytics World for Business in Chicago – June 20-23 – end Friday, May 6th. Be sure to register for your pass at the best rate available before the early bird deadline flies away.

Early Bird Prices:
All Access Pass: $3,450
Two-Day Pass: $1,700
All Access Combo Pass: $3,740
Two-Day Combo Pass: $1,990
Regular Prices:
All Access Pass: $3,850
Two-Day Pass: $2,100
All Access Combo Pass: $4,040
Two-Day Combo Pass: $2,290
Check out this video overview of PAW Business:

When you register by Friday, May 6th, enjoy early bird rates that keep $300-400 in your pocket.
 — end of message
Quandl just came up with a list of seven deadly sins for Data Scientists. Their site provides a wide collection of data that would be beneficial for anyone looking to become successful in the analytical field. I interviewed their founder some time back here
I would add lack of reading as the biggest sin, and lack of writing /blogging as a big sin too. I guess that would be covered in Sloth.

Some terms that a data scientist should not be slothful about learning
Overfitting-
Overfitting occurs when a statistical model describes random error or noise instead of the underlying relationship. Overfitting generally occurs when a model is excessively complex, such as having too many parameters relative to the number of observations
What it leads to- Model explains your existing data fine but wont work on fresh data
Lift–
lift is a measure of the performance of a targeting model (association rule) at predicting or classifying cases as having an enhanced response (with respect to the population as a whole), measured against a random choice targeting model. A targeting model is doing a good job if the response within the target is much better than the average for the population as a whole. Lift is simply the ratio of these values: target response divided by average response.
For example, suppose a population has an average response rate of 5%, but a certain model (or rule) has identified a segment with a response rate of 20%. Then that segment would have a lift of 4.0 (20%/5%).
Typically, the modeller seeks to divide the population into quantiles, and rank the quantiles by lift.
Hosmer-Lemeshow Goodness-of-Fit Test
The Hosmer–Lemeshow test is a statistical test for goodness of fit for logistic regression models. It is used frequently in risk prediction models. The test assesses whether or not the observed event rates match expected event rates in subgroups of the model population. The Hosmer–Lemeshow test specifically identifies subgroups as the deciles of fitted risk values. Models for which expected and observed event rates in subgroups are similar are called well calibrated.
First, the observations are sorted in increasing order of their estimated event probability. The event is the response level specified in the response variable option EVENT=, or the response level that is not specified in the REF= option, or, if neither of these options was specified, then the event is the response level identified in the “Response Profiles” table as “Ordered Value 1”. The observations are then divided into approximately 10 groups according to the following scheme.
Bayes Theorem
Bayes’ theorem is stated mathematically as the following equation:[2]
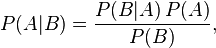
where A and B are events.
Suppose we want to know an individual’s probability of having cancer, but we know nothing about them. Despite not knowing anything about that person, a probability can be assigned based on the general prevalence of cancer. For the sake of this example, suppose it is 1%. This is known as the base rate or prior probability of having cancer. “Prior” refers to the time before being informed about the particular case at hand.
Next, suppose we find out that person is 65 years old. If we assume that cancer and age are related, this new piece of information can be used to better assess that person’s risk of having cancer. More precisely, we’d like to know the probability that a person has cancer when it is known that they are 65 years old. This quantity is known as the current probability, where “current” refers to the theorised situation upon finding out information about the particular case at hand.
In order to apply knowledge of that person’s age in conjunction with Bayes’ Theorem, two additional pieces of information are needed. Note, however, that the additional information is not specific to that person. The needed information is as follows:
Knowing this, along with the base rate, we can calculate that a person who is age 65 has a probability of having cancer equal to

Gradient Descent for Machine Learning
tochastic gradient descent (often shortened in SGD) is a stochastic approximation of the gradient descent optimizationmethod for minimizing an objective function
Both statistical estimation and machine learning consider the problem of minimizing an objective function that has the form of a sum:

where the parameter  which minimizes
  is to be estimated. Each summand function
  is typically associated with the
  -th observation in the data set (used for training).
In classical statistics, sum-minimization problems arise in least squares and in maximum-likelihood estimation (for independent observations).
https://www.coursera.org/learn/machine-learning/lecture/kCvQc/gradient-descent-for-linear-regression

Source
https://en.wikipedia.org/wiki/Lift_(data_mining)
http://www.newyorker.com/culture/culture-desk/remembering-prince
https://en.wikipedia.org/wiki/Bayes%27_theorem
https://en.wikipedia.org/wiki/Overfitting
https://support.sas.com/documentation/cdl/en/statug/63033/HTML/default/statug_logistic_sect039.htm
https://en.wikipedia.org/wiki/Hosmer%E2%80%93Lemeshow_test
Hi, I’m insert name here
start 1 an message explaining why I feels we have something in common
2 what those things are
3 funny or cheesy pick up line
4 question to make you see my profile
end regards, insert name here
ps I am real, and REALLY interested ( or some other thing from her online profile!)
Message from Blog Partner follows——————————————————–
Predictive Analytics Available for Everyone
Featured in Forbes.com, April 2016
DMWAY is highlighted for its ability to empower organizations to streamline predictive modeling and improve their competitive edge!Understanding your data is more important than ever as a means of differentiation. Industries as diverse as Fintech, Ecommerce, Marketing, Digital Advertising, Utilities, Health Care, and Communication services are all investing in these new transformative techniques. However, building predictive analytics models can still time-consuming, costly and risky. DMWAY transforms the way predictive analytics is perceived by giving everyone the ability to build better predictive models in hours; accessible and affordable both large and small organizations.
Forbes Quote
“DMWAY is a good example of how automation is best discussed as human augmentation rather than human replacement, as it facilitates analyst-machine collaboration. The human race may indeed go places when data scientists-both of the highly skilled and of the “citizen” varieties-are supplied with tools that increase their productivity and the accuracy of models that drive decisions”Gil Press
Thought Leader
Forbes.comThe DMWAY Solution
Your own data scientist, a self-service analytics platform that puts you on the fast track to automated predictive analytic algorithms for making data-driven predictions and decisions. Built by a team of internationally renowned data science experts, DMWAY’s data solution emulates the way data scientist experts solve & optimize predicative analytics, producing models better than most human data science experts.“Our goal is to break the barriers of predictive analytics, democratizing machine learning for all types of organizations looking to get into data analytics or scale up. Whether you’re a beginner or big data expert, predictive analytics is now available to everyone for generating models that hold years of “data science” experience in it.” – Gil Nizri, CEO, DMWAY
We are excited to meet with you during the SF Predictive Analytics World Conference, April 4-5th, and show you everything we have to offer your business. If you like what you hear, test our trial at no cost and start building models faster than any of your peers.DMWAY Analytics offers demo presentations and training To learn more, contact info@dmway.com, or visit us at dmway.com
 DECISION STATS