a compilation of cheat sheets for Data Scientists

a compilation of cheat sheets for Data Scientists
As a Punjabi engineer turned IIM MBA, who turns into a writer after marrying a woman from a different state (that’s me here!) , I was a bit apprehensive on how good or bad this movie could be. It was a relief and indeed a joy to watch this movie. The comic timing is light and everyone acts well. Watch Two States as the feel good movie of New BollyWood 2014. Alia Bhatt is lovely, Arjun Kapoor decides to move his acting and facial muscles, and the veteran team of actors fits in the roles very very naturally. A good way to spend a few hours, and be amazed at the amazing diversity of India.

This is a post that lists down my talks or conferences on Analytics and will be updated as I keep talking.
It also lists sponsors.
1) Big Data Big Analytics – http://krishnarajpm.com/bigdata/abstract.pdf Workshop on Statistical Machine Learning and Game Theory Approaches for Large Scale Data Analysis 9 July 2012 – 14 July 2012 Sponsored by Mathematical Sciences, Division of Science and Engineering Research Board at Bangalore India
Department of Science & Technology Government of India. (sponsored airfare-hotel accomodation-honorium)
2) Data Analytics using the Cloud- Challenges and Opportunities for India at 1st International Symposium on Big Data and Cloud Computing Challenges(ISBCC-2014) March 27-28, 2014 VIT University, Chennai, India Sponsored by BRNS (flight)
http://chennai.vit.ac.in/isbcc/
3) Open Source Analytics at OSSCamp 2014 http://osscamp.in/
http://osscamp.in/events/6/open-source-analytics-overview-r-python-and-others
Attended-
1) First Big Data Conference -New York sponsored by Aster Data (flight-stay)
https://decisionstats.com/2011/06/24/interview-first-big-data-conference/
2) Data Mining 2009 Sponsored by SAS Institute ( flight-stay)
https://decisionstats.com/2009/10/24/sas-data-mining-2009-las-vegas/
Interviews
1) Using R in HR Analytics -HR Tech Europe 2012 http://blog.hrtecheurope.com/2012/08/more-r-in-hr/ also http://blog.revolutionanalytics.com/2012/11/using-r-in-the-human-resources-department.html
2) R for Business Analytics- Analytics India Magazine
http://analyticsindiamag.com/interview-ajay-ohri-author-r-for-business-analytics/
3) Data Mining Research People Award 2010: Data Mining Blog http://www.dataminingblog.com/data-mining-research-interview-ajay-ohri/
4) Statsjobs – April 2008 http://statjobs.blogspot.in/2008/04/interview-with-ajay-ohri-data-mining.html
Awards-
1) Blogger of the Week Social Media Collective http://socialmediatoday.com/SMC/67268
2) Member of the Month (2 times) on Analyticbridge $250 awarded twice
http://www.analyticbridge.com/group/memberofthemonth/forum/topics/ajay-ohri-february-2009
————————————————————————————————————————–
If you need me to talk on analytics – drop me a line at http://linkedin.com/in/ajayohri and I can talk.
—————————————————————————————————————————-

I presented on how open source has helped business analytics grow. This was at the unconference (my first unconference) at http://osscamp.in/
I just updated my R for Business Analytics site (http://rforanalytics.wordpress.com/ ). Additions are as below you can go to http://rforanalytics.wordpress.com/ for the complete list- What I am trying to do is build a kind of Task View dedicated to Business Analytics (aimed at Business Analyst and Data Scientists) with slightly better HTML ( maybe Markdown later on) and some visual appeal.
—————ADDITIONS TO R FOR ANALYTICS COMPANION SITE
http://rforanalytics.wordpress.com/interviews-with-r-community/
Jeroen Ooms (OpenCPU)
https://decisionstats.com/2013/03/18/interview-jeroen-ooms-opencpu-rstats/
Christian (Statace)
Ian Fellows (Deducer)
https://decisionstats.com/2013/04/03/interview-dr-ian-fellows-fellstat-com-rstats-deducer/
Jeff Allen (Trestle)
https://decisionstats.com/2013/02/02/interview-jeff-allen-trestle-technology-rstats-rshiny/
Gergely Darcozi (RApporter)
https://decisionstats.com/2013/01/04/the-making-of-a-r-startup-part-1-rstats/
http://rforanalytics.wordpress.com/useful-links-for-r/odbc-databases-for-r/
R with MongoDB
http://cran.r-project.org/web/packages/rmongodb/rmongodb.pdf
This R package provides an interface to the NoSQL MongoDB database
using the MongoDB C-driver version 0.8
ps-
R with JSON
http://cran.r-project.org/web/packages/jsonlite/index.html
This package is a fork of the RJSONIO package
https://github.com/wactbprot/R4CouchDB
http://cran.r-project.org/web/packages/MonetDB.R/index.html
Allows to pull data from MonetDB into R
http://cran.r-project.org/web/packages/RCassandra/RCassandra.pdf
# Function for querying Neo4j from within R
# from http://stackoverflow.com/questions/11188918/use-neo4j-with-r
query <- function(querystring) {
    h = basicTextGatherer()
    curlPerform(url = "localhost:7474/db/data/ext/CypherPlugin/graphdb/execute_query",
        postfields = paste("query", curlEscape(querystring),
        sep = "="), writefunction = h$update, verbose = FALSE)
    result <- fromJSON(h$value())
    data <- data.frame(t(sapply(result$data, unlist)))
    names(data) <- result$columns
    return(data)
}
# --------------------------------------
# import all data into neo4j
# --------------------------------------
nrow(venueDataset) # number of venueshttps://github.com/RevolutionAnalytics/RHadoop/wiki
RHadoop consists of the following packages:
rmrhttp://amplab-extras.github.io/SparkR-pkg/
SparkR is an R package that provides a light-weight frontend to use Apache Spark from R. SparkR exposes the Spark API through the RDD class and allows users to interactively run jobs from the R shell on a cluster.
RHive is an R extension facilitating distributed computing via HIVE query. RHive allows easy usage of HQL(Hive SQL) in R, and allows easy usage of R objects and R functions in Hive.
http://cran.r-project.org/web/packages/RHive/index.html
A package to connect and run queries on Cloudera Impala (thanks to Mu Sigma)
http://cran.r-project.org/web/packages/RImpala/index.html
http://hortonworks.com/blog/bootstrap-sampling-with-apache-pig/
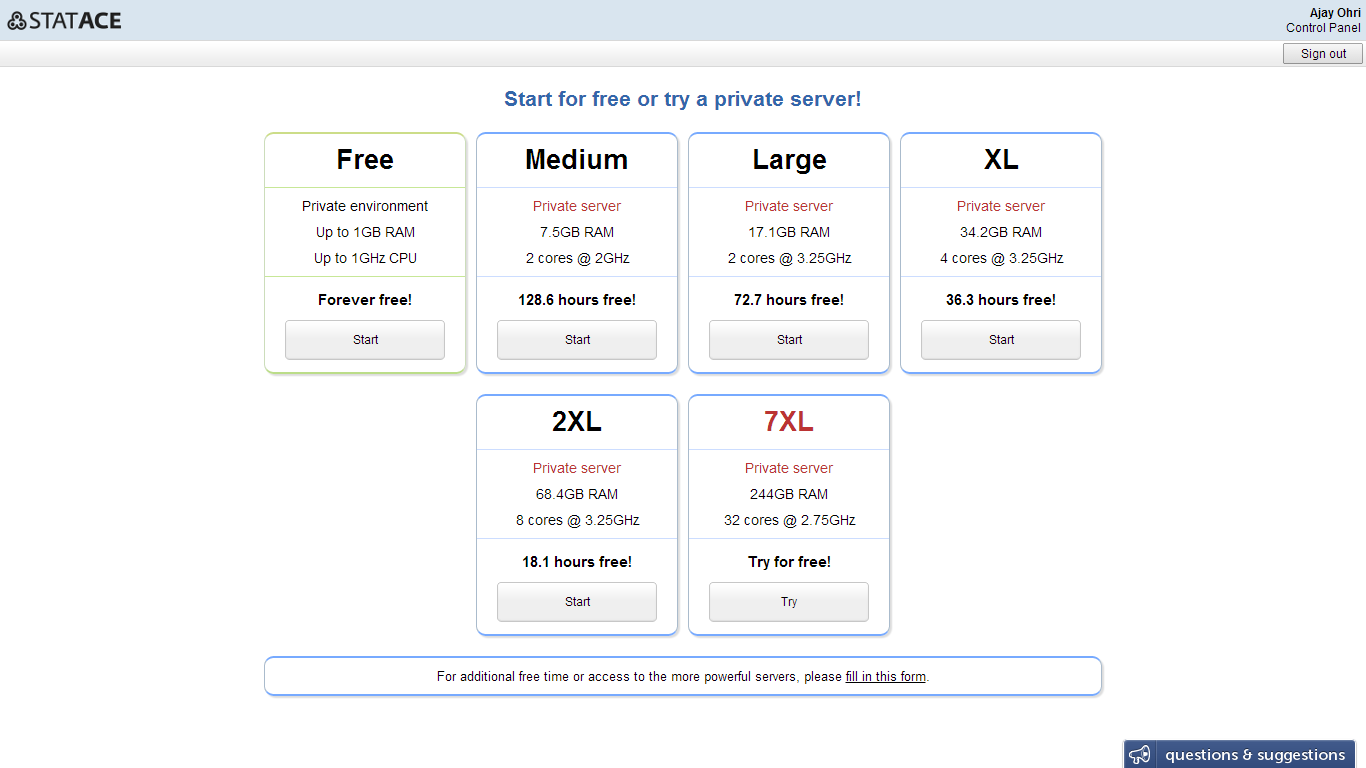
The guys at Statace released major updates- I am particularly excited for the ability to create a custom GUI box for your own analysis or for sharing with consulting clients or students.
What does that mean? Basically they are making it a bit like R Commander Extensions- so if you have a package or analysis you would rather do visually (than code) – you can create a GUI module for it. The modular extension is quite cool in my opinion, but further proof will be in how well designed the pudding is.
——————————————
Public sharing of results
Now you can share your analysis results for the world to see (example). Just click Share in the results pane.
Google Drive integration
We added integration with Google Drive. This makes collaboration and synchronization of large files even easier. Don’t forget we also support Dropbox. Just click the Connect to menu in the file manager.
Plots zoom and SVG export
Now you can open plots in a separate window that supports zoom in and zoom out. From it, you can also export to the SVG format which is ideal for printing. Just click the lens icon next to any plot.
Point-and-click PCA + data transformation without R knowledge
You can now carry out a PCA by just pointing and clicking though Analysis > Dimensional Analysis > Principal Components Analysis. We also added the Data menu which allows you to filter and sort datasets without any knowledge of R.
(Secret) Build your own visual dialog box to run R code
Do you have colleagues who don’t know R but need to use functionality you developed? Do you do consulting and want your customers to be able to run your models with point-and-click? Do you want to share a piece of R code with the world in an easy-to-use way?
StatAce now allows you to easily create a custom graphical interface for your R code. The process is entirely visual (no coding) and is what we use to build our own Data & Analysis menus (e.g. the bivariate correlation and linear regression dialog boxes). We are testing the functionality with a limited number of users, and their feedback has been great. Drop us a line at predict@statace.com to request early access.
———————————————————————————–
In PIG
a = LOAD 'nyse' USING org.apache.hcatalog.pig.HCatLoader();

b = FILTER a BY stock_symbol =='IBM' ;

c = group b all;

d = foreach c generate AVG(b.stock_volume);

dump d;
In SQL (Hive)
select AVG(stock_volume) from nyse where stock_symbol =="IBM"
(from HDP 2.0 Horton Sandbox Example)
Also see
http://www.quora.com/How-can-R-and-Hadoop-be-used-together
