
Author: Ajay Ohri
https://linkedin.com/in/ajayohri
10 Michael Jackson songs
Dont stop
Human Nature
You are not alone
Heal the World
Stranger in Moscow
Man in the Mirror
Gonna be starting something
The Way you make me feel
You rock my world
This is it
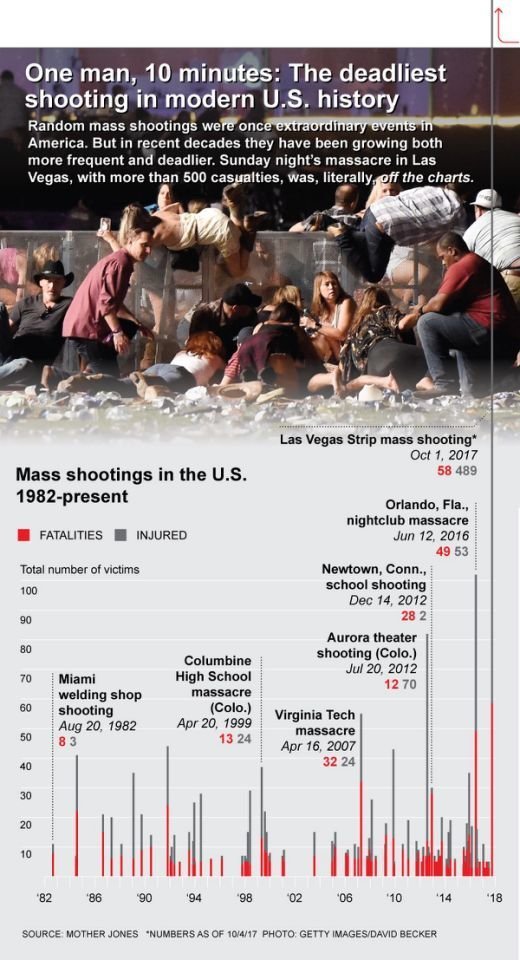
Lie factor in Gun Deaths Visualization
Edward Tufte in his seminal book talked of lie factor. See image below, and how columbine seems higher than virginia tech thanks to the dotted line even though it had 50% less casualities
http://www.infovis-wiki.net/index.php/Lie_Factor
The “Lie Factor” is a value to describe the relation between the size of effect shown in a graphic and the size of effect shown in the data.
Edward Tufte, Prof. at the Yale University, defined the “Lie Factor” in his book “The Visual Display of Quantitative Information” in 1983.
He states the principle that
The representation of numbers, as physically measured on the surface of the graphic itself, should be directly proportional to the quantities represented.
Image from http://www.huffingtonpost.com/entry/what-will-happen-to-the-las-vegas-shooters-suite-at-mandalay-bay_us_59d6721ae4b0f6eed34ef753?section=us_politics
Goodbye Tom
What exactly does a Data Scientist do as a job?
Got an interesting query on LinkedIn
Be a data scientist online with economical courses from Udemy
Sorry if it sounds like an ad, (but it isnt) I was just blown away from these courses for Rs 450 ~ 8 USD each. Apparently 100,000 students have taken the course which I find dubious since I dont really see a 100,000 data scientists when we try and hire . Still it is a good economical package!

Basic Data Analysis using Iris and PySpark
Source file-
In [1]:
!pip install pyspark
In [3]:
from pyspark import SparkContext,SparkConf
sc=SparkContext()
In [4]:
import os
In [5]:
os.getcwd()
Out[5]:
In [6]:
os.chdir('C:\\Users\\Dell\\Desktop')
In [8]:
os.listdir()
Out[8]:
In [10]:
#load data
data=sc.textFile('C:\\Users\\Dell\\Desktop\\iris.csv')
In [11]:
type(data)
Out[11]:
In [12]:
data.top(1)
Out[12]:
In [13]:
data.first()
Out[13]:
In [14]:
from pyspark.sql import SparkSession
In [16]:
spark= SparkSession.builder \
    .master("local") \
    .appName("Data Exploration") \
    .getOrCreate()
In [17]:
#load data as Spark DataFrame
data2=spark.read.format("csv") \
    .option("header","true") \
    .option("mode","DROPMALFORMED") \
    .load('C:\\Users\\Dell\\Desktop\\iris.csv')
In [18]:
type(data2)
Out[18]:
In [19]:
data2.printSchema()
In [25]:
data2.columns
Out[25]:
In [28]:
data2.schema.names
Out[28]:
In [27]:
newColumns=['Sepal_Length', 'Sepal_Width', 'Petal_Length', 'Petal_Width', 'Species']
In [30]:
from functools import reduce
In [32]:
data2 = reduce(lambda data2, idx: data2.withColumnRenamed(oldColumns[idx], newColumns[idx]), range(len(oldColumns)), data2)
data2.printSchema()
data2.show()
In [33]:
data2.dtypes
Out[33]:
In [35]:
data3 = data2.select('Sepal_Length', 'Sepal_Width', 'Species')
data3.cache()
data3.count()
Out[35]:
In [36]:
data3.show()
In [37]:
data3.limit(5)
Out[37]:
In [50]:
data3.limit(5).show()
In [45]:
data3.limit(5).limit(2).show()
In [61]:
data4=data2.selectExpr('CAST(Sepal_Length AS INT) AS Sepal_Length')
In [62]:
data4
Out[62]:
In [63]:
from pyspark.sql.functions import *
In [65]:
data4.select('Sepal_Length').agg(mean('Sepal_Length')).show()
In [66]:
data5=data2.selectExpr('CAST(Sepal_Length AS INT) AS Sepal_Length','CAST(Petal_Width AS INT) AS Petal_Width','CAST(Sepal_Width AS INT) AS Sepal_Width','CAST(Petal_Length AS INT) AS Petal_Length','Species')
In [67]:
data5
Out[67]:
In [68]:
data5.columns
Out[68]:
In [76]:
data5.select('Sepal_Length','Species').groupBy('Species').agg(mean("Sepal_Length")).show()

