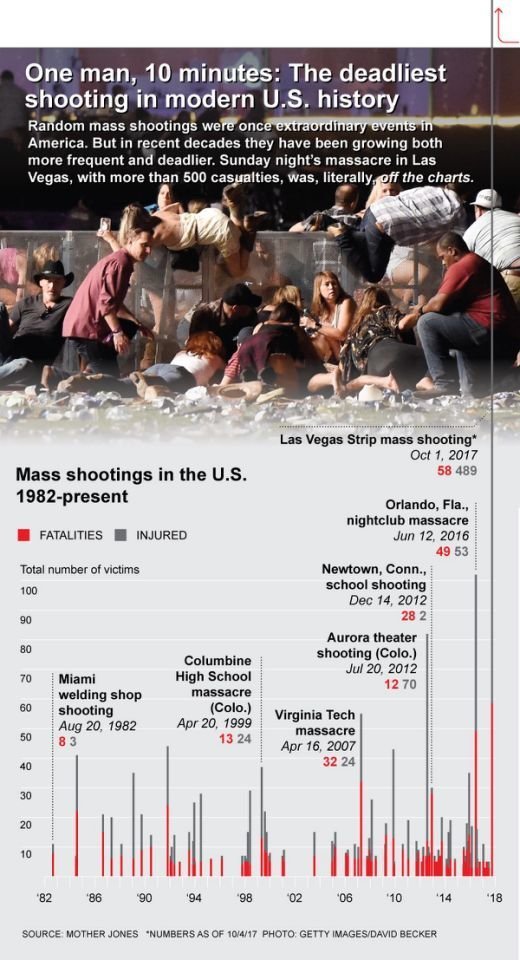
Edward Tufte in his seminal book talked of lie factor. See image below, and how columbine seems higher than virginia tech thanks to the dotted line even though it had 50% less casualities
http://www.infovis-wiki.net/index.php/Lie_Factor
The “Lie Factor” is a value to describe the relation between the size of effect shown in a graphic and the size of effect shown in the data.
Edward Tufte, Prof. at the Yale University, defined the “Lie Factor” in his book “The Visual Display of Quantitative Information” in 1983.
He states the principle that
The representation of numbers, as physically measured on the surface of the graphic itself, should be directly proportional to the quantities represented.
Image from http://www.huffingtonpost.com/entry/what-will-happen-to-the-las-vegas-shooters-suite-at-mandalay-bay_us_59d6721ae4b0f6eed34ef753?section=us_politics