Some SAS code for beginners

So I was talking to someone on SAS University Edition  and I wanted to show how easy SAS language is. This was some code I came up with with output commented out

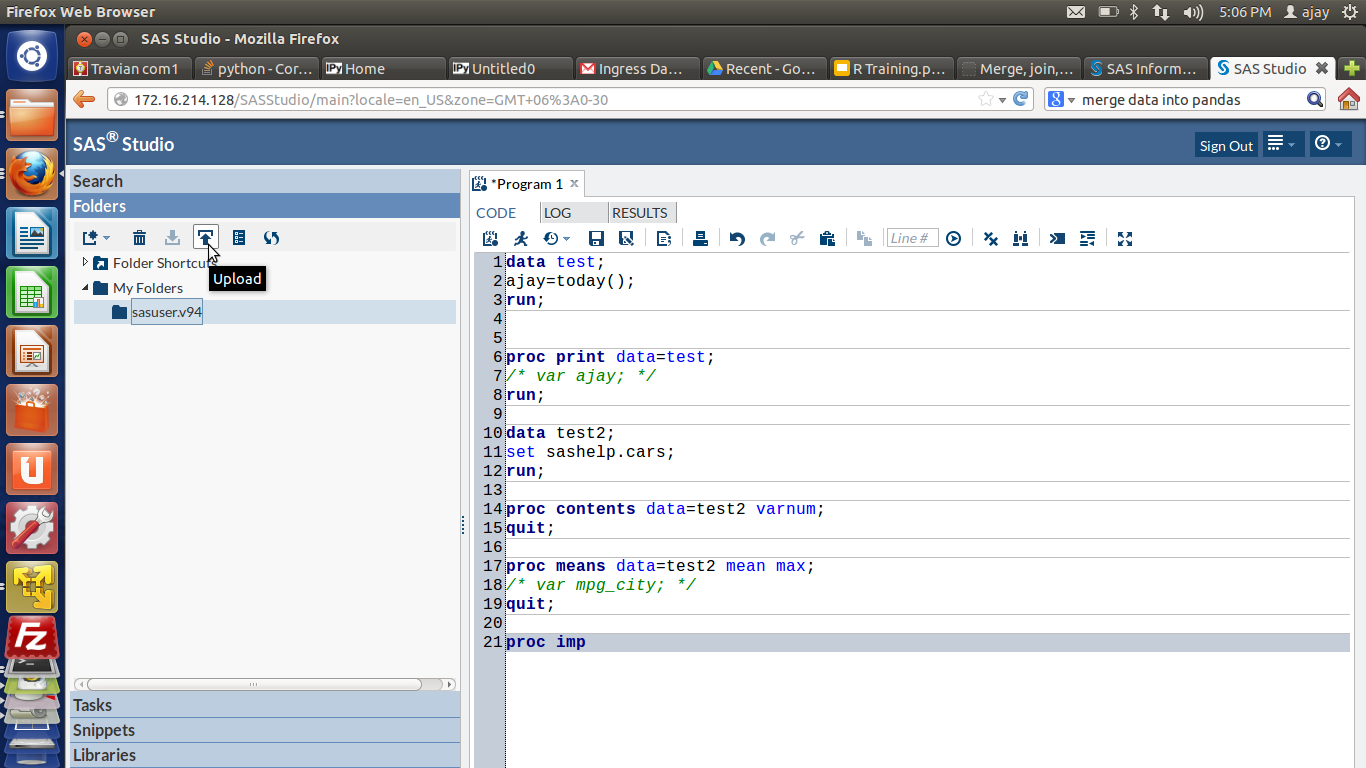
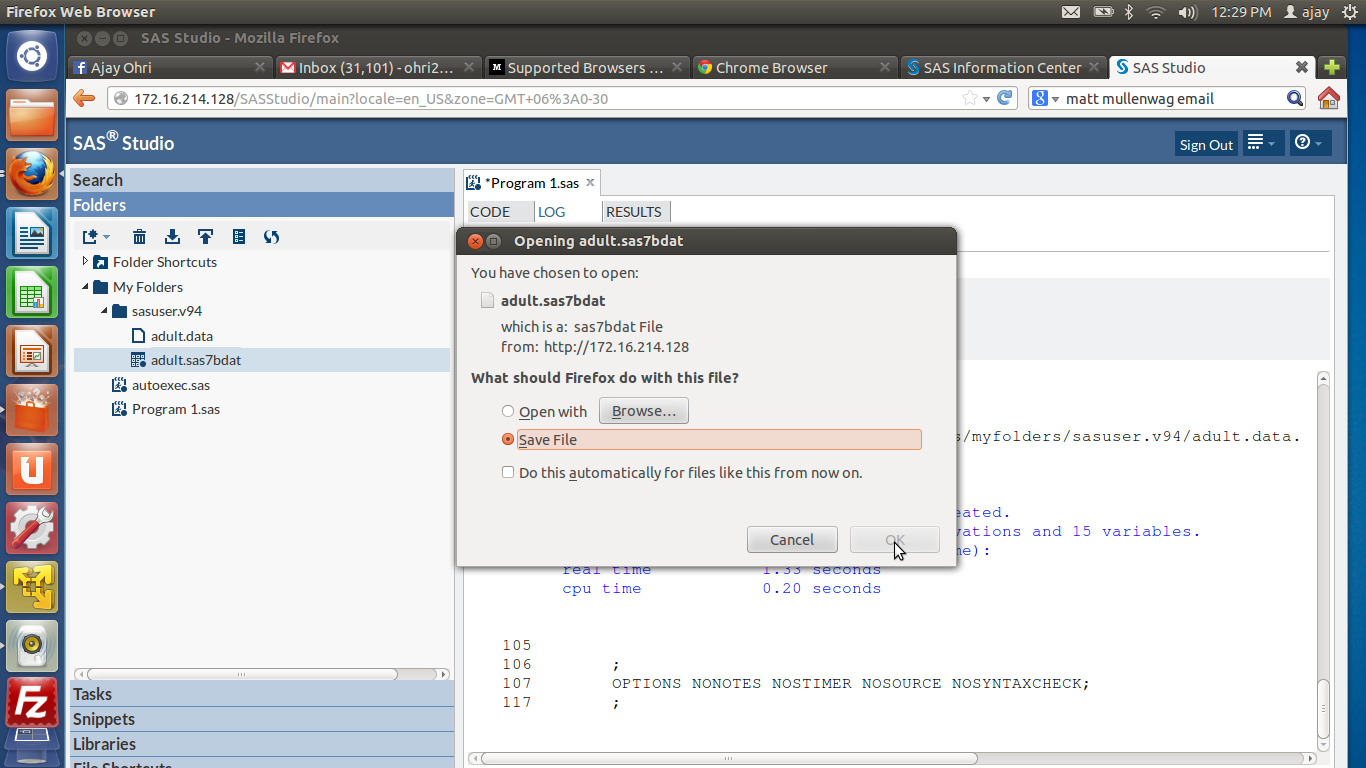
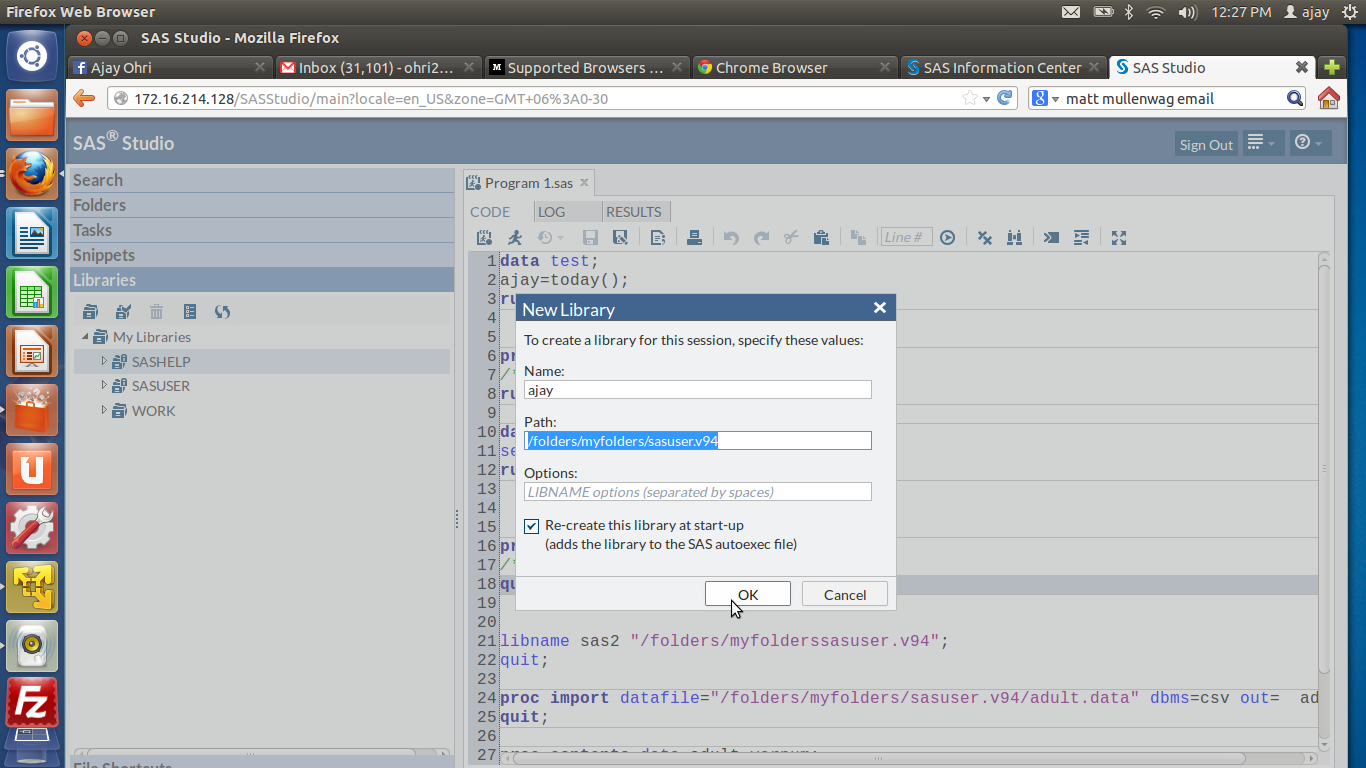
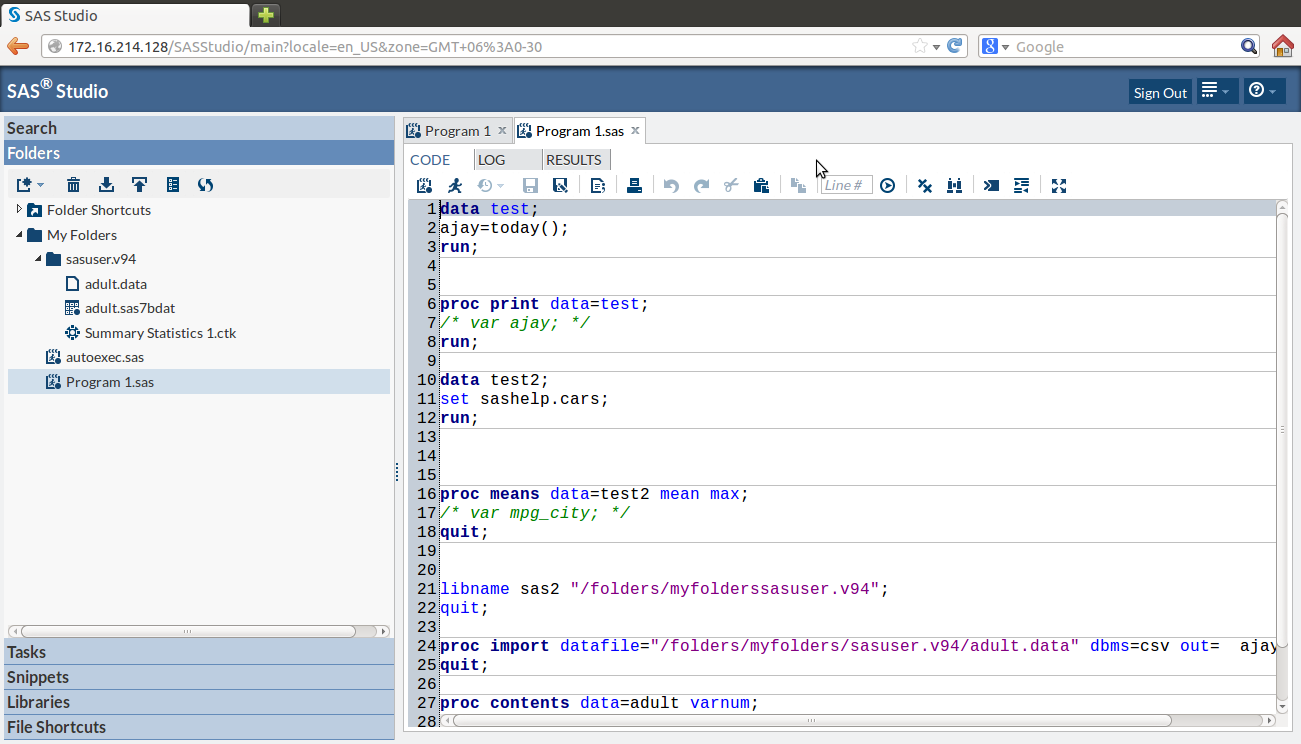
SAS code here;

/*NOTE COMMENTS CAN BE GIVEN BY SELECTING A LINE AND PRESSING CTRL and / */
/* AUTOEXEC file loads starting up commands*/
/* Using different formats */
data test;
format ajay ddmmyy6. ajay2 date9.;
ajay=today();
ajay2=today();
ajay3=today();
run; 

/* printing out output */
proc print data=test;
run;


/* The SAS System */
/* Obs ajay ajay2 ajay3 */
/* 1 080315 08MAR2015 20155 */
/* what datasets are there in a library */
proc datasets lib=work;
quit;

proc datasets lib=sashelp;
quit;

/* copying a dataset from one to another */
data test2;
set sashelp.cars;
run;

/* NOTE: The data set WORK.TEST2 has 428 observations and 15 variables. */
/* conditionally copying a dataset from one to another */
data test2;
set sashelp.cars;
where cylinders=8;
run;

/* */
/* NOTE: There were 87 observations read from the data set SASHELP.CARS. */
/* WHERE cylinders=8; */
/* what variables are there in a dataset */
proc contents data=test2 varnum;
quit;

/* what is the frequency and number of levels of certain variables in a dataset */
proc freq data=sashelp.cars nlevels;
tables make*cylinders/nocol nopercent nocum norow;
quit;

/* what is a cross tab frequency of two or more variables */
proc freq data=test2;
tables make*cylinders;
quit;

/* what are some summary statistics of a variable */
proc means data=test2;
var mpg_city;
quit;

/* The MEANS Procedure */
/* Analysis Variable : MPG_City MPG (City) */
/* N Mean Std Dev Minimum Maximum */
/* 428 20.0607477 5.2382176 10.0000000 60.0000000 */

/* what are some summary statistics of a variable grouped by a class variable */
proc means data=test2 n p1 p75 std median mean max;
var mpg_city;
class cylinders;
quit;

/* The MEANS Procedure */
/* Analysis Variable : MPG_City MPG (City) */
/* Cylinders N Obs N 1st Pctl 75th Pctl Std Dev Median Mean Maximum */
/* 3 1 1 60.0000000 60.0000000 . 60.0000000 60.0000000 60.0000000 */
/* 4 136 136 18.0000000 26.0000000 5.2093430 24.0000000 24.9411765 59.0000000 */
/* 5 7 7 18.0000000 20.0000000 0.8997354 20.0000000 19.8571429 21.0000000 */
/* 6 190 190 14.0000000 20.0000000 1.7630130 19.0000000 18.5157895 23.0000000 */
/* 8 87 87 10.0000000 17.0000000 1.8912565 16.0000000 15.8735632 18.0000000 */
/* 10 2 2 10.0000000 12.0000000 1.4142136 11.0000000 11.0000000 12.0000000 */
/* 12 3 3 12.0000000 13.0000000 0.5773503 13.0000000 12.6666667 13.0000000 */
/* making a libname */
libname sas2 "/folders/myfolderssasuser.v94";
quit;

/* importing data from a file */
proc import datafile="/folders/myfolders/sasuser.v94/adult.data" dbms=csv
out=ajay.adult;
quit;

proc contents data=adult varnum;
quit;
/*--Histogram--*/
proc sgplot data=sashelp.cars(where=(type ne 'Hybrid'));
histogram mpg_city;
/* density mpg_city / lineattrs=(pattern=solid); */
/* density mpg_city / type=kernel lineattrs=(pattern=solid); */
/* keylegend / location=inside position=topright across=1; */
/* yaxis offsetmin=0 grid; */
run;
title 'mpg_city';
proc sgplot data=sashelp.cars;
histogram mpg_city ;
/* density mpg_city / lineattrs=(pattern=solid); */
/* density mpg_city / type=kernel lineattrs=(pattern=solid); */
/* keylegend / location=inside position=topright across=1; */
/* yaxis offsetmin=0 grid; */
run;

proc contents data =sashelp.cars varnum;
run;


SAS Data Loader for Hadoop is now a 90 day free trial

From-

http://www.cloudera.com/content/cloudera/en/downloads/quickstart_vms/cdh-5-3-x.html


SAS Data Loader for Hadoop eliminates the complexities of writing MapReduce code, with a simple, point-and-click interface that empowers business analysts to prepare, integrate and cleanse big data faster and easier than ever. In addition, data scientists and programmers can run SAS code on Hadoop in parallel for better performance and greater productivity.


Get Started

  1. Download and install Cloudera QuickStart VM for CDH 5.3x.
  2. Download and install either VMware Player 6.0 or later (for Windows) or VMware Fusion for OS X 6.0 (for Mac).
  3. Download and install your 90-day free trial of SAS Data Loader for Hadoop.

and

from

http://www.sas.com/en_us/software/data-management/data-loader-hadoop.html


SAS for R Users

I recently managed to get a copy of SAS University Edition.  Screenshot from 2015-03-04 19:54:34

1) Here were some problems I had to resolve- The download size is 1.5 gb of a zipped file ( a virtual machine image). Since I have a internet broadband based in India it led to many failed attempts before I could get it. The unzipped file is almost 3.5 gb. You can get the download file here http://www.sas.com/en_us/software/university-edition/download-software.html.

Secondly the hardware needed is 64 bit, so I basically upgraded my Dell Computer. This was a useful upgrade for me anyway.

2) You can get an Internet Download Manager to resume downloading in case your Internet connection has issues downloading a 1.5 gb file in one go. For Linux you can see http://flareget.com/download/

and for Windows http://www.internetdownloadmanager.com/download.html


3) I chose VM Player for Linux because I am much more comfortable with VM Player ( Desktop free version). I got that from here ~200 MB https://my.vmware.com/web/vmware/free#desktop_end_user_computing/vmware_player/6_0

Screenshot from 2015-03-04 19:39:17

4) Finally I installed VM Player and Open an Existing Virtual Machine to boot up SAS University Edition  Screenshot from 2015-03-04 19:43:08


I was able to open the SAS Studio at the IP Address provided.

Screenshot from 2015-03-04 21:52:32

5)


I downloaded a   Dataset from this collection here

https://archive.ics.uci.edu/ml/datasets/Adult


6) Then I uploaded it to within the SAS Studio System

Screenshot from 2015-02-28 17:06:34Screenshot from 2015-03-03 12:29:07

7) Lastly I was able to run some basic commandsScreenshot from 2015-03-03 12:27:48

Screenshot from 2015-03-04 21:54:06

I was really impressed by the enhancements made to the interface, the ability to search command help through a drop down, the color coded editor and of course the case insensitive SAS language (though I am not a fan of the semi colon I loved using Ctrl + / for easy commenting and uncommenting)

  1. For a SAS turned R turned SAS coder- here are some views
  2. SAS has different windows for coding, log and output. R generally has one
  3. SAS is case insensitive while R is case sensitive. This is a blessing especially for variable and dataset names.
  4. SAS deals with Datasets than can be considered the same as Rs Data Frame.
  5. R’s flexibility in data types is not really comparable to SAS as it is quite fast enough.
  6. SAS has a Macro Language for repeatable tasks
  7. SQL is embedded within SAS as Proc SQL and in R through sqldf package
  8. You have to pay for each upgrade in SAS ecosystem. I am not clear on the transparent pricing, which components does what and whether they have a cloud option for renting by the hour. How about one web page that lists product description and price.
  9. SAS University Edition is a OS agnostic tool, for that itself it is quite impressive compared to say Academic Edition of Revolution Analytics.
  10. R is object oriented and uses [] and $ notation for sub objects. SAS is divided into two main parts- data and proc steps, and uses the . notation and var system
  11. SAS language has a few basic procs but many many options.
  12. How good a SAS coder you are often depends on what you can do in data manipulation in SAS Data Step
  13. Graphics is still better in R ggplot. But the SAS speed is thrilling.
  14. RAM is limited in the University Edition to 1 GB but I found that still quite fast. However I can upload only a 10 mb file to the SAS Studio for University Edition which I found reasonable for teaching purposes.


Comprehensive Learning Path in R

I have built a comprehensive learning path for professionals, students and researchers at http://www.analyticsvidhya.com/learning-paths-data-science-business-analytics-business-intelligence-big-data/learning-path-r-data-science/

Rather than simply put a list of resources, I have tried to create a structured path which is agnostic to any one source instead takes in best sources for each step or phase in the analytics work flow.

There are links to resources by Hadley Wickham, Revolution , Data Camp, videos, live projects, slideshares, tutorials done in a systematic manner.

Have a look and let me know how this can be made better

LeaRning Path on R – Step by Step Guide to Learn Data Science on R

Screenshot from 2015-03-04 09:17:13

%d bloggers like this: