How to do Logistic Regression

Logistic regression is a widely used technique in database marketing for creating scoring models and in risk classification . It helps develop propensity to buy, and propensity to default scores (and even propensity to fraud ) .

This is more of a practical approach to make the model than a theory based approach.(I was never good at the theory 😉 )

If you need to do Logistic Regression using SPSS, a very good tutorial ia available here

http://www2.chass.ncsu.edu/garson/PA765/logistic.htm

(Note -Copyright 1998, 2008 by G. David Garson.
Last update 5/21/08.)

For SAS a very good tutorial is here –

SAS Annotated Output
Ordered Logistic Regression. UCLA: Academic Technology Services, Statistical Consulting Group.

from http://www.ats.ucla.edu/stat/sas/output/sas_ologit_output.htm (accessed July 23, 2007).

For R the documentation (note :Still searching for R ‘s Logistic Regression ) is here
http://lib.stat.cmu.edu/S/Harrell/help/Design/html/lrm.html

lrm(formula, data, subset, na.action=na.delete, method=”lrm.fit”, model=FALSE, x=FALSE, y=FALSE, linear.predictors=TRUE, se.fit=FALSE, penalty=0, penalty.matrix, tol=1e-7, strata.penalty=0, var.penalty=c(‘simple’,’sandwich’), weights, normwt, …)

For linear models in R –
http://datamining.togaware.com/survivor/Linear_Model0.html

An extremely good book if you want to work with R , and do not have time to learn it is to use the GUI
rattle and look at this book

http://datamining.togaware.com/survivor/Contents.html

Fast R Graphics

So you don’t know R  because you were always working on office projects and did not have time to learn. The R list looked down on you and told you to read the documentation first. And then you needed to create some fast R graphics and some R code.

Help is here-

Download R from http://www.r-project.org,install it

open it-go to packages> set CRAN Mirror > to your country from drop down

type following in the R GUI near the ‘ >’ prompt-

“install.packages(“rattle”, dependencies=TRUE)”

so it should loook like

>install.packages(“rattle”, dependencies=TRUE)

Wait 15 minutes while downloads happen

Then packages>load package>rattle

Type rattle() at the command prompt

Now – in the new window called Rattle

load data from a .csv file using the browse options

click execute

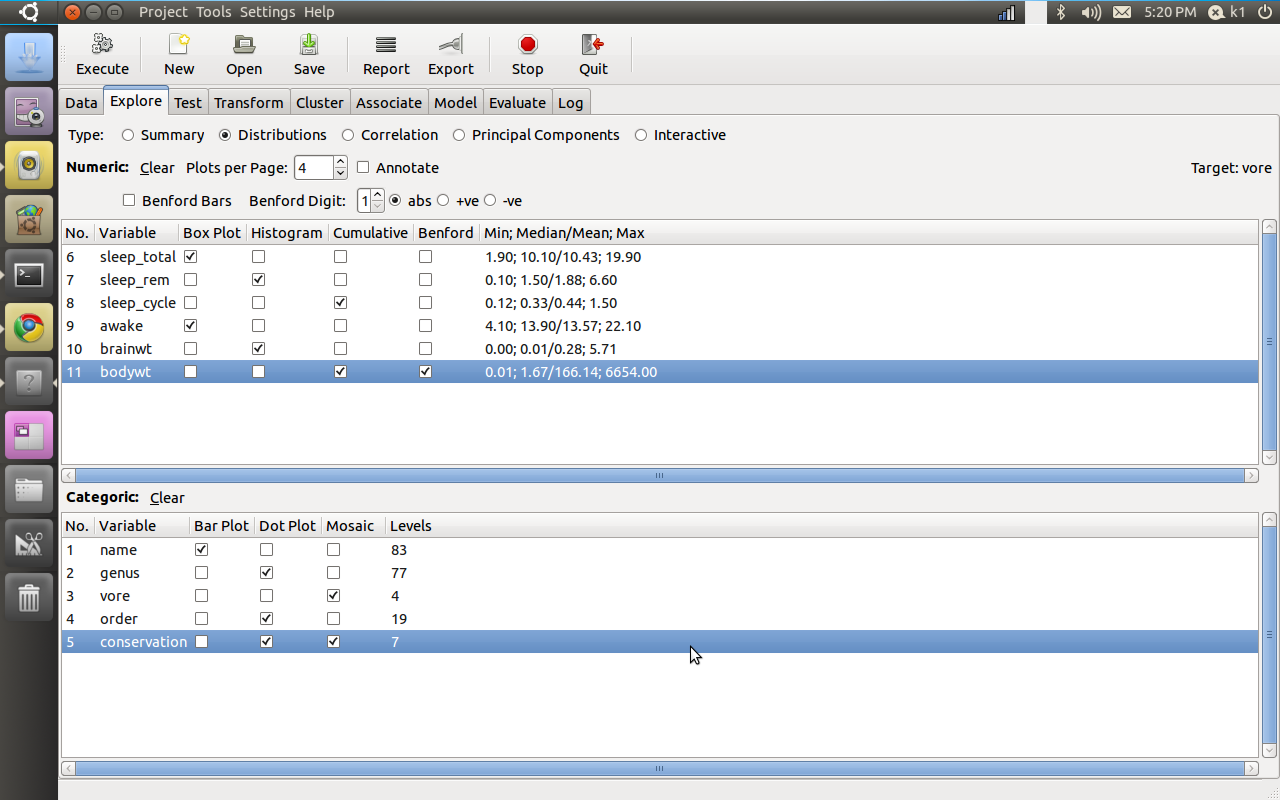
Go straight to Explore-and click on distibutions.

Note you can also download rattle from www.rattle.togaware.com , these guys are the best.

Here are the graphs


But what about the code (note some variable names disguised).The code may be intimidating to a novice R user but it is auto generated , its like jumping straight to SAS Enterprise without learning SAS Editor-

Go to the last tab -log and

see the auto generated code.


The R wars- continued

Here is an excellent presentation on R vs SPSS vs SAS. Its favorablein analysis towards R, but still a very informative piece.

The original link is from –http://www.matthewckeller.com/Lecture1.ppt

Here are a few snapshots for comparing multiple packages-

Other Comparisons with Base SAS (a SAS Institute Copyrighted Product ) can be found at http://www.ats.ucla.edu/stat/technicalreports/

or by searching packages at http://finzi.psych.upenn.edu/search.html


Outsourcing Analytics:Some Trends

1) Eastern Europe has definitely come up and so is China in basic outsourcing processes. For more complex processes India remains the primary destination and sometimes act as managers to East European and China new outsourcers.EU countries delivery centers enjoy less stringent data norms. The Chinese speak much worse English and are better mathematicians. So are the East Europeans.

Some of this out sourcing 2.0 is driven by Indian companies who want to mitigate risks of rupee and have global delivery 24 * 7 and also enjoy EU norms of data protection.

2) Cutting costs through open source software like R, better solutions like WPS could also get big.

You can also see fragmentation to consultants as technology like remote desktop and skype allows low risk  remote working.

Consolidation of KPO and BPO has been problematic and disappointing in expectations at least in India.

Next big big trend depends on how 2008 US Recession and politics plays out as USA remains the biggest source of outsourcing business and trends in this field

Learning R Easily :Two GUI's

Both Rattle and R Commander are very good GUI’s (graphical user interface) for R, and considerably easier for a beginner than the command line console ( but I am more partial to RCmdr for normal statistical analysis while Rattle seemed to have better Data Mining Interfaces and functionality).

Here is a snapshot for both of them.

Installing them both is a breeze as you set a CRAN Mirror from Normal R Console and install package from list of package names . R has hundreds of packages (All free!!) and you can thus install specific packages to your need and usage.The software R automatically downloads and installs them.

rcommdr.GIF..

Installling both these GUI will ensure you cut down the time to learn commands as you can first click and try and learn the syntax that is auto generated side by side.

rattle.GIF

Learning R Easily :Two GUI’s

Both Rattle and R Commander are very good GUI’s (graphical user interface) for R, and considerably easier for a beginner than the command line console ( but I am more partial to RCmdr for normal statistical analysis while Rattle seemed to have better Data Mining Interfaces and functionality).

Here is a snapshot for both of them.

Installing them both is a breeze as you set a CRAN Mirror from Normal R Console and install package from list of package names . R has hundreds of packages (All free!!) and you can thus install specific packages to your need and usage.The software R automatically downloads and installs them.

rcommdr.GIF..

Installling both these GUI will ensure you cut down the time to learn commands as you can first click and try and learn the syntax that is auto generated side by side.

rattle.GIF

Choosing GUI for R :Simplify

While trolling through R literature, came across some good GUI ‘s for R. I am currently experimenting with two of them .

Out of these I can recommend R Commander http://socserv.mcmaster.ca/jfox/Misc/Rcmdr/ 

Not only is the GUI quite neat and clean, the interface actually prints out R code for you. so its a great help if you are learning R and want to learn and do projects at the same time. I imported a dataset of 200,000 rows and while it did take 3-5 secs longer than SAS or SPSS would have taken —Its very very good for a free STATS package. The graphics are also quite good , and I currently evaluating the modeling and scoring capabilities as well .

The second GUI is Rattle. http://rattle.togaware.com/radownload.html 

It is slightly less easy to install than R Commander which automatically downloads the dependencies in terms of packages and its also bigger (nearly 15 mb) for a dependency named RGtk2.

Coming up , a side by side comparison of these two GUI’s in terms of modeling and a search for additional GUIs.

Speaking of search, there  is a FireFox Add on for searching R specific material.