A very basic example of why R Documentation is “expert friendly” while SAS language documentation is “user friendly”
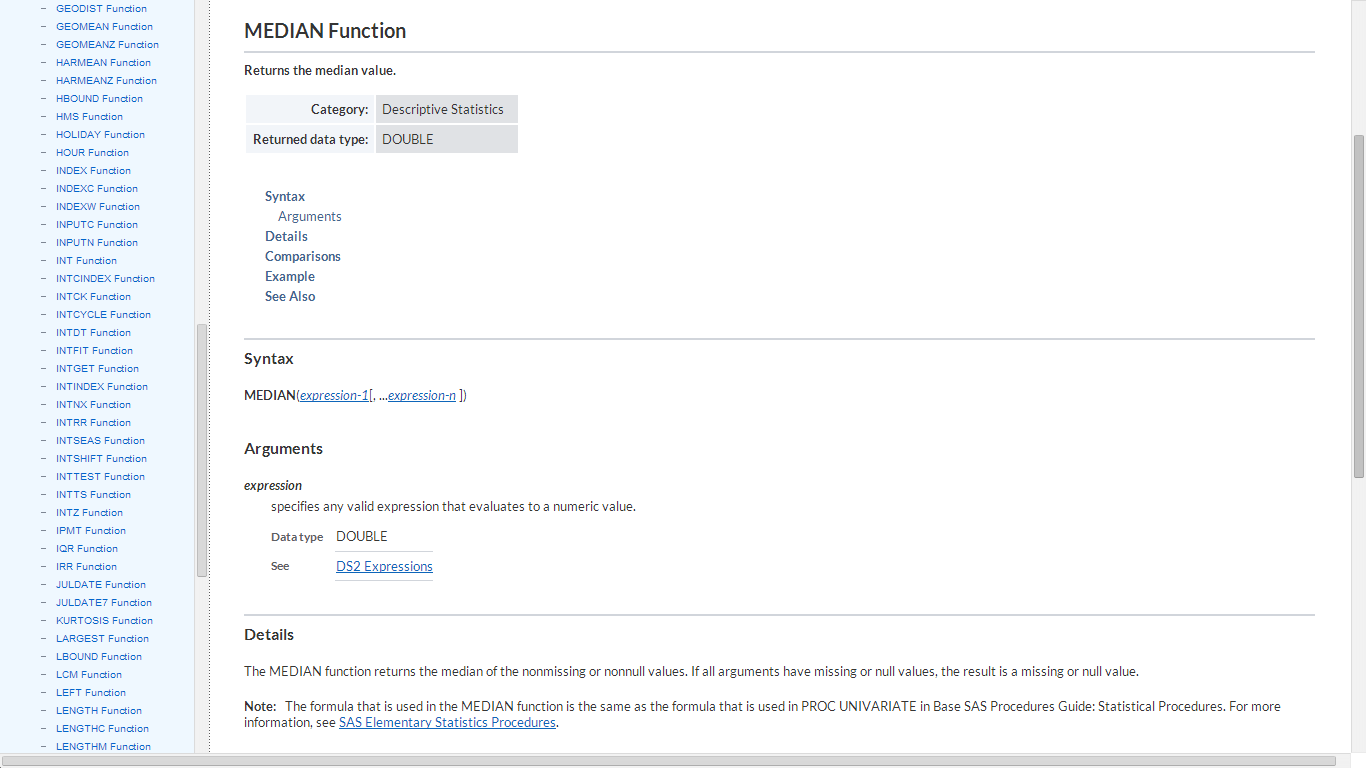
From- a Quora thread 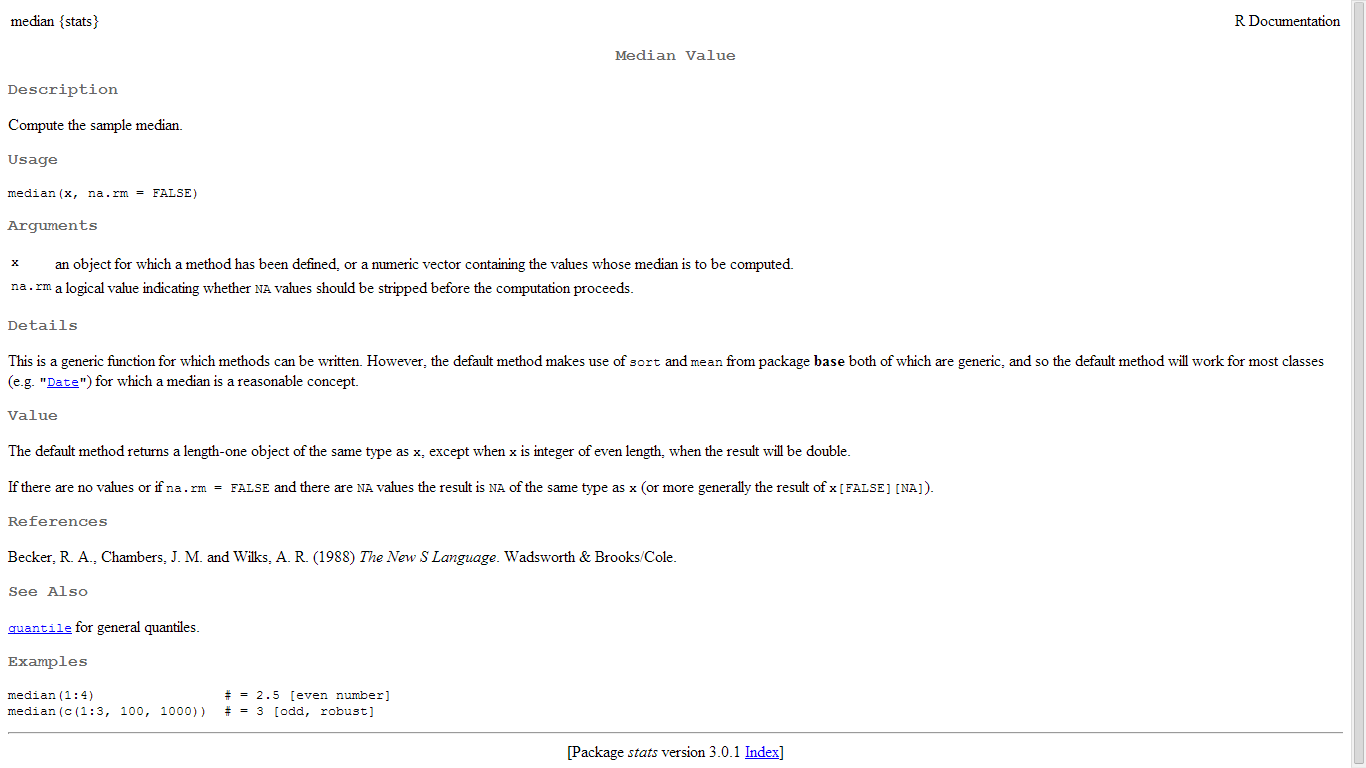

A very basic example of why R Documentation is “expert friendly” while SAS language documentation is “user friendly”
From- a Quora thread
The New Delhi R User Group has now 218 members. We have been meeting regularly since Ocr 2012, and last year we even took Revolution’s generous offer of basic sponsorship with an application this year for a higher level sponsorship.
Meetups are something are new here. We are looking to expand the analytics open source ecosystem here in India- and we welcome any analytics company near NCR area willing to donate office space in Gurgaon , Noida, Delhi once a month to host us.
It is great to see the energy of the next analytics generation and I feel honored to be surrounded by so many bright and young engineers.
related- http://www.revolutionanalytics.com/r-user-group-sponsorship-program

I was reading a review copy of this fine book ” R for Quantitative Finance” when I came across a GUI for Finance in R – its called the GUIDE package and it’s absolutely is a must for people wanting to try out R based Quant Finance for a risk free trial 😉
I think it can be used to further spread R in the area of teaching finance courses.
See it yourself-
an email I get from a student when i am teaching R
————————————————————–
Hello Ajay,
Here are some ways I can suggest to potential clients they can start with R immediately even if they dont have trained people
1) Get R Excel-
This enables R functions as functions within Excel
http://rcom.univie.ac.at/download.html
Our Wiki has < a href=”http://homepage.univie.ac.at/erich.neuwirth/php/rcomwiki/doku.php?id=wiki:how_to_install>instructions how R needs to be installed to work with our tools.
RExcel
The current version is RExcel 3.2.14. The Home and Student version and the Educational version work only with 32bit versions of Excel (which can be installed on 64bit versions of Windows). The Excel versions supported are 2003, 2007, 2010, and 2013.
RExcel 3.2.14 (and later versions) require R 2.15.0 (or later).
You will have to install
- a suitable version of R
- a matching version of rscproxy
- statconnDCOM or rcom with statconnDCOM
Download RExcel 3.2.14
Download REXCEL HOME AND STUDENT USE LICENSE
Detailed instructions for installing can be found in our Wiki
also the book
http://www.amazon.com/Through-Excel-Spreadsheet-Interface-Statistics/dp/1441900519
R, a free and open source program, is one of the most powerful and the fastest-growing statistics program. Microsoft Excel is the most widely used spreadsheet program, but many statisticians consider its statistical tools too limited.
In this book, the authors build on RExcel, a free add-in for Excel that can be downloaded from the R distribution network. RExcel seamlessly integrates the entire set of R’s statistical and graphical methods into Excel, allowing students to focus on statistical methods and concepts and minimizing the distraction of learning a new programming language.
Data can be transferred between R and Excel “the Excel way” by selecting worksheet ranges and using Excel menus. R’s basic statistical functions and selected advanced methods are available from an Excel menu. Results of the computations and statistical graphics can be returned back into Excel worksheet ranges. RExcel allows the use of Excel scroll bars and check boxes to create and animate R graphics as an interactive analysis tool.
2) Use R Commander
Very easy to use GUI- start working with R without writing a single line of code! See http://socserv.mcmaster.ca/jfox/Misc/Rcmdr/ 
The R-Commander GUI consists of a window containing several menus, buttons, and information fields. (The menu tree, etc., are shown below.) In addition, the Commander window contains script and output text windows. The R-Commander menus are easily configurable through a text file or, preferably, through plug-in packages, of which many are now available on CRAN.
The menus lead to simple dialog boxes, the general contents of which are more or less obvious from the names of the menu items. These boxes have a common structure, including a help button leading to the help page for a relevant function, and a reset button to reset the dialog to its original state.
By default, commands generated via the dialogs are posted to the output window, along with printed output, and to the script window. Lines in the script window can be edited and (re)submitted for execution. Error messages, warnings, and “notes” appear in a messages window.
Note you can do time series forecasting using the e pack plugin for R commander
3) Use Rattle
a very comprehensive data mining GUI in R
http://rattle.togaware.com/
Version 3.0.2 release 169 dated 2014-02-20.
> install.packages(“rattle”, repos=”http://rattle.togaware.com”, type=”source”)
$ wget http://togaware.com.au/access/rattle_3.0.2.tar.gz
Rattle (the R Analytical Tool To Learn Easily) presents statistical and visual summaries of data, transforms data into forms that can be readily modelled, builds both unsupervised and supervised models from the data, presents the performance of models graphically, and scores new datasets.
4) Dont use R but use WPS a SAS language clone
upto 50 % cheaper by some estimates you can try this SAS language clone for free here http://www.teamwpc.co.uk/tryorbuy/evaluations
5) okay use Oracle R or Revolution R Community
R by Oracle is free
so is the R Community by Revolution Analytics (basically everything but the Revo Scaler package)
http://info.revolutionanalytics.com/download-revolution-r-community.html
6) Use Revolution R on the cloud , and pay by hour , but first few hours are free
https://aws.amazon.com/marketplace/pp/B00GHXJZVY
————————————————————————
Setting up an analytics shop has never been so easy in history before in the past 50 years!
The amazing Rmaps makes maps even more data scientisty (or sexy 😉 ) than before by adding incredible javascript like interactivity to people who can just type (or copy and paste)
a few lines of R code
A great analysis of Mexico
http://rcharts.io/viewer/?9223554#.Uw4hOPmSySp
Now if could only persuade the very busy creator of the package to honor his promise of sending the interview answers 🙂 !!
Also see-
https://decisionstats.com/2013/08/19/the-wonderful-ggmap-package-for-spatial-analysis-in-r-rstats/
A great tutorial from one of my students Kaify Rais, he is founder of http://vabida.com/ an analytics company
It is about using Twitter and R together for political sentiment analysis which is going to be this year’s analytics buzzword in India since 2014 is the year of elections

 Brochure