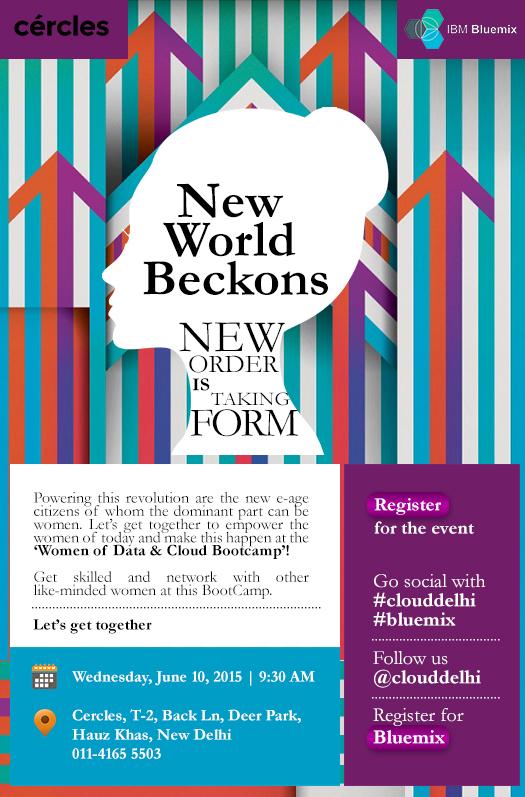
Interesting IBM event at Cercles Delhi

I was there on June 10 to attend the hands-on-session cum event for IBM’s PaaS offering IBM Bluemix. The event took place at http://cercles.co.in/ which is a relatively new startup coworking space in Hauz Khas Village Delhi. Since this was just 5 minute walk from where I currently live, I attended along with an intern and a colleague of my new training company http://decisionstats.org The event was nicely organized, the infrastructure was good, the speakers were quite awesome. To read what really happened you can see the summary at the clouddelhi hashtag.

One thing I noticed R is not really given as much attention in Bluemix. I particularly found IBM Watson APIs (which are RESTful) to be a great case for #rstats packages .

Bluemix has a nice interface, and they are offering 30 day free which is quite low compared to 1 yr of AWS. IBM is focussed on hybrid cloud for enterprises and opportunities for people like us depend on becoming ISV (Independent Software Vendors) or Partners in the IBM ecosystem https://twitter.com/hashtag/CloudDelhi?src=hash

Fortunately I didnt have to speak. I liked Cercles well enough to book a seat for my startup  for the next month something which I have not done so despite considering two-three other co-working hubs in the past in Delhi-Gurgaon.

An additional thing was Woman in Tech as a theme. I found some of the reactions interesting there. Perhaps Governments need to adopt the Woman in Tech theme, but they seem ignorant and uninformed as corporations try to tweak their policies to gain and retain talent, than advise policy makers to help create a better ecosystem. CG_ch8dWoAAsTmR
KDnuggets Poll -Is Rapid Miner 3 times more used as SAS

16th annual KDnuggets Software Poll continued to get huge attention from analytics and data mining community and vendors, attracting about 2,800 voters, who chose from a record number of 93 different tools.

from

http://www.kdnuggets.com/2015/05/poll-r-rapidminer-python-big-data-spark.html

What seems a rather disquieting sampling error-

RapidMiner remains the most popular suite for data mining/data science, but it got fewer votes than last year


The top 10 tools by share of users were

  1. R, 46.9% share ( 38.5% in 2014)

  2. RapidMiner, 31.5% ( 44.2% in 2014)

  3. SQL, 30.9% ( 25.3% in 2014)

  4. Python, 30.3% ( 19.5% in 2014)

  5. Excel, 22.9% ( 25.8% in 2014)

  6. KNIME, 20.0% ( 15.0% in 2014)

  7. Hadoop, 18.4% ( 12.7% in 2014)

  8. Tableau, 12.4% ( 9.1% in 2014)

  9. SAS, 11.3 (10.9% in 2014)


I really dont think Rapid Miner has three times SAS users. I have no doubts on the credibility of the poll but there seems either sampling bias or something plain wrong here

!!!!

and 44.2 % of users used Rapid Miner last year ( I dont think one in two data miners uses Rapid Miner)

So there is some error here- or maybe different ways of counting a user or not!!

Moobhi Review- Piku Emotion in Motion

Shoojit Sircar has written a love poem to the saga of probashi Bongalis, Kolkatta longing and the fine yet quixotic and sometimes insular Bong culture. He has relied on shortcuts and stereotypes to finish the story in the time alloted. Deepika looks great with Kajal laced Bengali Eyes, but someone needs to tell her to get accent training. Irrfan can act better with his eyes and mouth closed, than Karan Johar can act with his entire body.

Amitabh Bachchan just disappears into his role as Bhaskar Da. Moushmi Chatterjee lifts occasional sag into the story pace. What a nice story? If only non Bengalis knew more about their culture than just Bengali sweets.

piku-mos_650_103114032933

Dealing with zip files in R #rstats

> setwd("/home/ajay/Downloads")
> a=dir()
> class(a)
[1] "character"
> grep(".zip",a)
[1]  37  38  41  43  88  96 133
> b=grep(".zip",a)
> a[b]
[1] "alissa-coming-soon-v2-0(1).zip"            
[2] "alissa-coming-soon-v2-0.zip"               
[3] "CAX_EMC_Journalist_Data.zip"               
[4] "CAX_EMC_Racer_Data.zip"                    
[5] "matlab_R2015a_glnxa64.zip"                 
[6] "Photos.zip"                                
[7] "unvbasicvapp__9411003__vmx__en__sp0__1.zip"
> unzip("CAX_EMC_Racer_Data.zip")
> c=dir() 
library(Hmisc)

> c[c %nin% a] 
[1] "CAX_EMC_Racer_Garmin_Camera.csv" 
[2] "CAX_EMC_Racer_Garmin_Watch_Data.csv"
[3] "CAX_EMC_Racer_Motorcycle_Data.csv"
  ps- I know Hadley's convenient wrappR  packages are all the rage now, but nothing, i repeat
 nothing beats Frank Harell and Ripley's cool packages


Mad Max Movie Review : Why Fury Road is so awesome

  1. They didnot use computer generated effects, they used human generated effects.
  2. They made sure 3D was actually realistic and not just a rip off to charge more money.
  3. Tom Hardy and Theron are awesome actors. So are Hoult. No the splendid wifey was not a splendid actress again.
  4. The same director and the same villain as 1979! movie
  5. Design ! Design !
  6. Witness the V8 riding off to Valhalla.
  7. The sound track was actually appropriate to the context and delivered!
  8. Double guitar throwing flames from a guitarist suspended in air in a truck full of speakers and drum players!
  9. Mechanical Engineering is much more cool than Computer Science engineering in terms of visual effects :-p
  10. I wish Mel Gibson had made a cameo. or Tina Turner!

DecisionStats Summer School in Delhi 2015 #rstats

This summer get a foothold in the world of data science. These are in classroom trainings for Delhi India and all prices are in INR only.

If you are interested apply here-

bit.ly/decisionstats

Screenshot from 2015-05-20 20:01:25

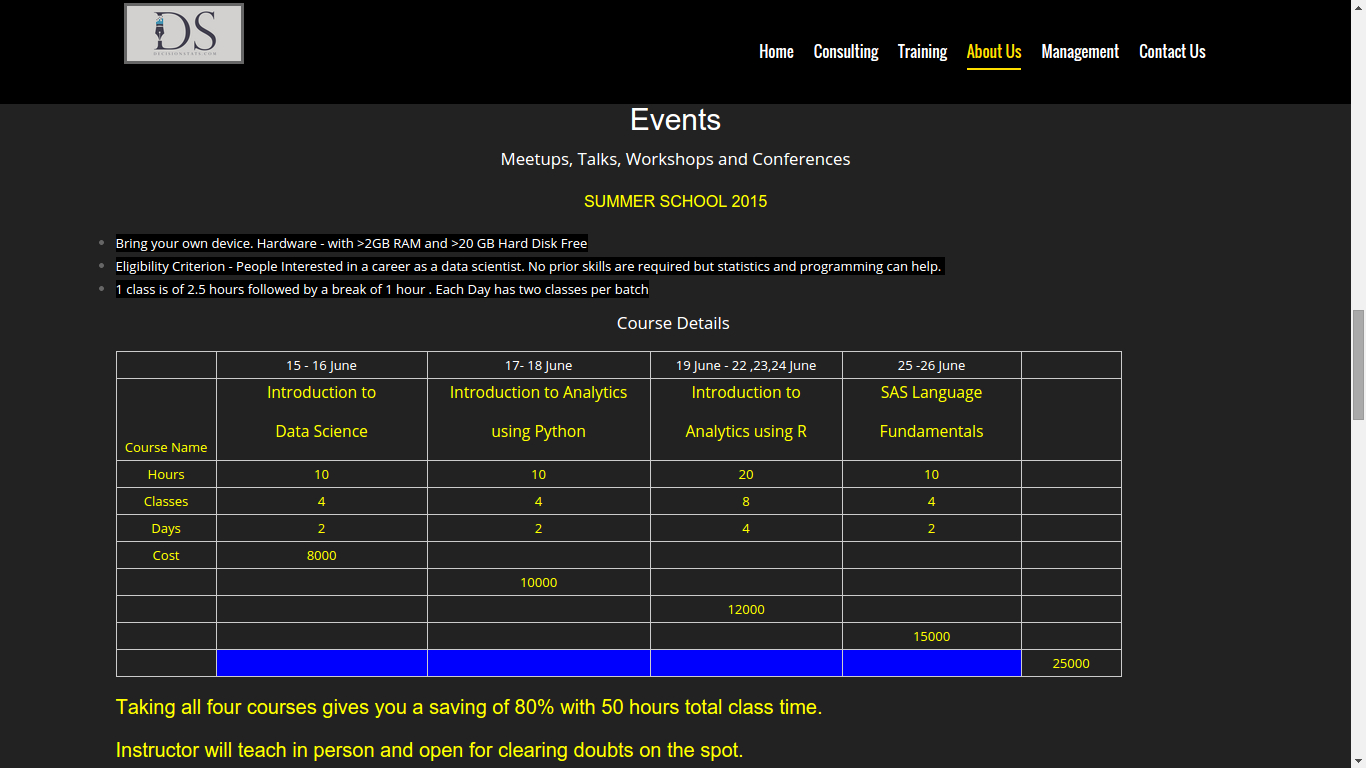
SUMMER SCHOOL 2015

  • Bring your own device. Hardware – with >2GB RAM and >20 GB Hard Disk Free
  • Eligibility Criterion – People Interested in a career as a data scientist. No prior skills are required but statistics and programming can help.
  • 1 class is of 2.5 hours followed by a break of 1 hour . Each Day has two classes per batch

Course Details

15 – 16 June 17- 18 June 19 June – 22 ,23,24 June 25 -26 June
Course Name Introduction to

Data Science

Introduction to Analytics

using Python

Introduction to

Analytics using R

SAS Language

Fundamentals

Hours 10 10 20 10
Classes 4 4 8 4
Days 2 2 4 2
Cost 8000
10000
12000
15000
25000

Taking all four courses gives you a saving of 80% with 50 hours total class time.

Instructor will teach in person and open for clearing doubts on the spot.

Course Outline

Basics of Data Science Introduction to Python Introduction to R Introduction to Interface
Basics of Analytics Introduction to iPython Introduction to R Studio Introduction to SAS language
LTV Analysis Introduction to Pandas Introduction to R Data Step
LTV Analysis Quiz Introduction to iPython Notebook Introduction to Rattle Proc Print
RFM Analysis IDE- IDLE and Spyder Deducer Proc Means and Proc Freq
RFM Analysis Quiz Python 1 Quiz R Quiz 1 SAS Quiz 1
Basic Stats Data Input Data Input Proc Univariate
Introduction to Modeling Data Analysis Data Analysis Do loops
Data Summarization Data Summarization Proc sgplot
Introduction to Google Analytics Data Visualization Data Visualization Proc SQL
Blogging Data Output Data Output SAS Macro Language
Web Analytics Quiz Ipython 2 Quiz R Quiz 2 menu driven options
data.table ODS Output
ggplot
sports analytics SAS Quiz 2
regression model
data mining
R Quiz 3
social network analysis
text mining
time series forecasting
Using apis
association analysis
R Quiz 4
RODBC
sqldf
spatial analytics
RMarkDown
Using Github
R Quiz 5

If you are interested apply here-

bit.ly/decisionstats