Psychology for Data Miners

Over the past few years I have chosen a few tools primarily driven from Psychology to help me manage complex scenarios, difficult clients and problematic questions. The reason for this is quite simple, data science especially predictive analytics is trying to mimic or predict human behavior which is inherently irrational and driven by impulse or need fulfillment. However when human behavior is aggregated as well as segregated we can predict it but for short periods of time after which predictive models decay.

  1. Johari’s Window – source https://en.wikipedia.org/wiki/Johari_window 

philosopher Charles Handy calls this concept the Johari House with four rooms. Room 1 is the part of ourselves that we see and others see. Room 2 is the aspects that others see but we are not aware of. Room 4 is the most mysterious room in that the unconscious or subconscious part of us is seen by neither ourselves nor others. Room 3 is our private space, which we know but keep from others.

Open or Arena: Adjectives that are selected by both the participant and his or her peers are placed into the Open or Arenaquadrant. This quadrant represents traits of the subjects that both they and their peers are aware of.

Hidden or Façade: Adjectives selected only by subjects, but not by any of their peers, are placed into the Hidden or Façadequadrant, representing information about them their peers are unaware of. It is then up to the subject to disclose this information or not.

Blind : Adjectives that are not selected by subjects but only by their peers are placed into the Blind Spot quadrant. These represent information that the subject is not aware of, but others are, and they can decide whether and how to inform the individual about these “blind spots“.

Unknown: Adjectives that were not selected by either subjects or their peers remain in the Unknown quadrant, representing the participant’s behaviors or motives that were not recognized by anyone participating.


2) Hierarchy of Needs Source- https://en.wikipedia.org/wiki/Maslow%27s_hierarchy_of_needs

Maslow used the terms “physiological”, “safety”, “belongingness” and “love”, “esteem”, “self-actualization”, and “self-transcendence” to describe the pattern that human motivations generally move through.

This helps me understand what a client wants with a particular project and what an employee wants when he asks for pay /stock options etc

3) Agency – Owner conflict source- https://en.wikipedia.org/wiki/Principal%E2%80%93agent_problem

The principal–agent problem (also known as agency dilemma or theory of agency) occurs when one person or entity (the “agent“) is able to make decisions on behalf of, or that impact, another person or entity: the “principal“. The dilemma exists because sometimes the agent is motivated to act in his own best interests rather than those of the principal. The agent-principal relationship is a useful analytic tool in political science and economics, but may also apply to other areas.

Common examples of this relationship include corporate management (agent) and shareholders (principal), or politicians (agent) and voters (principal).[1] For another example, consider a dental patient (the principal) wondering whether his dentist (the agent) is recommending expensive treatment because it is truly necessary for the patient’s dental health, or because it will generate income for the dentist.

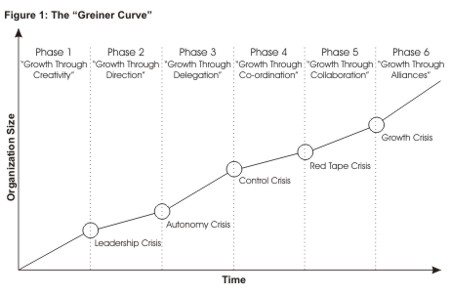
4) Culture of an organization -It changes with time. This graph helps me understand

5) Cognitive Biases- why do rational people make irrational choices. Aha! Cognitive Biases Source-https://en.wikipedia.org/wiki/Cognitive_bias


Cognitive biases are tendencies to think in certain ways that can lead to systematic deviations from a standard of rationality or good judgment, and are often studied in psychology and behavioral economics.

Among the “cold” biases,

  • some involve a decision or judgement being affected by irrelevant information (for example the framing effect where the same problem receives different responses depending on how it is described; or the distinction bias where choices presented together have different outcomes than those presented separately)
  • others give excessive weight to an unimportant but salient feature of the problem (e.g., anchoring)

6) Logical Fallacies- To quickly separate signal from human generated noise or arguments, I wish there was a machine learning algorithm to detect logical fallacies  in NLTP.

7) Motivation (from Sanskrit)  source- http://chanakya.brainhungry.com/saam-daam-dand-bhed-chanakya-neeti/

There are four ways of making someone to do a task, stated as “Saam, Daam, Dand & Bhed”. This sutra by Acharya Chanakya is used worldwide. why? It works and is highly practical. It means:

  • Saam: to advice and ask
  • Daam: to offer and buy
  • Dand: to punish
  • Bhed: exploiting the secrets


Apart from these I also use some seven strategy models for actually understanding business . I learnt in Business School- they are here in quasi -graphical easy to understand format

https://decisionstats.com/2013/12/19/business-strategy-models/


Review Mission Impossible Rogue Nation

I love Mr Tom Cruise sense of humour. Shall we just call it his chutzpah. From the heavy Ving Rhames trying to catch the British rose in the wind, to the very dry raspy voice of the superb villian (perhaps the best) and Benji / Scotty doing one turn. One is only disappointed by the Hurt Locker /Avenger Guy/ Brett Ranner. I mean seriously dude, didnt you hear what they talked about you in Birdman.

And the scenes are lovely. But I wish John Woo directed this one too. Writing was much better this time.

Alec Baldwin reminds us why we love twinkling Irish eyes in our actors.

Go see this one people.

Hackeristan is the new rogue nation and when hackers unite despotic governments shall tremble.

mission-impossible-rogue-nation-simon-pegg


Google Makes Alphabet: World waits for what is next

Apparently the boss of all search engines has a new boss

Will Alphabet lead to value unlocking for financial reasons?

Is it just a cover for anti-trust investigations?

What is common between search and Youtube anyway?

Did Larry’s personal life and wife have something to do with this?

What X is Brin upto?

So many questions, so much time.

Why R data scientists should try out Python ? #rstats #python

At the heart of science is an essential balance between two seemingly contradictory attitudes—an openness to new ideas, no matter how bizarre or counterintuitive they may be, and the most ruthless skeptical scrutiny of all ideas, old and new. This is how deep truths are winnowed from deep nonsense.
An excerpt from my book in progress ( Python for R Users – Wiley 2016)

Why Python for R Users?

To the memory constrained user in R who is neither Hadley Wickham nor Brian Ripley genius like in coding, and who needs a fast open source solution for statistical computing- Python comes with batteries attached.

With Pandas and Seaborn the last excuse of the I can only code for statistics in R and SAS will fall apart. Yes Python is as much open source and free as R. To disavow Python for statistical computing smacks of hypocritical ideology and department level university politics than any basis grounded in statistics.

How is Python different from R?

It’s not better , it’s not worse . It is just different. While almost the whole of R’s ecosystem of packages is dedicated to data analysis , python is much more powerful general purpose language. In that lies both the power and the confusion to the R user coming to Python.
For even a simple function like mean, Python needs to import a package (numpy).  There is no Base , Graphics or Utils that come with Ipython or Python or Cython which immediately helps the new user with functions.

The language syntax is confusing for transition.

  • In R  the index for an object starts with 1 while in Python the index for an object’s first member is 0.

so if

> a=c("Ajay","Vijay")
> a[1]
[1] "Ajay"

in R

while in Python it will be

In [1]: a=[“Ajay”,”Vijay”]

In [2]: a[0]
Out[2]: ‘Ajay’

  • Loading packages in R is done with library(“FUNpackage”) while in Python it can be anything like

import “FUNPackage” as fun, 

or

import “FUNPackage”

or

import onefunctiononly from FUNPackage

  • R depends mostly on functions passing parameters and objects within parenthesis, recent brouhaha over magrittr’s pipe operator not withstanding. Python mostly passes parameters using the dot notation .

If age is a list of numbers then for finding the mean of the numbers in age

mean(age) in R while age.mean() in Python

  • HELP – when you are searching for help in R or Python.  

In R a single question mark denotes help  as searched from loaded packages while ??keyword would search for that keyword in all the packages of R included in the documentation (some of them are in Github universe.

Those are mostly searched by Google > Stack Overflow > Github>R-bloggers.

In Python the help for a particular keyword would be keyword.?

  • Community Python does have a Python Planet but it lacks the appeal of R-Bloggers, and perhaps statistical computing for Python needs a seperate blog aggregator. Also  Pandas doesnot have flashmobs on StackOverflow like R did.
  • The IDE and GUI in R and Python are very different to R as well.

While R has established and distinct GUI like Deducer ( data visualization) , Rattle ( Data Mining) and R Commander ( extensible GUI for statistics, and others) it has multiple IDE with the current champion the private company established by a Microsoft alumnus, RStudio.

Python has IDE like Spyder and IDLE and a recent fork of Ace Editor called Rodeo ( which thus mimics RStudio ‘s inspired by Ace) , but none of them come close the market share in the developer world in statistical computing  that RStudio has ( note I am not going to non statistical applications of either r or python in this book).

Ipython does have a huge appeal but it’s not as easy an IDE as RStudio for non hardcore developers.

PURPOSE– Here I am comparing R and Python solely for the monetary rich but idealogically poor field of business analytics which consumes huge data and generates huge savings for businesses in the world as noted by the annual ever increasing of the non open source egalatarian employee friendly company SAS Institute (which is just a pity because I am sure had SAS Institute been founded in 2006 than in 1976 it’s incredibly awesome founders would have open sourced atleast a few parts of its rather huge offerings).

Why should a R user then learn Pandas/ Python?

This is because a professional data scientsist should hedge his career by not depending on just one statistical computing language. The ease at which a person can learn a new language does decrease with age and it’s best to base your career on more than R. SAS language did lead the world for four decades but in a fast changing world it is best not to bet your mortgage that R skills are all you need for statistical computing in a multi decade career.

Will this lead to confusion?
images
No. Both R and Python are open source and object oriented languages. Learning both can only help your career in the world of data science and business analytics.
Do you want to be the master of your own destiny or do you want to depend on Hadley Wickham or RStudio or Revolution Analytics (Microsoft) to make tools for you?
Learn Python after you have learnt R and you will have an unbeatable resume.
Why am I writing about Python AFTER writing two books on R?
I come from a very poor country, I think open access to statistical computing can help my people and the world, and I am suspicious of any one that says that one software can solve ALL the problems of business analytics
A few sample workflow in analytics for R users but written in iPython-
Adult Dataset
Diamonds Dataset

Interview Aaron Rangel CEO BlueSky Statistics #new #rstats #product

Here is an interview with Aaron Rangel , CEO and creator of BlueSky Statistics which is an open sourced statistical software based on R

Ajay- Describe your career in statistical computing

Aaron- I was first exposed to the power of predictive analytics as a graduate student. Being a software industry professional and working for a startup, most of my early projects in statistical computing were around analyzing web and financial data as a hobbyist using R. This fascination led me to join SPSS as a Product Manager. At SPSS, I was very fortunate to be exposed to how predictive analytics and business intelligence was driving better decision making in a wide variety of industries. My experience both at iManage and SPSS, where I built intuitive applications with graphical user interfaces, convinced me of the value of creating a powerful GUI based application for R which had been soaring in popularity. For me it was a no brainer, R the lingua franca of statistical analysis, when married with a powerful intuitive user interface (typically found in commercial enterprise applications) would provide unprecedented value for the analyst and open source R community.

Ajay- Describe why and how you created this product
Aaron-  I created the product for the following reasons

  1. I wanted to make learning and using R easier. Even though R is extremely powerful both in terms of the breadth and depth of analytics offered, as a beginner several years ago, I was intimidated by the number of packages, the idiosyncrasies of R syntax, the fact that I had to write or modify code for some of the simplest tasks. I strongly believe that an intuitive application with point and click graphical user interface that automates R syntax generation and offers attractive output for the top 100 frequently used analytical functions will save time with repetitive exploratory analysis, data preparation and standard modeling. BlueSky Statistics does not prevent analysts from writing R code and fully supports creating and executing R functions. Our goal is to automate routine tasks with a GUI and write R code for value adding analytics. The bottom line is analysts will be more efficient and will have more time for creative, value adding work.
  2. I wanted to create a one stop shop for the best work in the R community. With 6200 plus packages with a lot of capabilities duplicated across packages, I wanted to create an analytics workbench that showcases the best packages and best practices that R has to offer for analysts and programmers across levels of expertise.
  3. Increase the adoption of R in both the analyst and business user community by focusing on ease of use.

Ajay- Why did you choose R for the back end?

Aaron-  Without a doubt the openness and extensibility. In fact at BlueSky Statistics, we have made every effort to preserve this openness and flexibility. BlueSky Statistics is available in both open source and commercial editions. Additionally, if you want to create a regression dialog with several options to be consumed by a sophisticated analyst or you want to create a simple regression for a statistics 101 class, BlueSky Statistics allows you to throttle the level of sophistication you want to expose. More importantly you can do this without writing a single line of code. Delivering targeted applications with analytical functions trimmed down to ensure that analysts pick the right options or students have a targeted application for learning is very simple to deliver.

Ajay- What are your plans for this product

Aaron-  We have already delivered a comprehensive set of data preparation, exploratory analysis, data modeling and data visualization capabilities. We will continue to build our modeling and machine learning capabilities over the next few months. Our longer term goal is to create a collaborative open source analytics platform through which specialized analytics can be accessed to address a wide variety of business problems across industry verticals, all powered by R.


Ajay- Who do you think is the target audience for this?

Aaron-

  1. The non-programmer analyst community who are accustomed to and need an easy to use user interface available in the commercial statistics marketplace at much higher price points than BlueSky Statistics. We want the adoption of R to proliferate amongst all analysts not just the savvy R programmers.
  2. Newly minted data scientists and machine who are looking to learn R and want to accelerate the R learning curve as well as make avail of the efficiency of a rich GUI at their workplace.
  3. Analysts and R programmers across the experience spectrum. The benefits here are multi-fold
    1. Efficiencies realized by automating routine data preparation, exploratory analysis, reporting and modeling.
    2. As easy way to keep abreast with the latest statistical techniques, visualizations and data preparation methods in the R community. Our goal is to provide a one stop shop for the best packages available in the R community with easy to use GUIs that automate syntax generation which in turn makes learning easy and accelerates productivity.
    3. Sophisticated analytics would like to use the dialog editor program to build a rich GUI for any function in any R package. BlueSky Statistics makes it easy to create and share custom modules that represent new analytical techniques or best practices with other users in their organization resulting in better collaboration and efficiency.
  4. As we add data mining and machine learning capabilities, we would like to see adoption amongst that community as well.


Ajay- Can analytics companies afford one more software to the stack?

Aaron-

Being open source and 100% R based as well as the fact that University graduates across a wide variety of disciplines are already trained in R will be advantageous for us. Additionally with the increasing adoption of R amongst users of commercial statistical applications, we hope that more and more of these users will view us as the preferred alternative because of the large R community, the huge contribution base and innovation pace that no commercial statistical vendor can match.


About-

BlueSky Statistics is a software product based on R which aims at making analytics easier through a Graphical USer Interface through menus. It has both a free and a commercial version which you can see here.

You can contact Aaron Rangel here or download the software here

Get trained in SAS by SAS for Free

These are a list of awesome training resources by a very credible SAS language trainer called SAS Institute.

Screenshot from 2015-08-10 16:00:15

Books are here-

https://www.openintro.org/stat/labs.php?stat_book=os

Get the SAS software for free here-

http://www.sas.com/en_us/software/university-edition.html ( 2gb painful download)

This is the link for training videos

http://support.sas.com/training/tutorial/#s1=3

Now why pay Rs 30,000 or 500$ for SAS language clone or 3rd party trainers when you can get the real thing for free. Also note- they train not just in the software language but also in analytics

Screenshot from 2015-08-10 15:53:13

Oh- How I wish    Microsoft had some more training videos for their Revolution Analytics R. I mean blogs are fine but a global audience is asking more and more skill based education from MOOCs, Open Textbooks, Open Data and Video based Series .

Additionally- I am heartened that SAS Institute has a new Ask the Expert Series as it shows their commitment to STEM education.


Rodeo – Awesome Python IDE based on same tech as RStudio IDE

I am really liking the Rodeo IDE, it has a surprisingly comfortable feel to it, even though these are early days.

One of the reasons it is easy to use is it uses the Ace Editor as the underlying layer, which is the same editor that powers RStudio. It is thus very easy for a R User to use. Add in Pandas package and for a newbie Python User,  switching from R to Python is made quite easy.

Why do it? Well Python is surprisingly powerful for big-ger data. I am talking of the 4 gb -15 gb data range that is predominantly used in the data analytics world and which SAS rules in enterprises. R finds it tough to navigate this and training pure SAS users to intermediate R programming takes an expense as well as business disruption. Python could thus be an alternative arrow in the open source enterprise software arsenal.

RODEO is created by Yhat the startup which is makign waves by using BOTH R and Python.

Screenshot from 2015-08-09 11:16:17

Screenshot from 2015-08-09 11:25:10